
S&P 500: Elliott Wave and Technical Analysis | Charts – January 8, 2021
New all time highs to end the week were expected from the main Elliott wave count. For the very short term, a little pullback to begin Friday’s session was also expected to be brief and shallow, which is exactly how the session began.
Summary: The wave count expects the low of the 30th of October to not be breached for many months or years.
Wave counts are presented in order of probability.
For the short term, the upwards trend may continue to the next target at 4,606. The main wave count expects upwards movement to overall continue with another large consolidation prior to the target to begin before 3,920.24.
The first alternate wave count considers that a larger consolidation may continue lower from here.
The second alternate wave count expects a deeper pullback here.
The third alternate daily chart is judged to have a very low probability. For confidence it requires a new low below 3,549.85 and then below 3,233.94.
The biggest picture, Grand Super Cycle analysis, is here.
Monthly charts are last updated here with video here.
ELLIOTT WAVE COUNT
WEEKLY CHART
Click chart to enlarge.
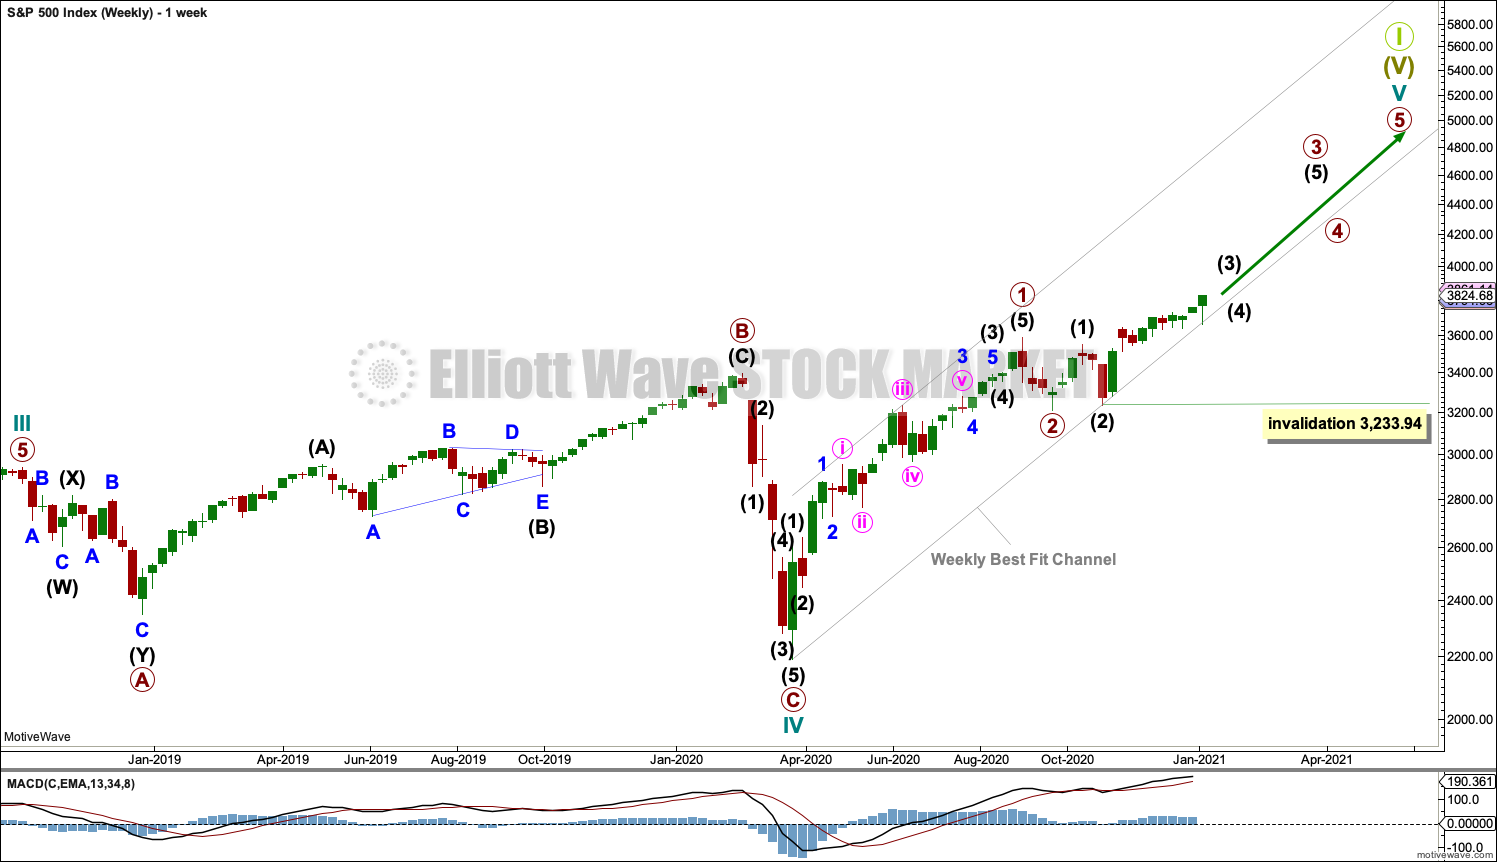
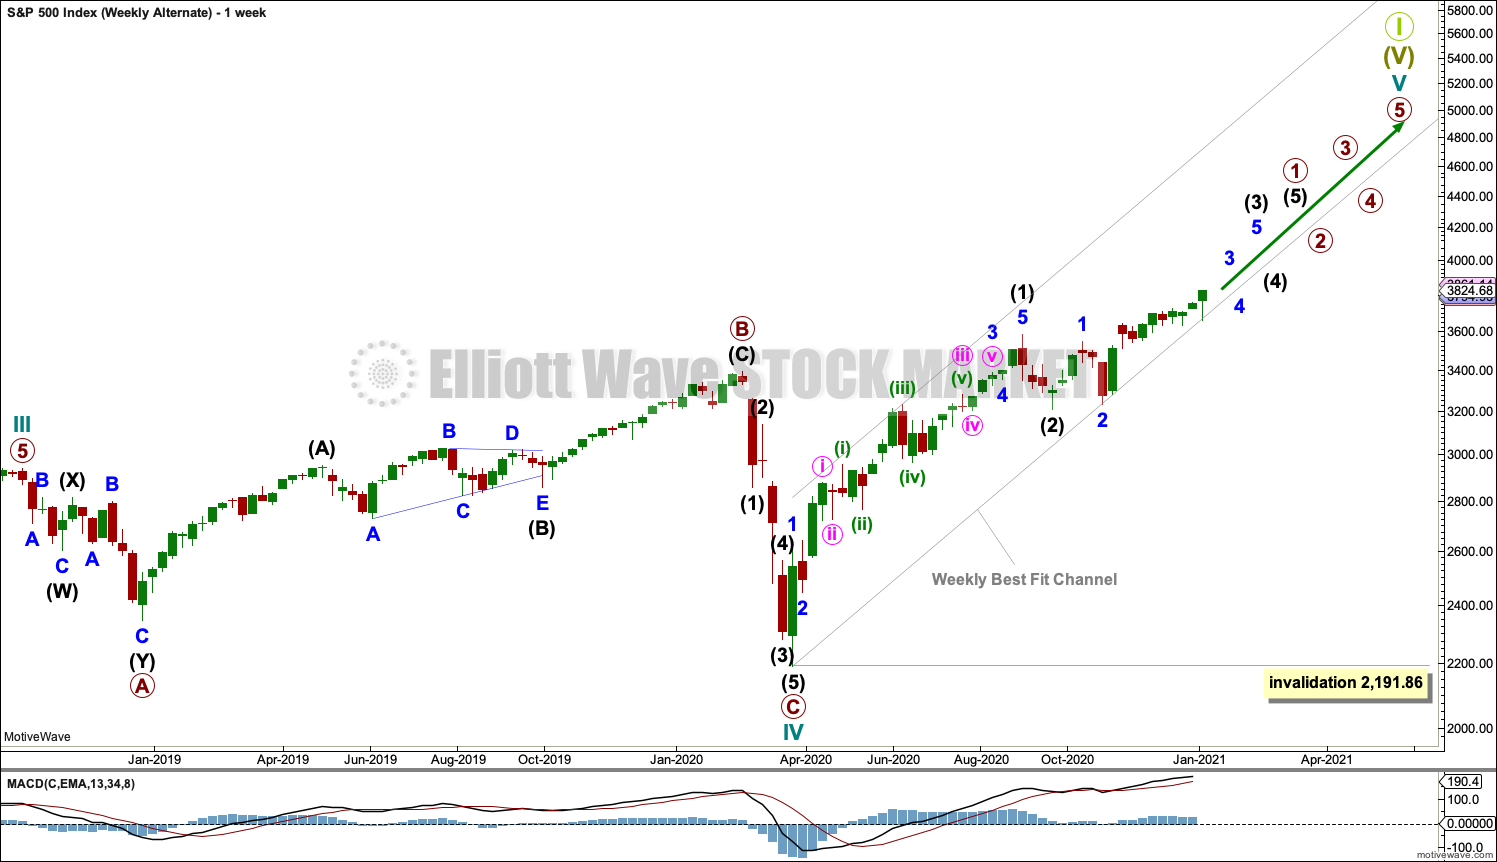
Cycle wave V may last from one to several years. So far it is in its tenth month.
This wave count may allow time for the AD line to diverge from price as price makes final highs before the end of the bull market. The AD line most commonly diverges a minimum of 4 months prior to the end of a bull market. A longer divergence is positively correlated with a deeper bear market. A shorter divergence is positively correlated with a more shallow bear market. With zero divergence at this stage, if a surprise bear market does develop here, then it would likely be shallow.
Cycle wave V would most likely subdivide as an impulse. But if overlapping develops, then an ending diagonal should be considered. This chart considers the more common impulse.
Primary waves 1 and 2 may be complete.
Primary wave 3 may only subdivide as an impulse.
There is already a Fibonacci ratio between cycle waves I and III within Super Cycle wave (V). The S&P500 often exhibits a Fibonacci ratio between two of its actionary waves but rarely between all three; it is less likely that cycle wave V would exhibit a Fibonacci ratio. The target for Super Cycle wave (V) to end would best be calculated at primary degree, but that cannot be done until all of primary waves 1, 2, 3 and 4 are complete.
MAIN WAVE COUNT
DAILY CHART
Click chart to enlarge.
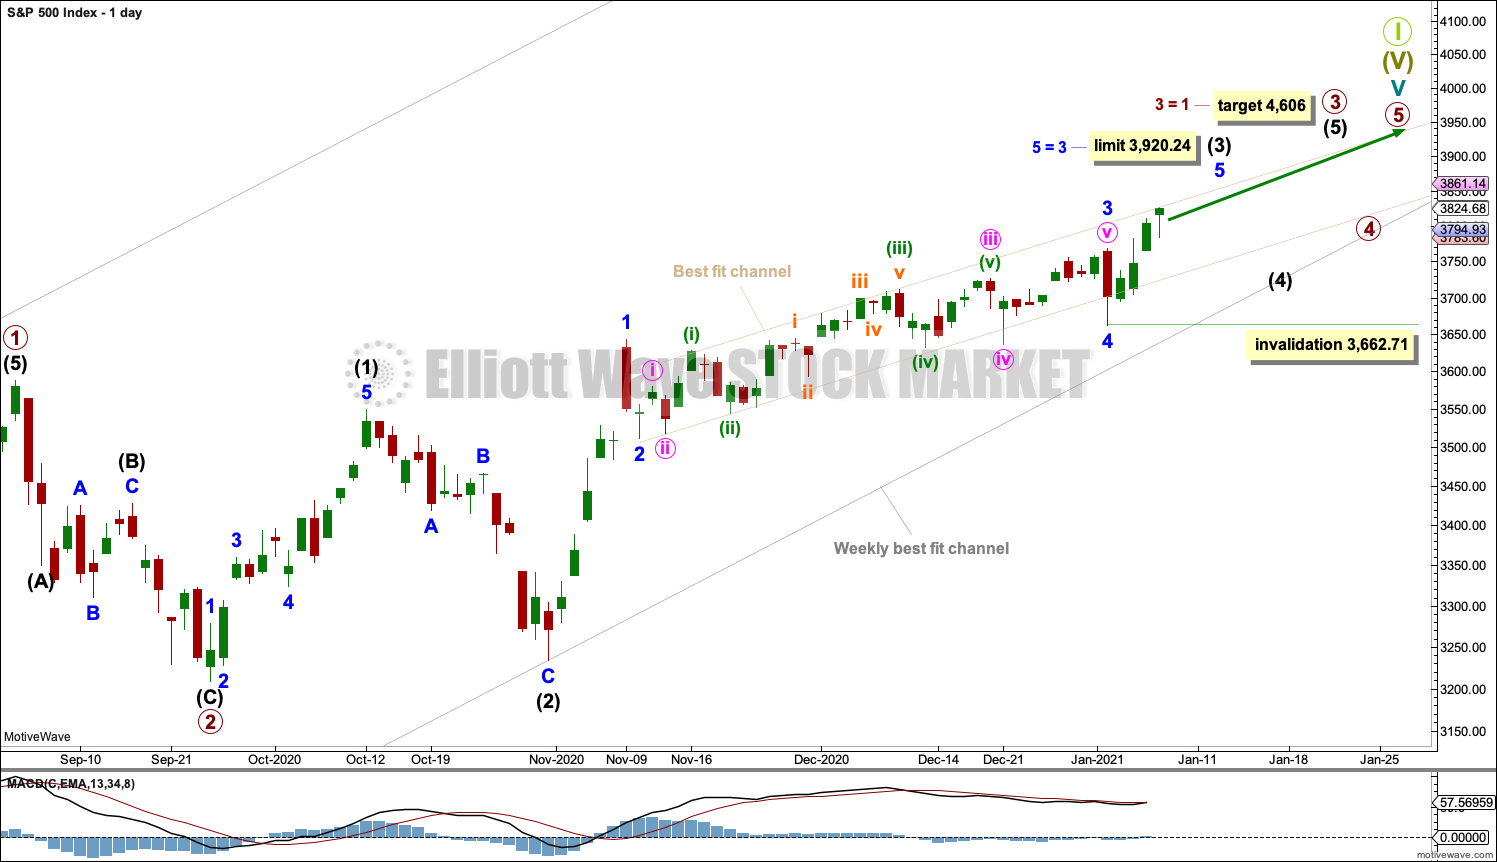
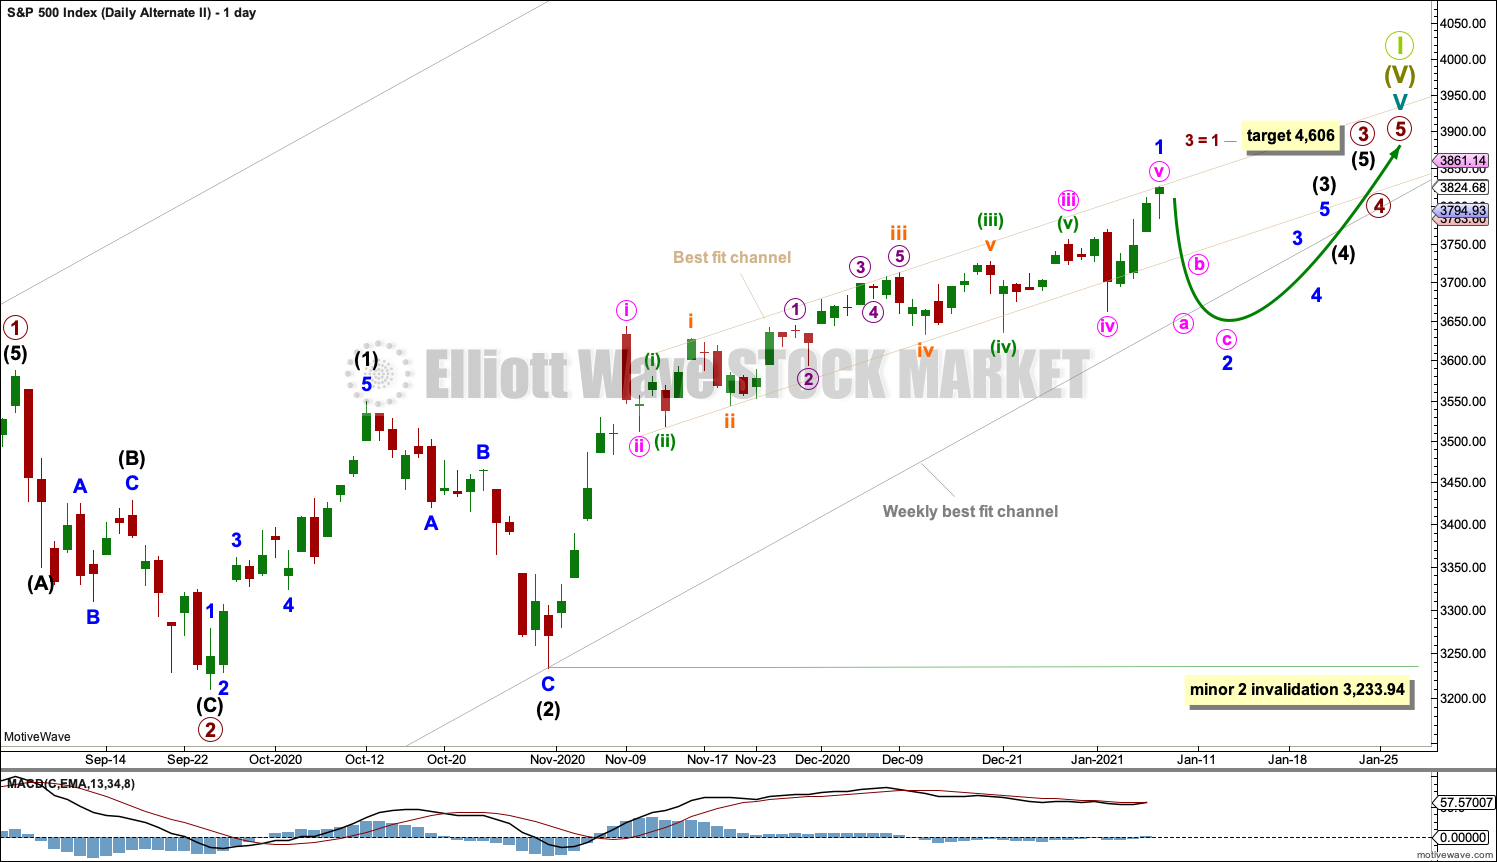
Primary waves 1 and 2 may both be complete. Primary wave 3 may be underway.
Primary wave 3 may only subdivide as an impulse. Within primary wave 3: Intermediate waves (1) and (2) may be complete, and intermediate wave (3) may be an incomplete impulse.
Minor waves 1 through to 4 within intermediate wave (3) may be complete. No second wave correction within minor wave 5 may move beyond its start below 3,662.71.
If minor wave 3 is over, then it would be shorter in length than minor wave 1. Minor wave 3 is just 3.98 points shorter than 0.618 the length of minor wave 1. Because minor wave 3 may not be the shortest actionary wave within intermediate wave (3), minor wave 5 is limited to no longer than equality in length with minor wave 3.
Primary wave 1 looks extended. The target for primary wave 3 expects it to also be extended.
HOURLY CHART
Click chart to enlarge.
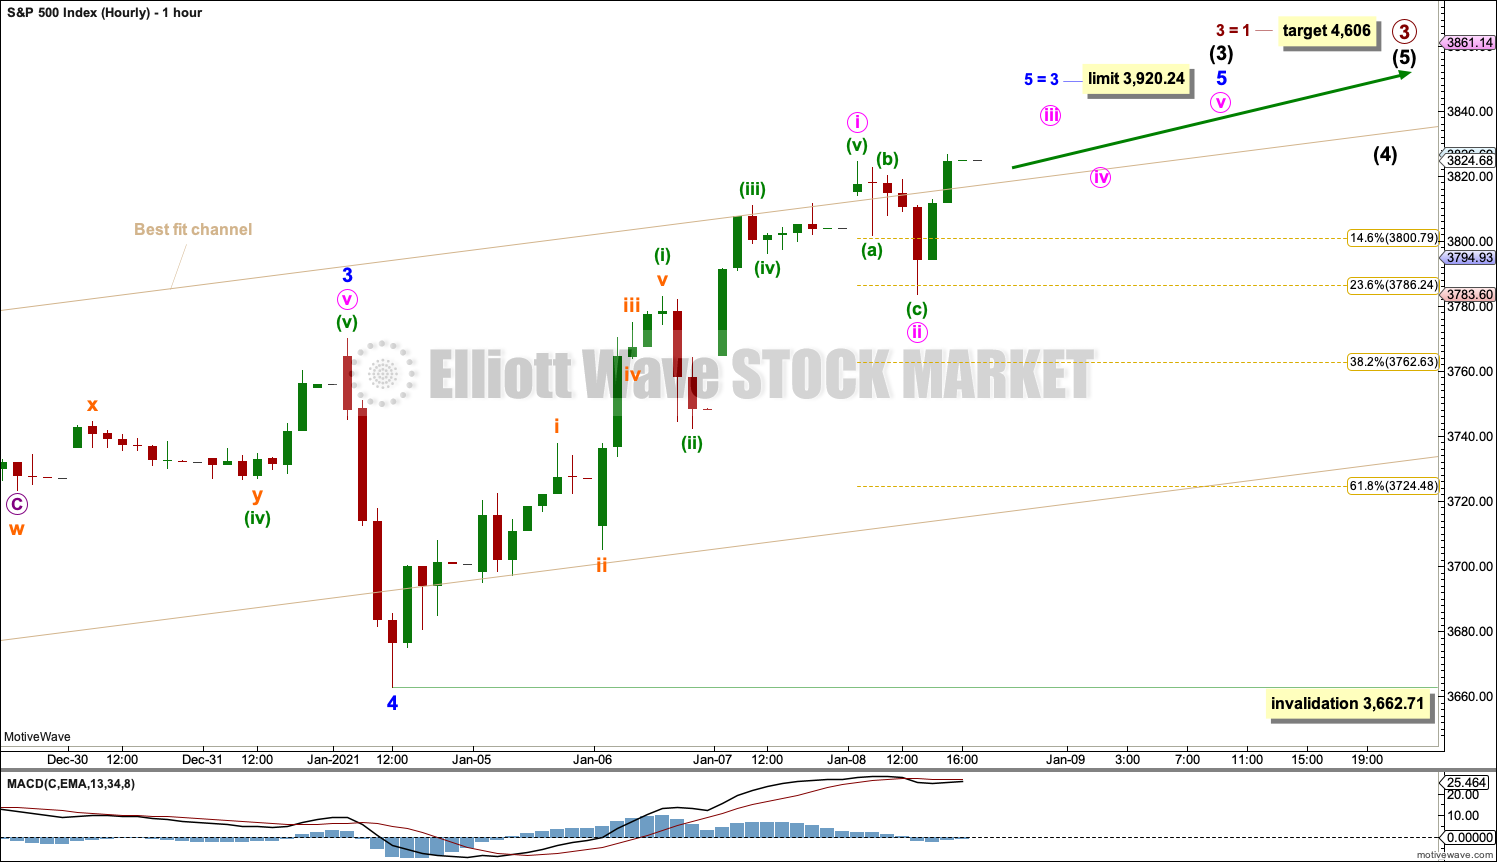
Minor wave 4 may be over as a quick sharp zigzag. Minor wave 5 may have begun.
Minute waves i and ii within minor wave 5 may be complete. If it continues lower as an expanded flat, then minute wave ii may not move beyond the start of minute wave i below 3,662.71.
FIRST ALTERNATE WAVE COUNT
DAILY CHART
Click chart to enlarge.
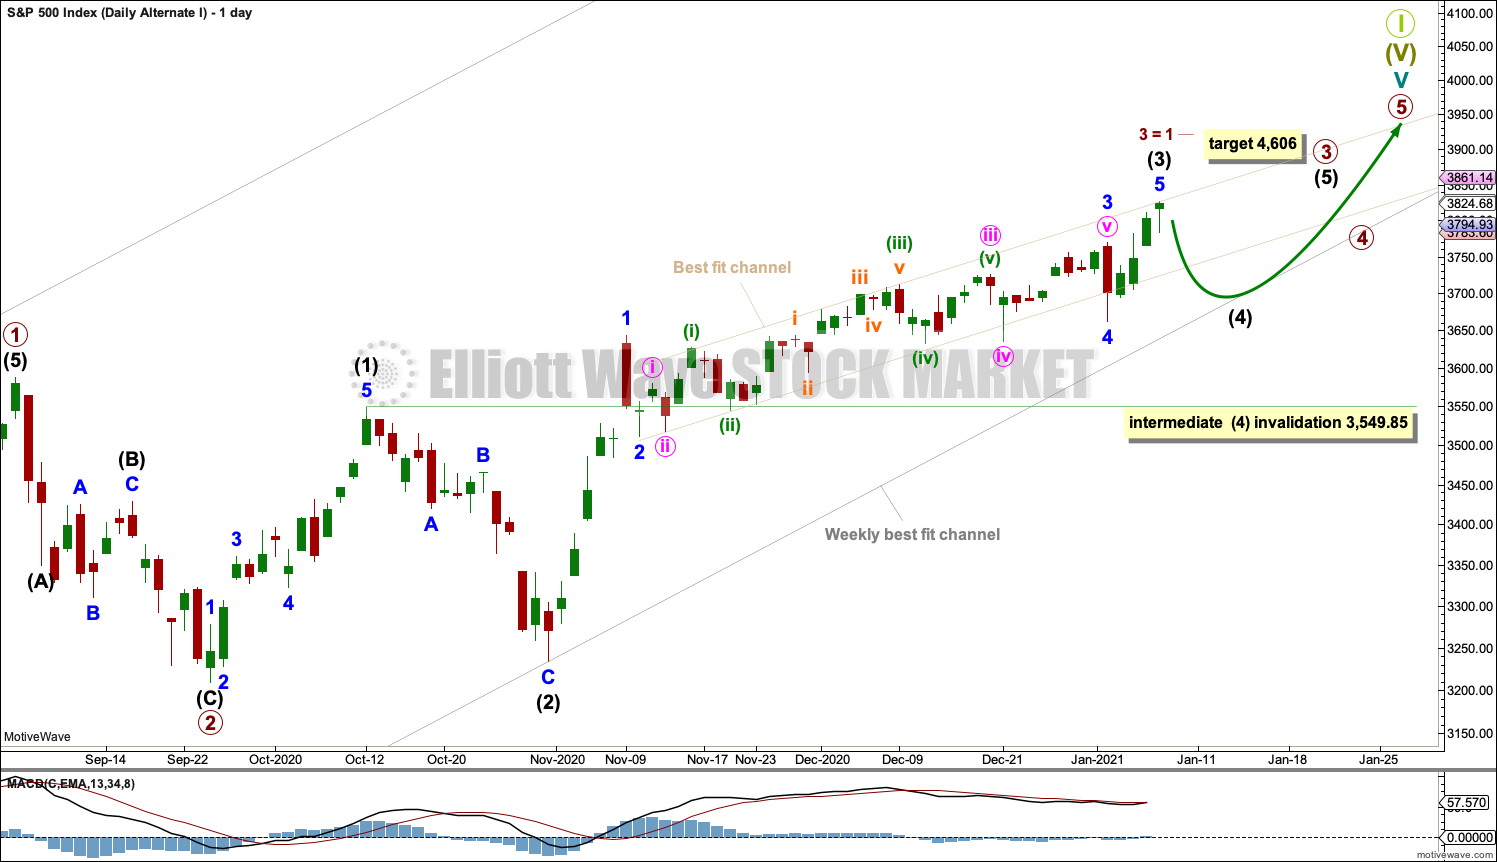
It is also possible that intermediate wave (3) is complete and intermediate wave (4) may move lower. Intermediate wave (4) may find support about the lower edge of the weekly best fit channel.
Intermediate wave (2) was a very deep zigzag lasting 14 sessions. Intermediate wave (4) may also be a zigzag as these are by a wide margin the most common Elliott wave corrective structure, but it may also subdivide as a flat, combination or triangle.
Intermediate wave (4) may not move into intermediate wave (1) price territory below 3,549.85.
HOURLY CHART
Click chart to enlarge.
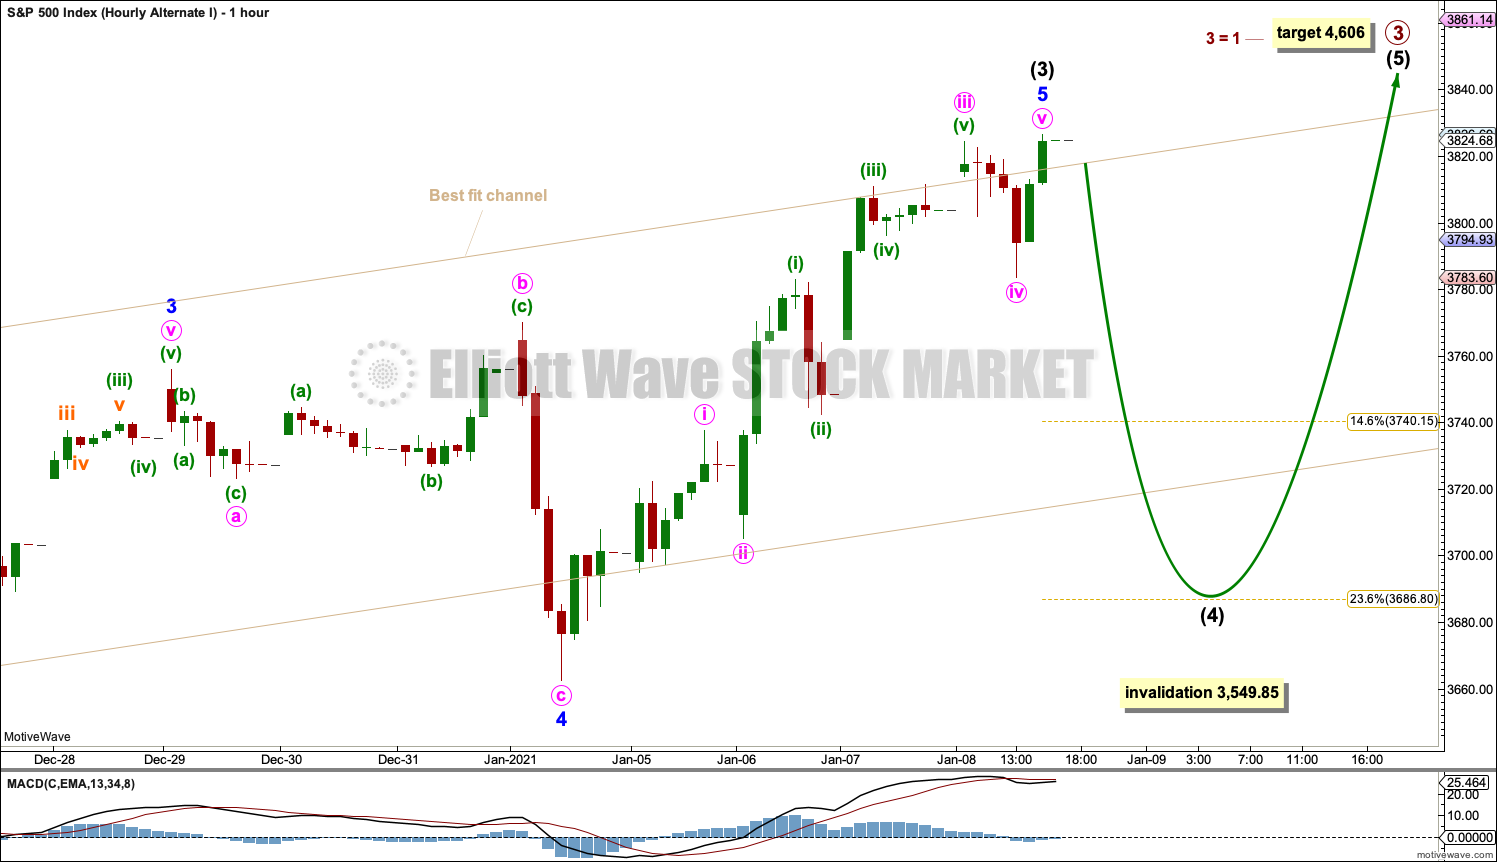
Intermediate wave (4) may begin at today’s high. Intermediate wave (4) may subdivide as any Elliott wave corrective structure. To exhibit alternation with the zigzag of intermediate wave (2), intermediate wave (4) may subdivide as a flat, combination or triangle.
Intermediate wave (4) end close to the 0.236 or 0.382 Fibonacci ratios of intermediate wave (3), with the more shallow 0.236 Fibonacci ratio favoured as a target.
SECOND ALTERNATE WAVE COUNT
DAILY CHART
Click chart to enlarge.
This second alternate wave count is the same as the first alternate wave count, except the degree of labelling within intermediate wave (3) is moved down one degree. It is possible that only minor wave 1 may be over at the last high.
Minor wave 2 may continue lower as a deeper pullback to last several days. Minor wave 2 may not move beyond the start of minor wave 1 below 3,233.94.
HOURLY CHART
Click chart to enlarge.
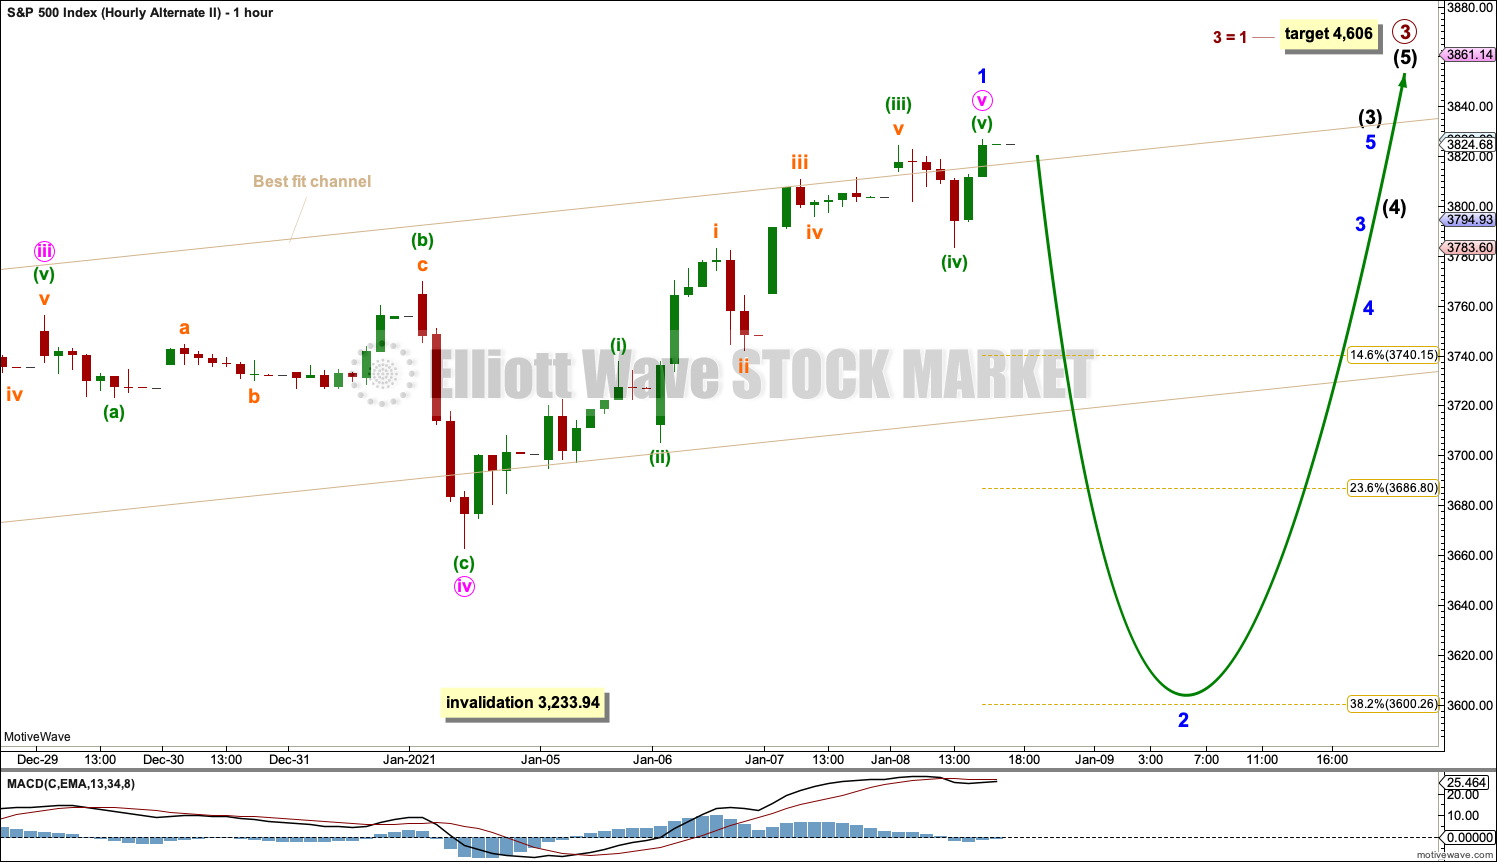
Minor wave 2 may begin at today’s high.
Minor wave 2 may be most likely to subdivide as a zigzag. It may end about the 0.382 or 0.618 Fibonacci ratios of minor wave 1, with the 0.382 Fibonacci ratio at 3,600.26 more likely,
Minor wave 2 may last about 2 to 3 weeks in total. Minor wave 2 may not move beyond the start of minor wave 1 below 3,233.94.
THIRD ALTERNATE WAVE COUNT
DAILY CHART
Click chart to enlarge.
In the interest of always trying to consider all possibilities this alternate is considered.
This alternate wave count does not have support from classic technical analysis at this time, so it is judged to have a low probability. However, low probability does not mean no probability. Confidence / invalidation points may be used to judge any change in probability between the wave counts.
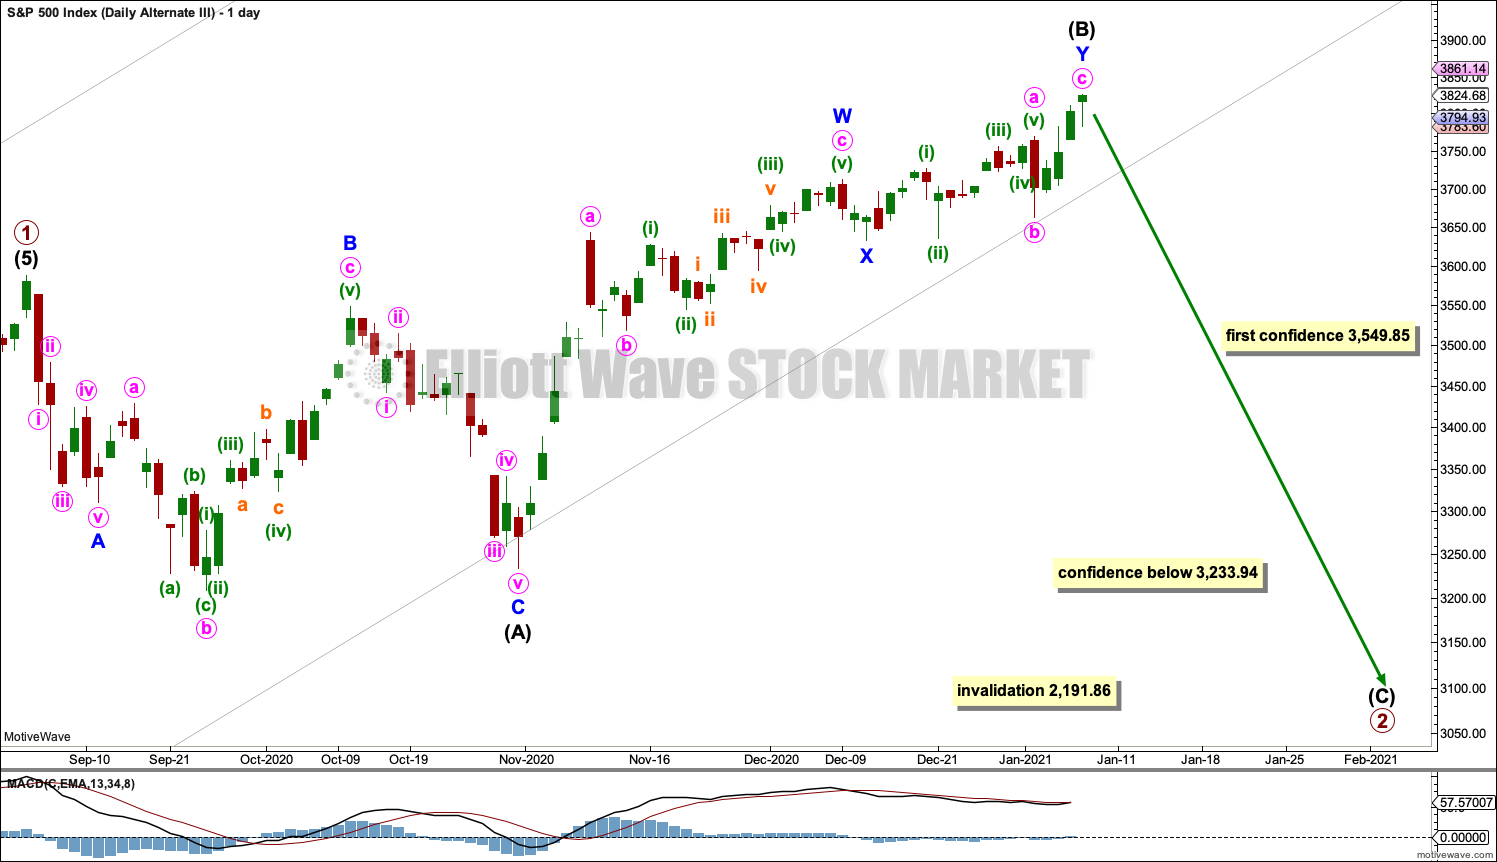
It is possible that primary wave 2 may be an incomplete expanded flat correction.
Intermediate wave (B) may have continued higher as a double zigzag. Intermediate wave (B) is now 1.67 times the length of intermediate wave (A), which is beyond the common range of up to 1.38. The probability of this wave count declines as price continues higher.
There is no rule for flat corrections that state a limit for B waves, so it is possible that intermediate wave (B) may extend higher. If intermediate wave (B) were to reach twice the length of intermediate wave (A) at 3,942.28, then the idea of a flat correction should be discarded based upon a very low probability.
ALTERNATE WEEKLY CHART
Click chart to enlarge.
This wave count is the same as the first weekly chart with the exception of the degree of labelling within cycle wave V.
If the degree of labelling within cycle wave V is moved down one degree, then only primary wave 1 may be currently unfolding. When primary wave 1 may be complete, then a multi-week pullback or consolidation may begin for primary wave 2. Primary wave 2 may not move beyond the start of primary wave 1 below 2,191.86.
This wave count is more bullish than the main weekly chart. It expects that cycle wave V may be in an earlier stage and may yet last many more years than the main weekly chart expects it to. These two weekly wave counts are of an even probability.
TECHNICAL ANALYSIS
WEEKLY CHART
Click chart to enlarge. Chart courtesy of StockCharts.com.
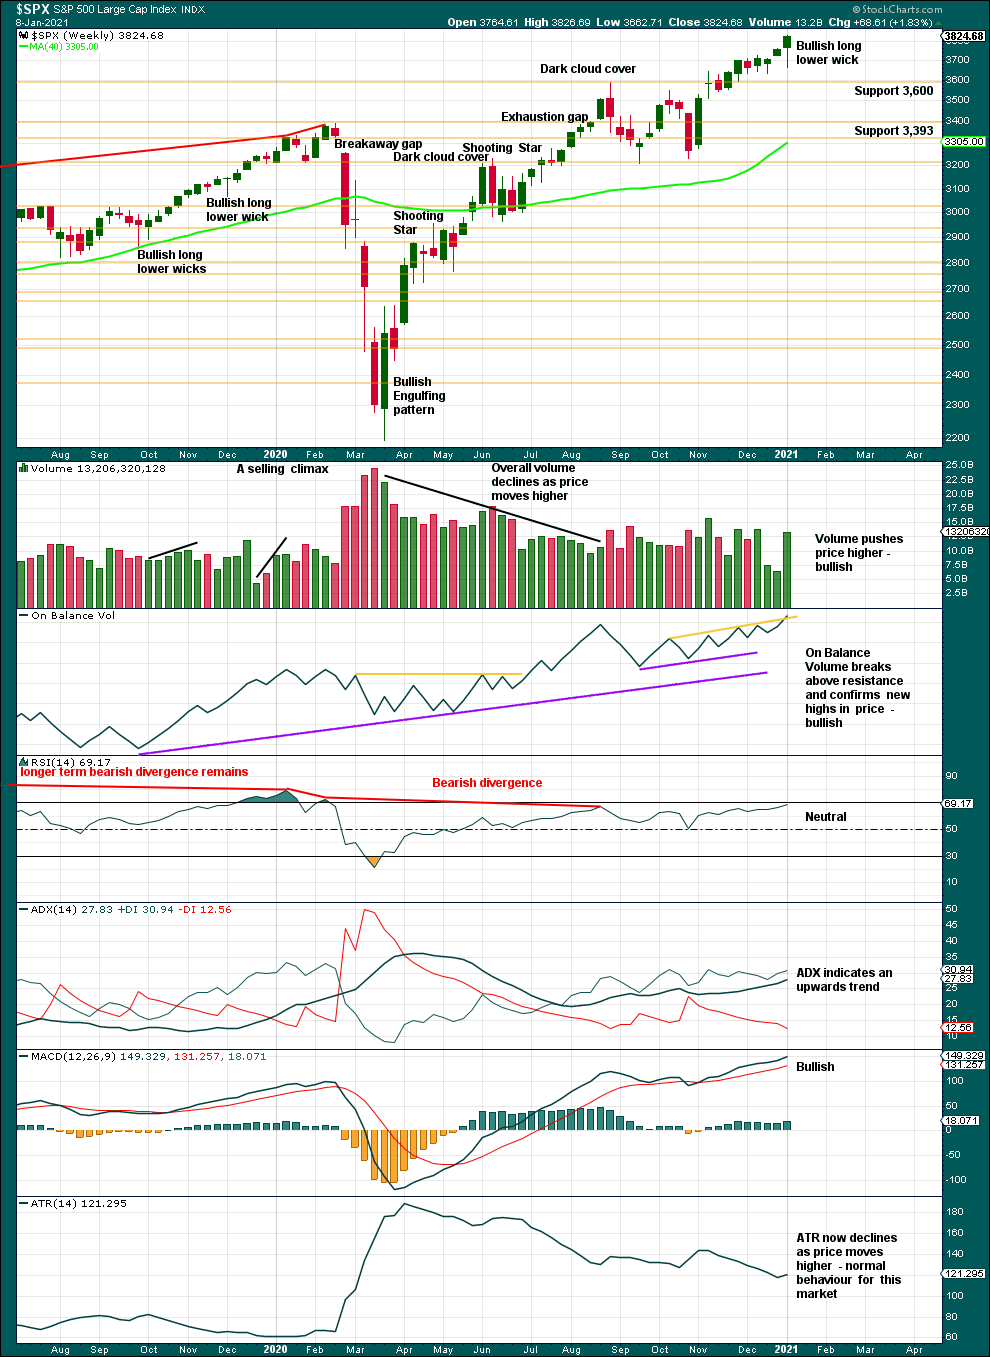
This chart is bullish and still supports the main Elliott wave count. All of volume, ADX and MACD are bullish. There is no bearish candlestick reversal pattern. Conditions are not extreme. There is room for this upwards trend to continue.
This week volume and a bullish lower wick suggest more upwards movement next week. This weekly candlestick is not a Hanging Man because the lower wick is less than twice the length of the real body.
DAILY CHART
Click chart to enlarge. Chart courtesy of StockCharts.com.
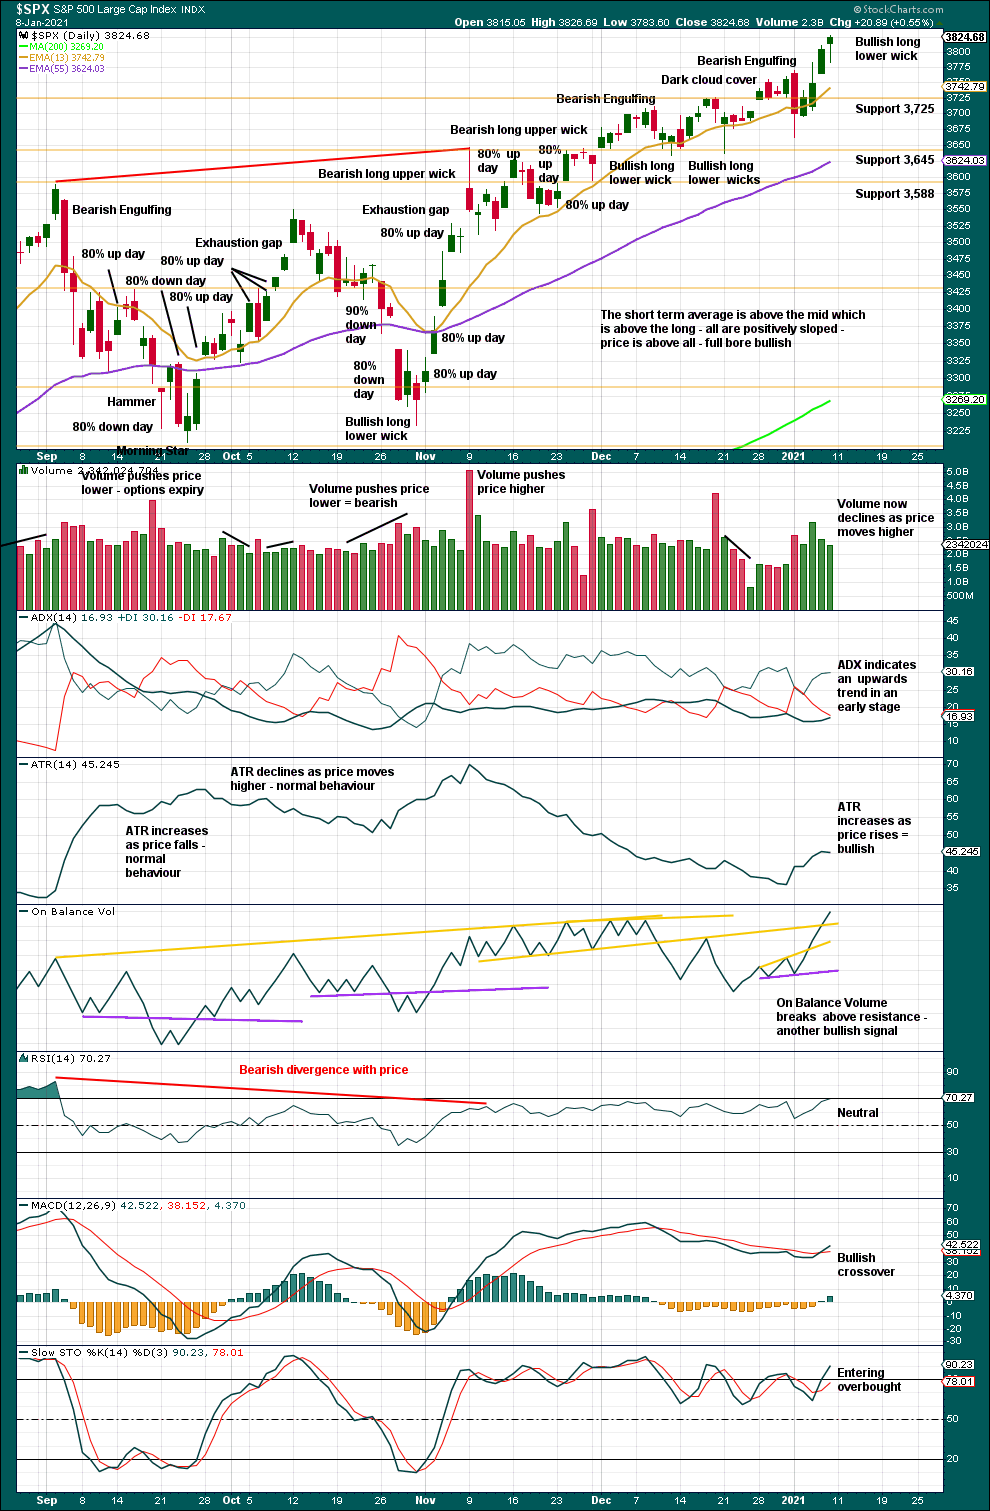
So far the last swing low at 3,636.48 of the 21st of December remains intact. While this has not been breached, a series of higher highs and higher lows off the low of the 30th of October remains. If the last swing low is breached, then it would be possible that a trend change for the mid term has occurred.
Overall, this chart is fairly bullish and supports the main Elliott wave count (or the weekly alternate, which is more bullish).
Friday’s candlestick may be a Hanging Man, which is a bearish reversal pattern. However, the bullish implication of the long lower wick on a Hanging Man mean it requires confirmation by a red daily candlestick immediately following, making a Hanging Man essentially a two candlestick reversal pattern. While the Hanging Man has not yet been followed by a red candlestick, it will be read as bullish.
BREADTH – AD LINE
WEEKLY CHART
Click chart to enlarge. Chart courtesy of StockCharts.com. So that colour blind members are included, bearish signals will be noted with blue and bullish signals with yellow.
Breadth should be read as a leading indicator.
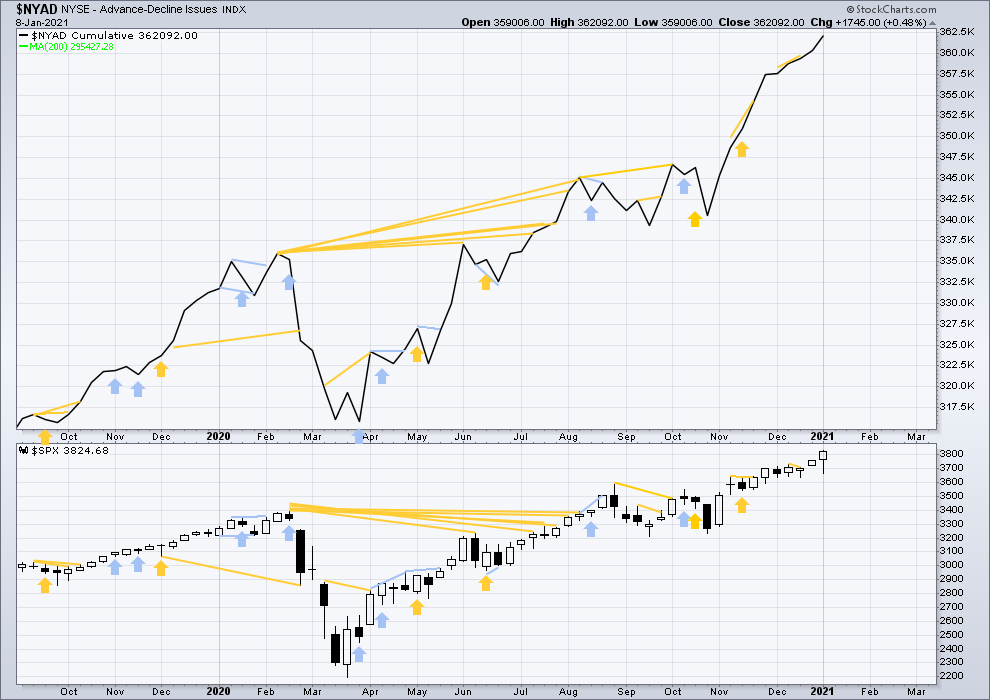
Lowry’s Operating Companies Only AD line has made a new all time high on the 7th of January. This is a strong bullish signal and supports the main Elliott wave count.
Large caps all time high: 3,826.69 on January 8, 2021.
Mid caps all time high: 2,434.16 on January 8, 2021.
Small caps all time high: 1,206.07 on January 8, 2021.
Small caps led very strongly today. This is bullish.
Again, this week both price and the AD line have made new all time highs. Upwards movement in price has support from rising market breadth. This is bullish.
DAILY CHART
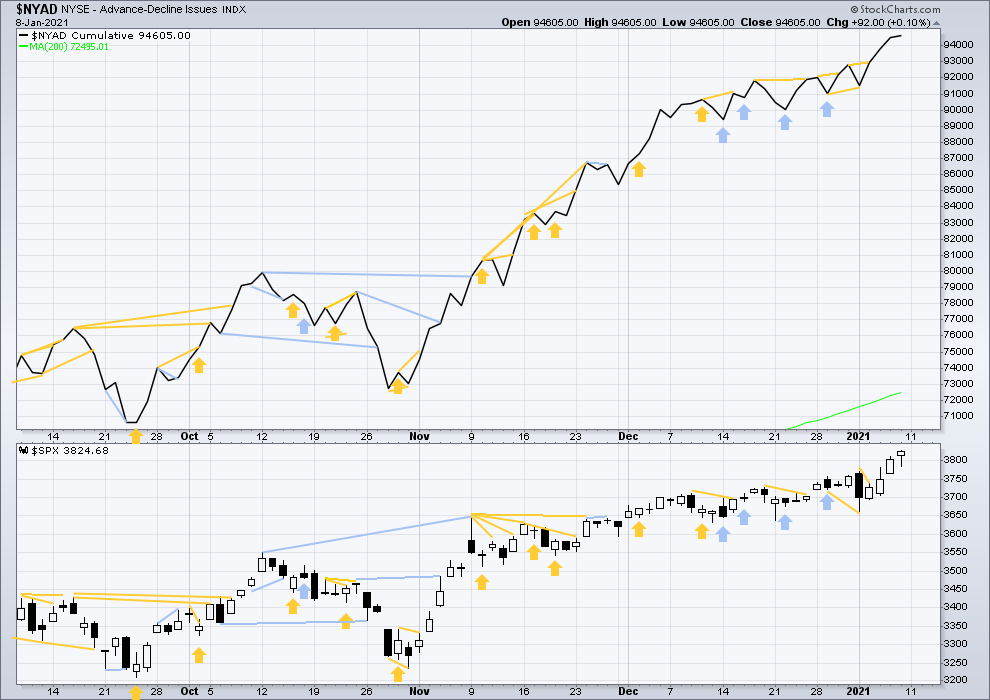
Click chart to enlarge. Chart courtesy of StockCharts.com. So that colour blind members are included, bearish signals will be noted with blue and bullish signals with yellow.
Both price and the AD line have again moved higher today to both make new all time highs. This is bullish and supports the main Elliott wave count.
VOLATILITY – INVERTED VIX CHART
WEEKLY CHART
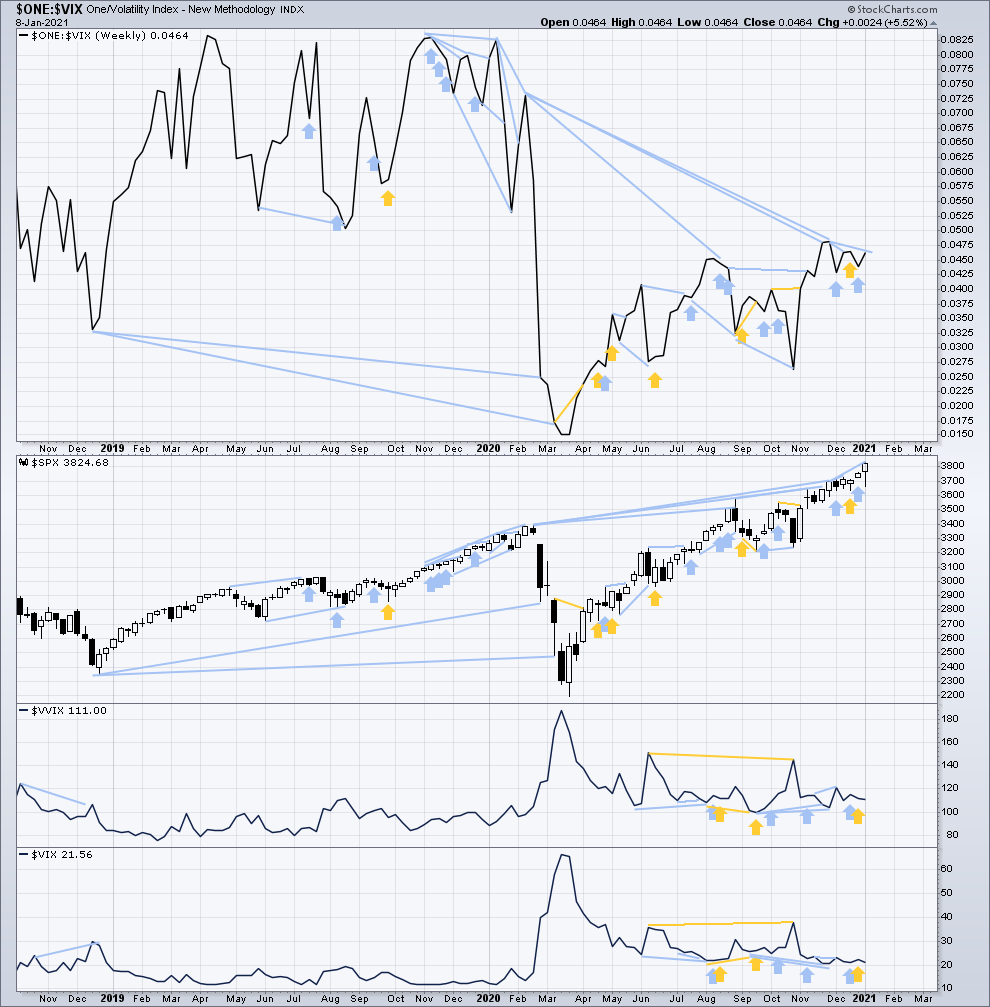
Click chart to enlarge. Chart courtesy of StockCharts.com. So that colour blind members are included, bearish signals will be noted with blue and bullish signals with yellow.
Inverted VIX remains well below all time highs. The all time high for inverted VIX was in the week beginning October 30, 2017. There is over 3 years of bearish divergence between price and inverted VIX. There is all of long, mid and short-term bearish divergence. This bearish divergence may develop further before the bull market ends. It may be a very early indicator of an upcoming bear market, but it is not proving to be useful in timing.
This week price has made new all time highs, but inverted VIX has not made a new short-term swing high. There is all of short, mid and long-term bearish divergence.
Comparing VIX and VVIX: VIX has declined, but VVIX looks close to flat. This possible divergence is too weak to be given any weight at all.
DAILY CHART
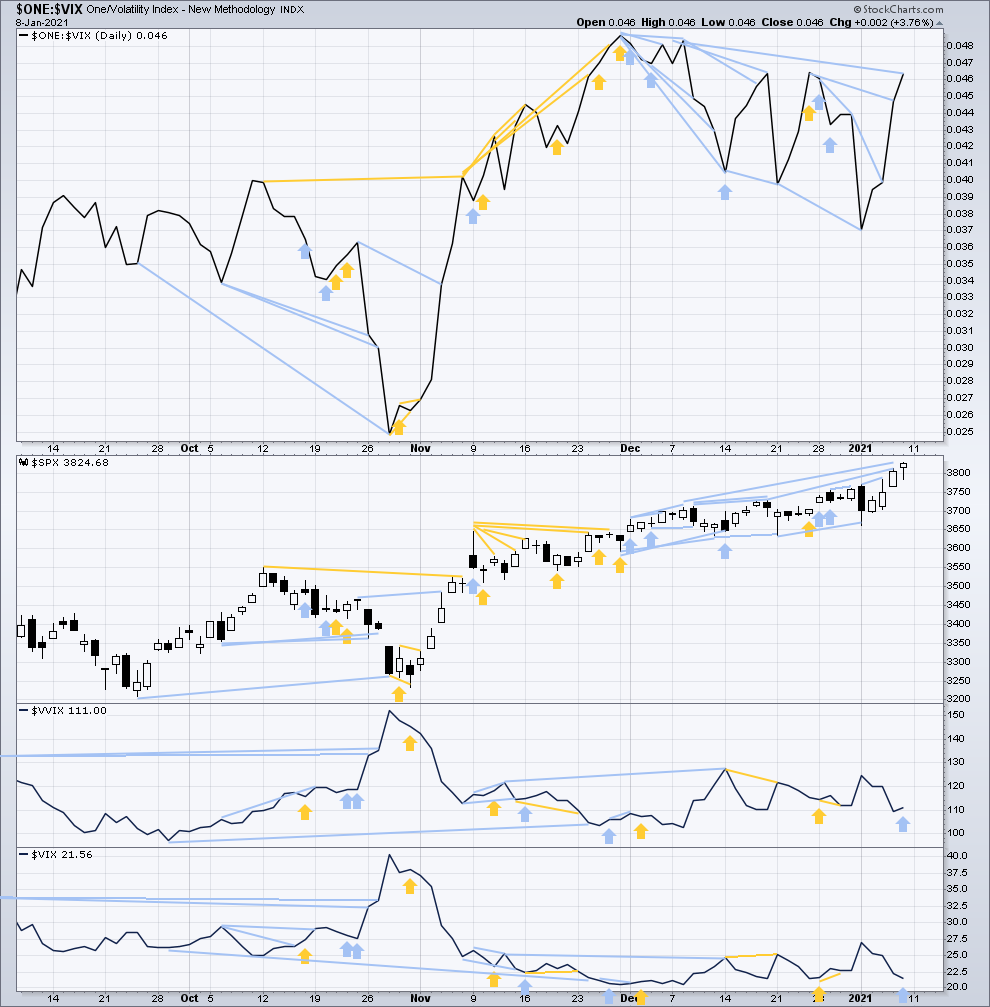
Click chart to enlarge. Chart courtesy of StockCharts.com. So that colour blind members are included, bearish signals will be noted with blue and bullish signals with yellow.
Today both price and inverted VIX have moved higher. Both have made new short-term swing highs. Prior short-term bearish divergence was not followed by any downwards movement in price, so it is considered to have failed. Price has made new all time highs, but inverted VIX has not made new mid-term highs. Mid-term divergence remains.
Comparing VIX and VVIX at the daily chart level: Today VIX has declined, but VVIX has increased. There is new short-term bearish divergence for price.
DOW THEORY
Dow Theory confirms a new bull market with new highs made on a closing basis:
DJIA: 29,568.57 – closed above on 16th November 2020.
DJT: 11,623.58 – closed above on 7th October 2020.
Adding in the S&P and Nasdaq for an extended Dow Theory, confirmation of a bull market would require new highs made on a closing basis:
S&P500: 3,393.52 – closed above on 21st August 2020.
Nasdaq: 9,838.37 – closed above on June 8, 2020.
The following major swing lows would need to be seen on a closing basis for Dow Theory to confirm a change from bull to a bear market:
DJIA: 18,213.65
DJT: 6,481.20
Adding in the S&P and Nasdaq for an extended Dow Theory, confirmation of a new bear market would require new lows on a closing basis:
S&P500: 2,191.86
Nasdaq: 6,631.42
Published @ 07:12 p.m. ET.
—
Careful risk management protects your trading account(s).
Follow my two Golden Rules:
1. Always trade with stops.
2. Risk only 1-5% of equity on any one trade.
—
New updates to this analysis are in bold.