
S&P 500: Elliott Wave and Technical Analysis | Charts – November 30, 2020
Downwards movement during the session bounced up strongly off support.
The Elliott wave count remains the same.
Summary: The wave count expects the low of the 30th of October to not be breached. A new mid-term target is at 3,785. The next target is at 4,606. The invalidation point is at 3,233.94.
The biggest picture, Grand Super Cycle analysis, is here.
Monthly charts are last updated here with video here.
ELLIOTT WAVE COUNT
WEEKLY CHART
Click chart to enlarge.
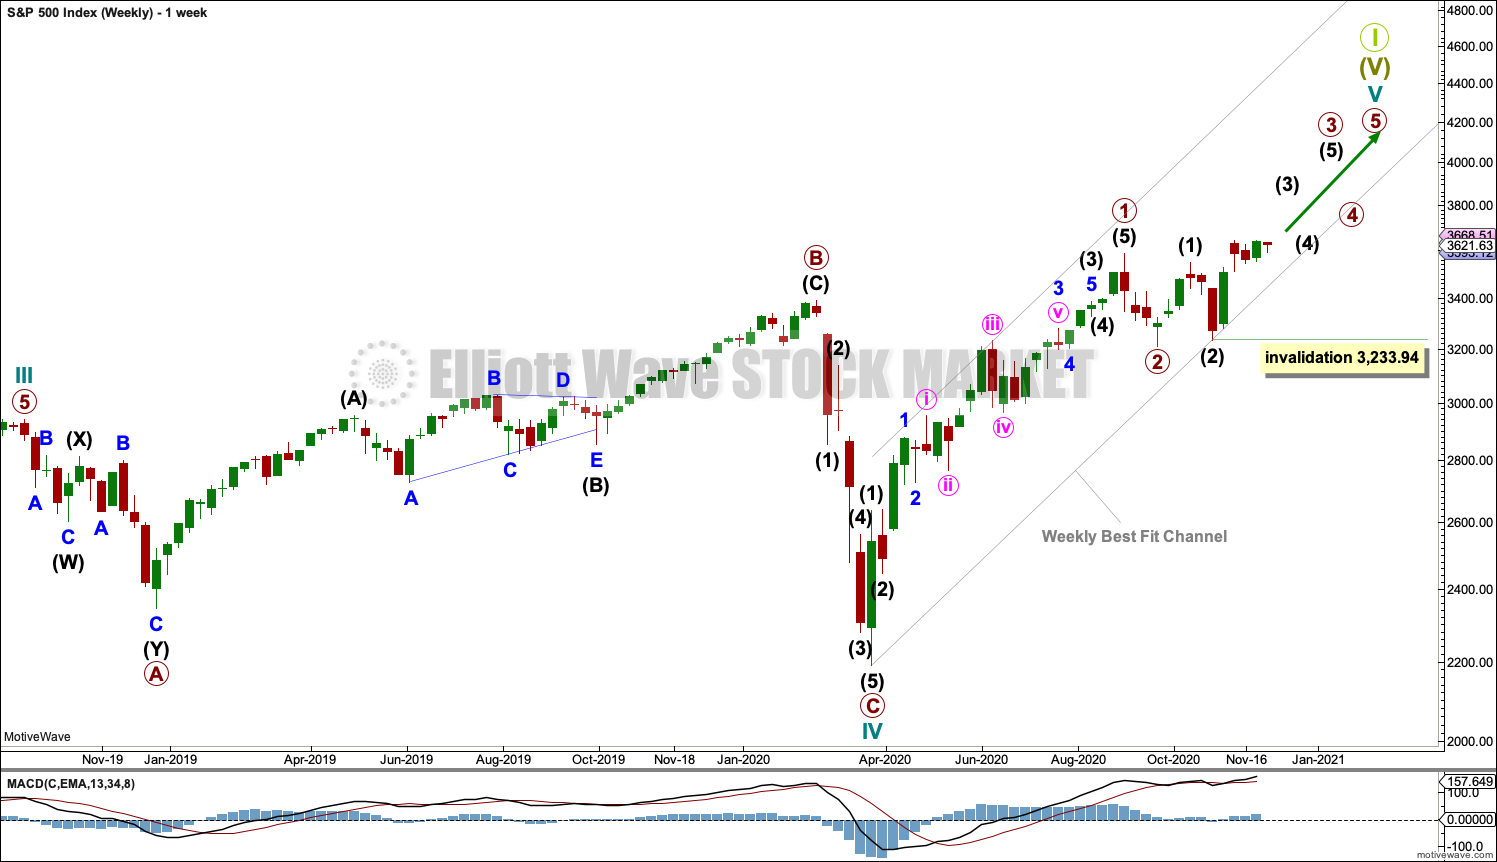
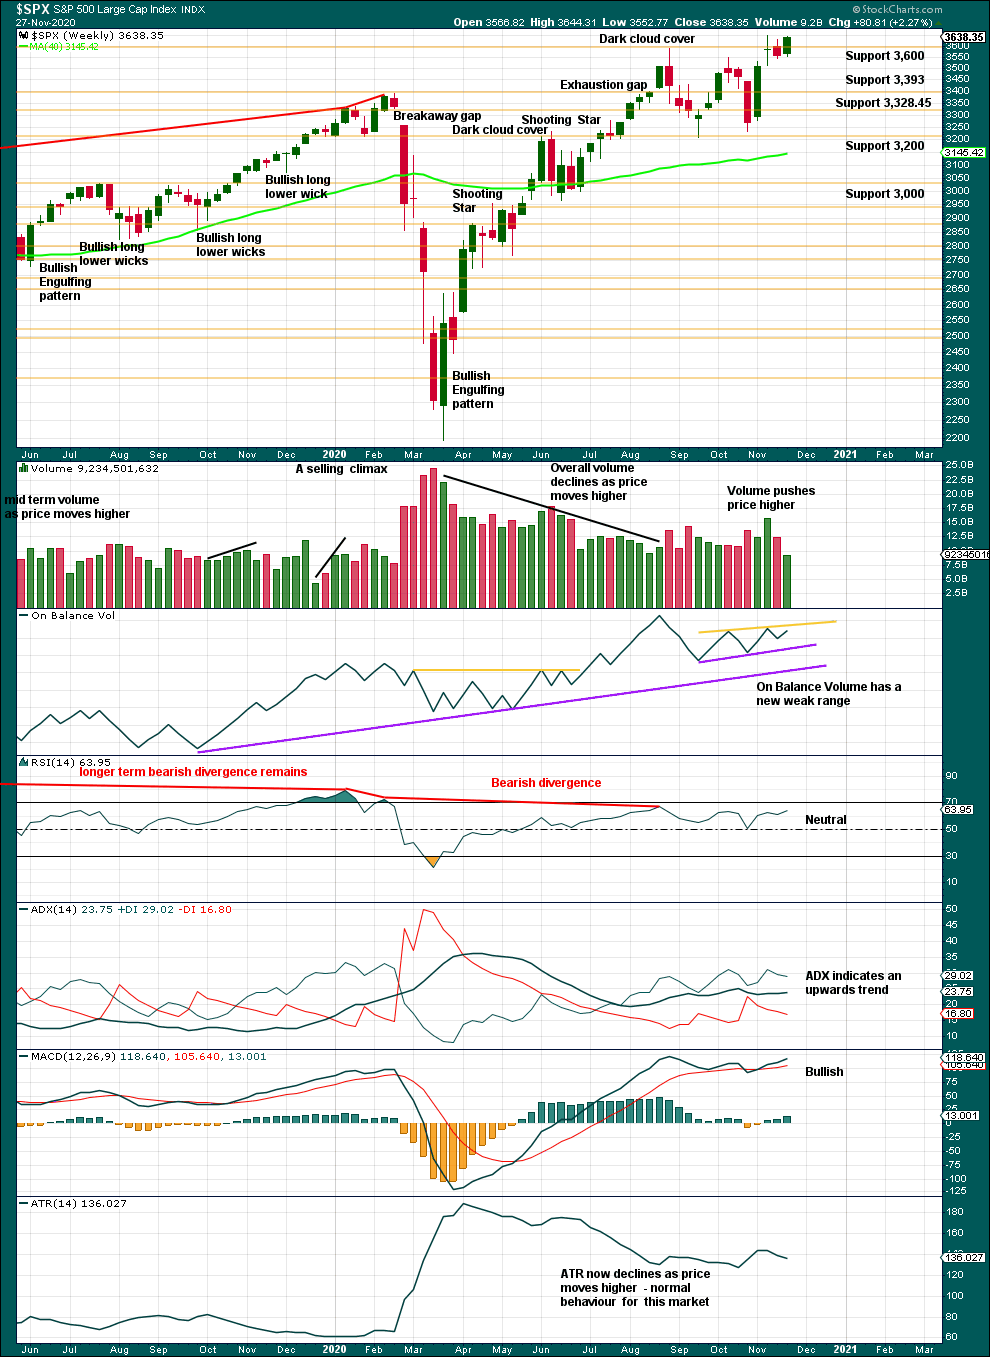
Cycle wave V may last from one to several years. So far it is in its eighth month.
This wave count may allow time for the AD line to diverge from price as price makes final highs before the end of the bull market. The AD line most commonly diverges a minimum of 4 months prior to the end of a bull market.
Cycle wave V would most likely subdivide as an impulse. But if overlapping develops, then an ending diagonal should be considered. This chart considers the more common impulse.
Primary waves 1 and 2 may be complete.
Primary wave 3 may only subdivide as an impulse.
There is already a Fibonacci ratio between cycle waves I and III within Super Cycle wave (V). The S&P500 often exhibits a Fibonacci ratio between two of its actionary waves but rarely between all three; it is less likely that cycle wave V would exhibit a Fibonacci ratio. The target for Super Cycle wave (V) to end would best be calculated at primary degree, but that cannot be done until all of primary waves 1, 2, 3 and 4 are complete.
DAILY CHART
Click chart to enlarge.
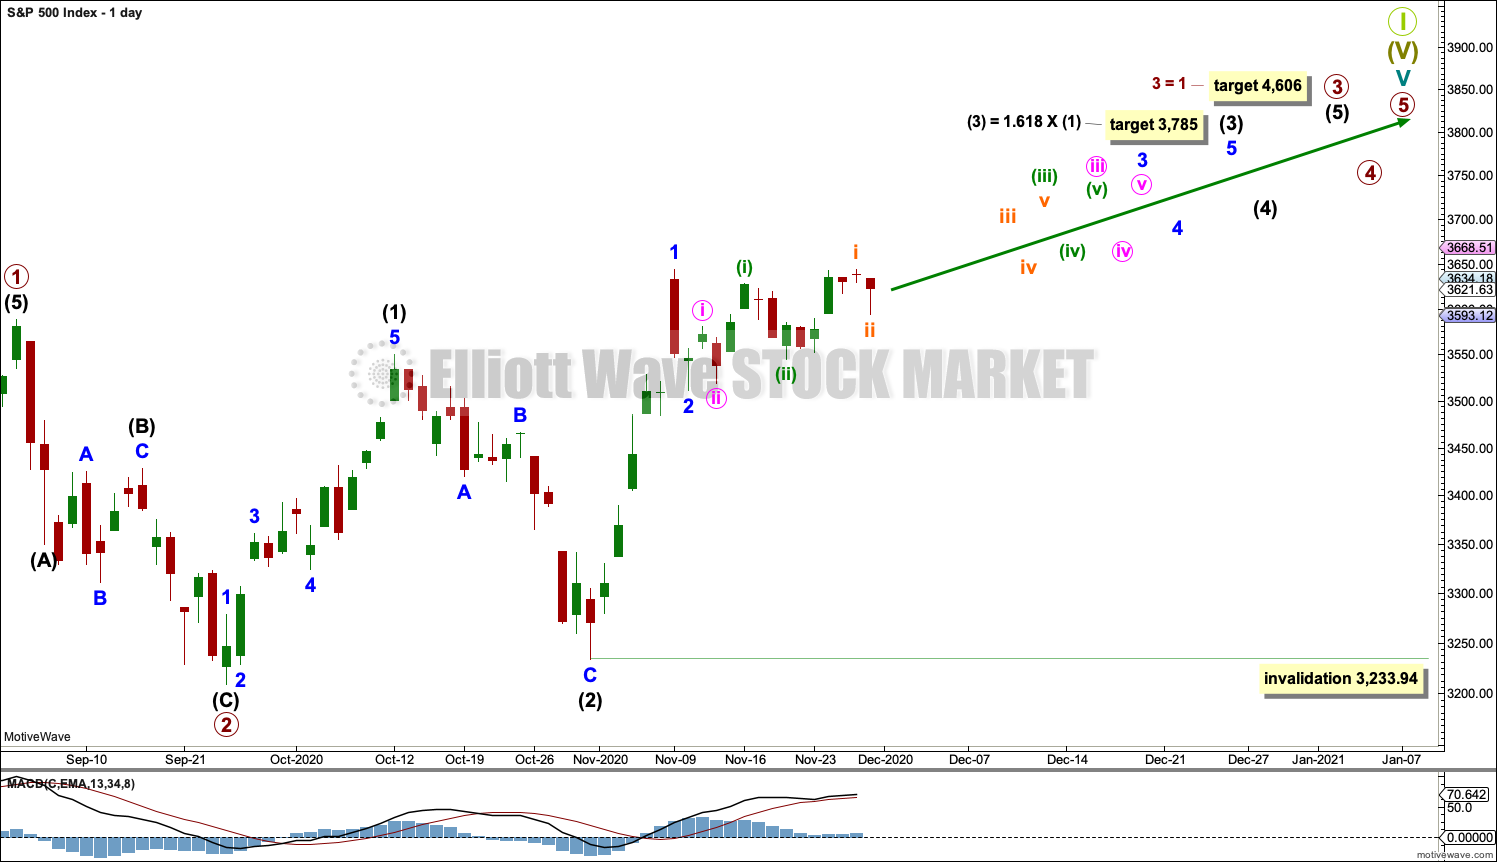
Primary waves 1 and 2 may both be complete. Primary wave 3 may now be underway.
Primary wave 3 may only subdivide as an impulse. Within primary wave 3: Intermediate waves (1) and (2) may both be complete, and intermediate wave (3) may now be underway and may only subdivide as an impulse. A target is calculated for intermediate wave (3).
No second wave correction within intermediate wave (3) may move beyond the start of its first wave below 3,233.94.
Primary wave 1 looks extended. The target for primary wave 3 expects it to also be extended.
This wave count now expects that a third wave at three large degrees (minor, intermediate and primary) has begun. An increase in upwards momentum is expected if this wave count is correct. Each third wave at minor, intermediate and primary degree must move above its corresponding first wave. Thereafter, each successive fourth wave must remain above its corresponding first wave price territory.
When third waves extend they do so in price as well as time. Extended waves usually exhibit corrections within them that are more time consuming than those within waves that are not extended.
HOURLY CHART
Click chart to enlarge.
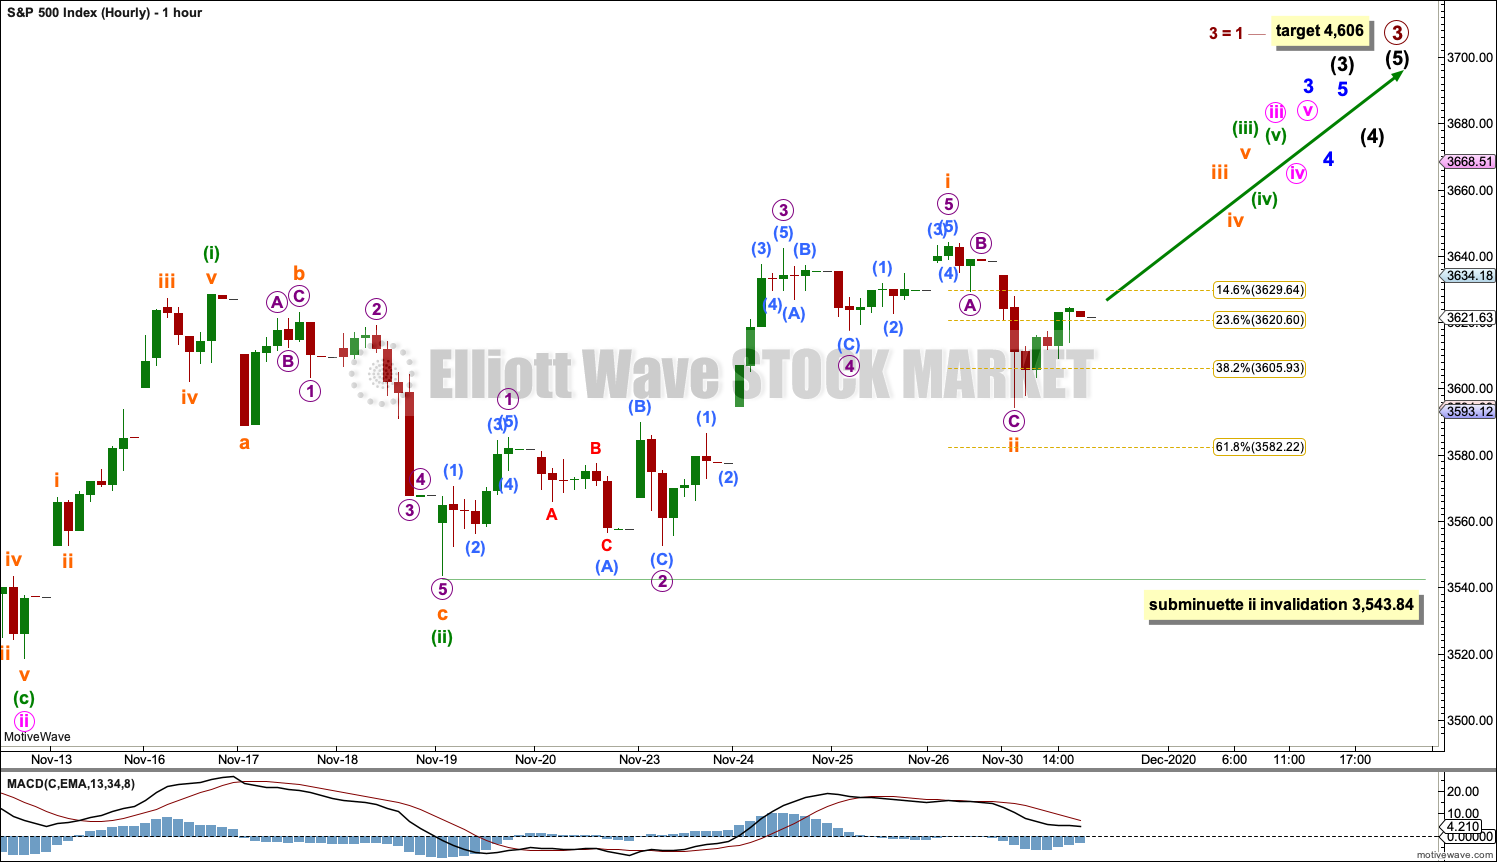
Intermediate wave (3) may only subdivide as an impulse at minor degree.
Minor waves 1 and 2 within intermediate wave (3) may be complete. This wave count expects an increase in upwards momentum.
All third waves of intermediate, minor, minute, minuette and subminuette may only subdivide as impulses.
Subminuette wave i may be complete.
Subminuette wave ii within minuette wave (iii) may not move beyond the start of subminuette wave i below 3,543.84. Subminuette wave ii may have completed today as a quick zigzag.
A new low below 3,543.84 would see this main hourly chart invalidated in favour of the alternate below.
ALTERNATE HOURLY CHART
Click chart to enlarge.
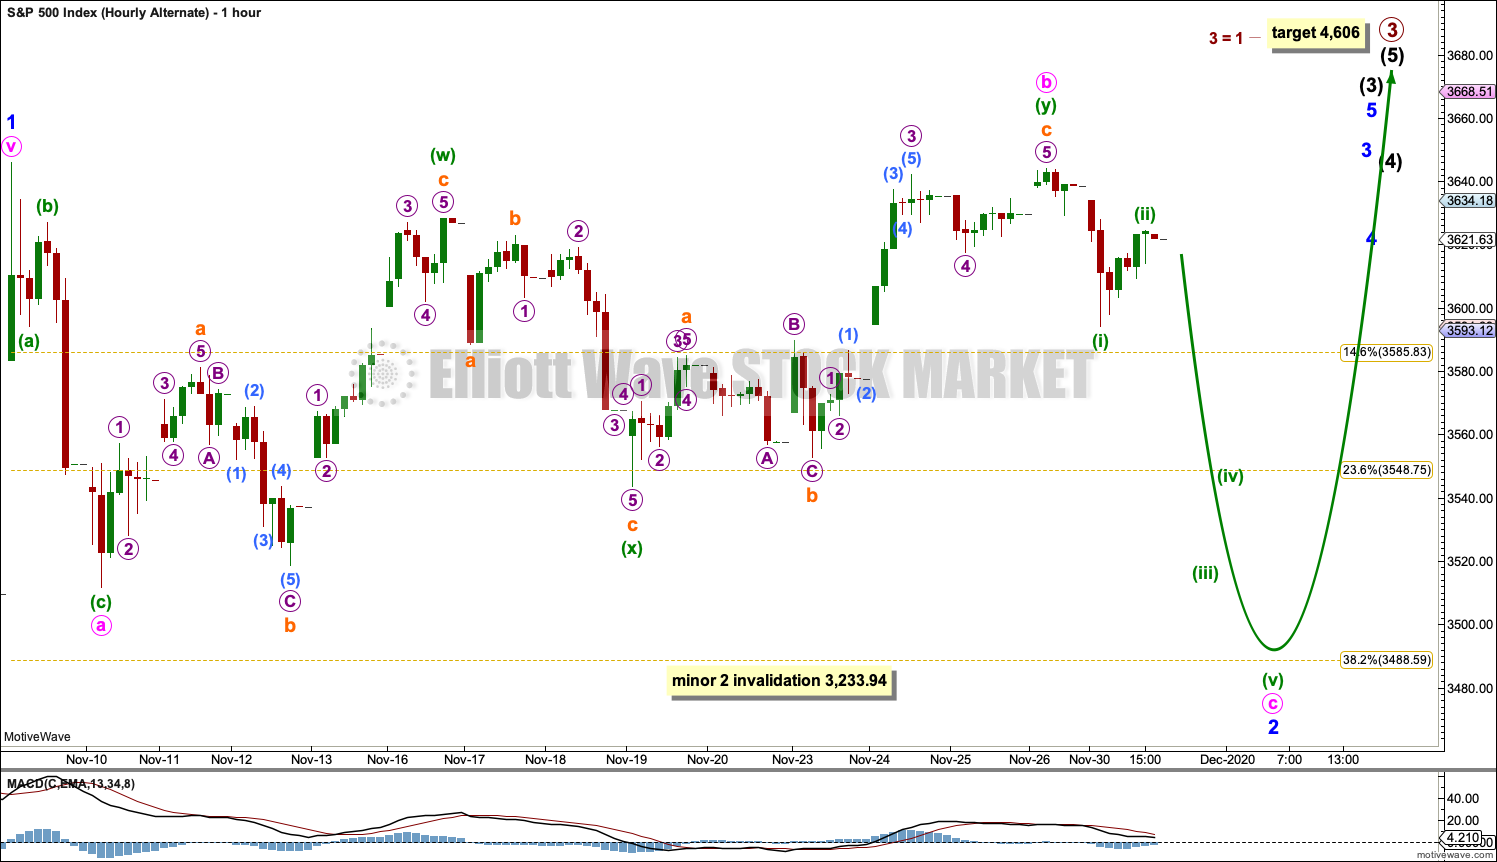
It is also possible that minor wave 2 may be an incomplete flat correction. Minute wave b within minor wave 2 may be a complete double zigzag, which may be a 0.99 length of minute wave a. If minute wave b is over here, then minor wave 2 may be a regular flat correction.
Minute wave c may unfold lower to make at least a slight new low below the end of minute wave a at 3,511.91 to avoid a truncation. Minute wave c may bring minor wave 2 to end closer to the 0.382 Fibonacci ratio of minor wave 1 at 3,488.59.
Minor wave 2 may not move below the start of minor wave 1 at 3,233.94.
TECHNICAL ANALYSIS
WEEKLY CHART
Click chart to enlarge. Chart courtesy of StockCharts.com.
This chart is bullish and supports the Elliott wave count. All of volume, On Balance Volume, ADX and MACD are bullish. There is no bearish candlestick reversal pattern. Conditions are not extreme. There is room for this upwards trend to continue.
DAILY CHART
Click chart to enlarge. Chart courtesy of StockCharts.com.
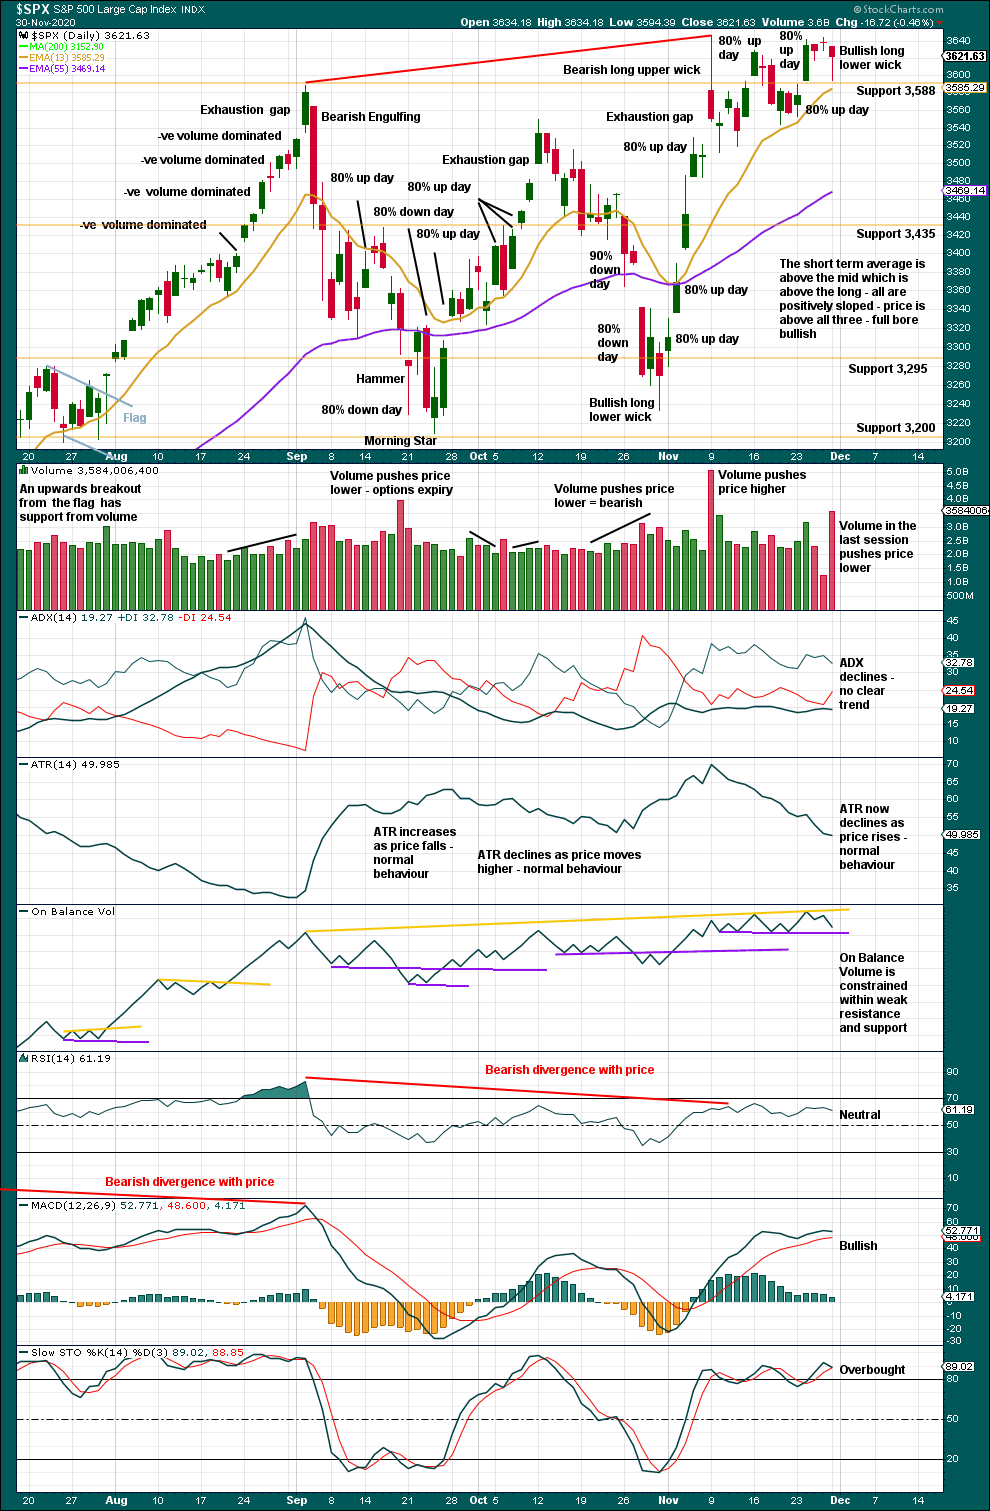
There is an upwards trend (although with today’s downwards day ADX no longer indicates an upwards trend). When this market trends, then Stochastics may remain overbought for extended periods of time while price moves a considerable distance.
Overall, this chart is bullish and still supports the Elliott wave count. There is a series of higher highs and lower lows from the low on the 24th of September.
Neither ADX nor RSI are yet extreme. There is room for this upwards trend to continue.
The long lower wick on today’s candlestick and the bounce up off support at 3,588 suggest upwards movement tomorrow, but strong volume pushing price lower today contradicts this.
BREADTH – AD LINE
WEEKLY CHART
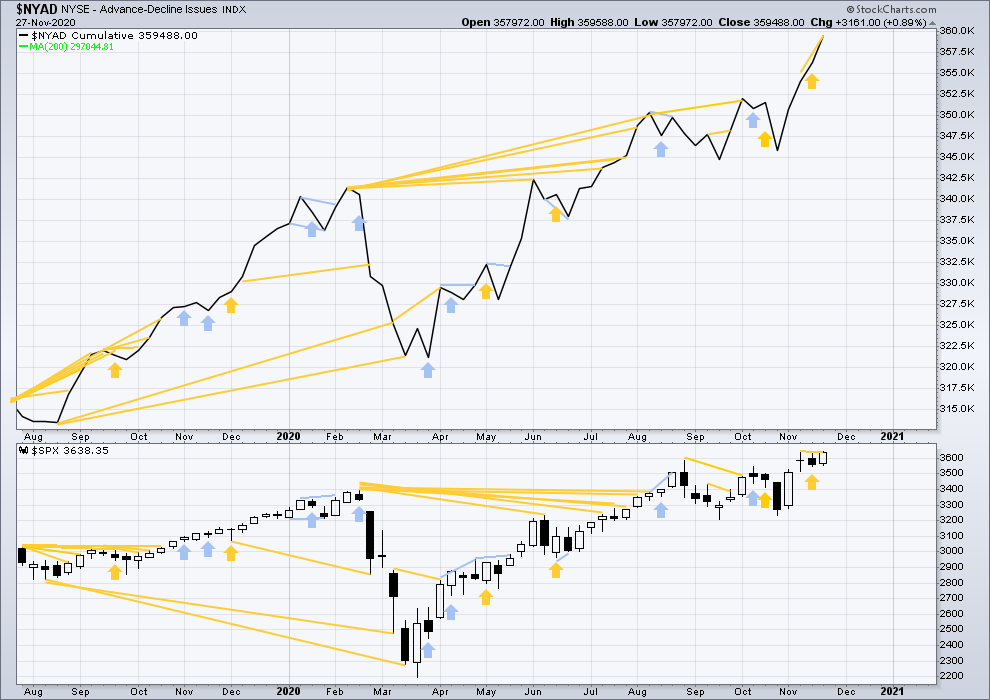
Click chart to enlarge. Chart courtesy of StockCharts.com. So that colour blind members are included, bearish signals will be noted with blue and bullish signals with yellow.
Breadth should be read as a leading indicator.
Lowry’s Operating Companies Only AD line has made a new all time high on the 24th of November. This is a strong bullish signal and supports the main Elliott wave count.
Large caps all time high: 3,645.99 on November 9, 2020.
Mid caps all time high: 2,223.52 on November 24, 2020.
Small caps all time high: 1,100.58 on August 27, 2018.
It is now mid and small cap stocks that are leading the current rise in the last two weeks. This is a feature of an early phase of a new bull market, so it is a very bullish signal.
Last week the AD line has made a new all time high, but price has not. This divergence is a strong bullish signal that supports the Elliott wave count.
DAILY CHART
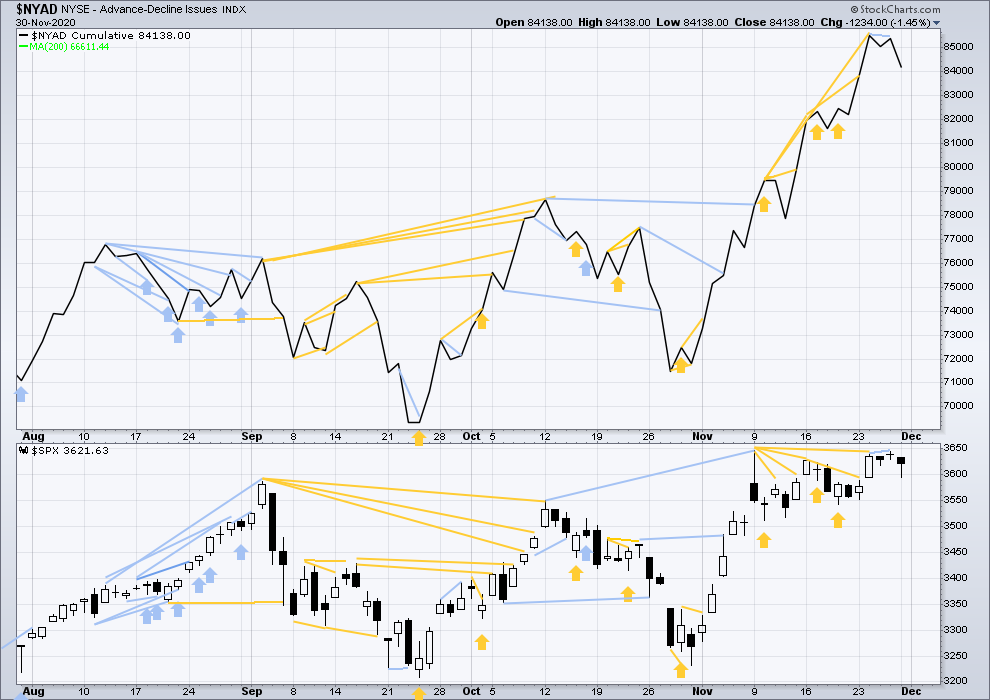
Click chart to enlarge. Chart courtesy of StockCharts.com. So that colour blind members are included, bearish signals will be noted with blue and bullish signals with yellow.
Both price and the AD line have moved lower today. Neither have made new short-term swing lows. There is no new divergence.
VOLATILITY – INVERTED VIX CHART
WEEKLY CHART
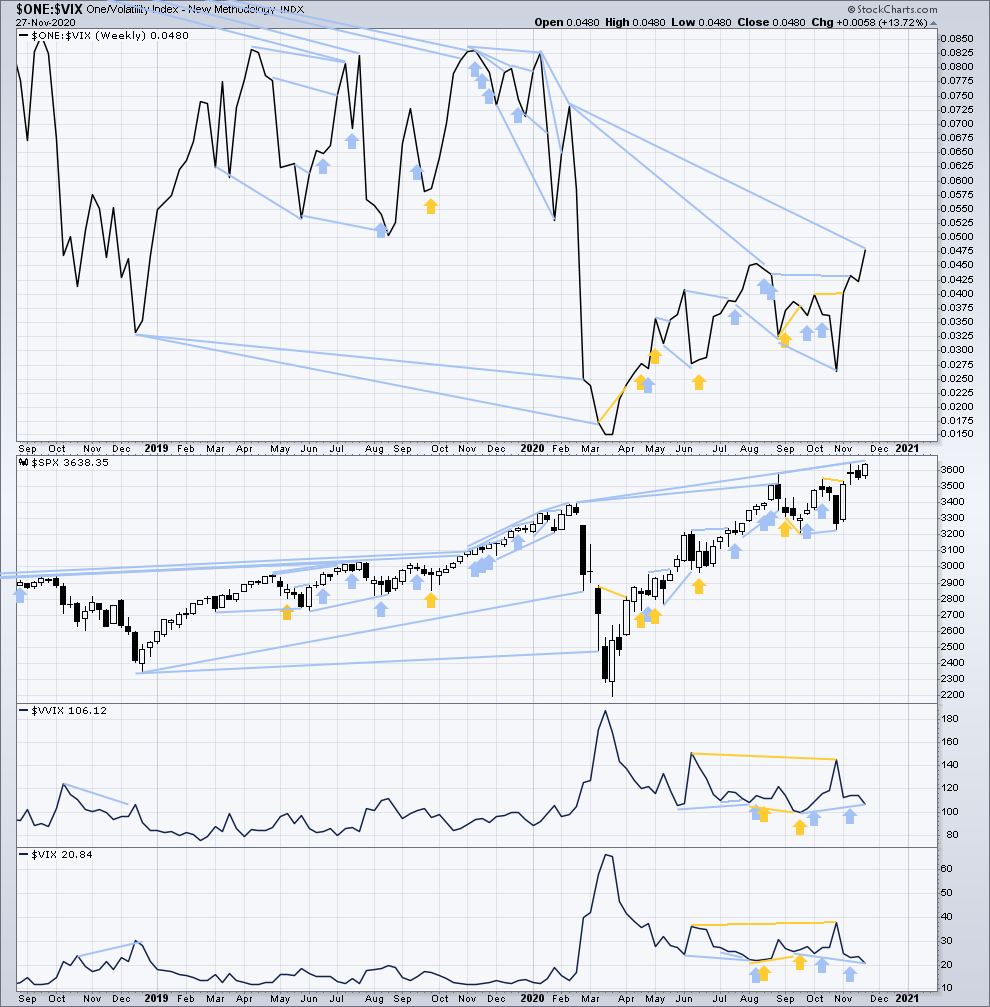
Click chart to enlarge. Chart courtesy of StockCharts.com. So that colour blind members are included, bearish signals will be noted with blue and bullish signals with yellow.
Inverted VIX remains well below all time highs. The all time high for inverted VIX was in the week beginning October 30, 2017. There is over 3 years of bearish divergence between price and inverted VIX. There is all of long, mid and short-term bearish divergence. This bearish divergence may develop further before the bull market ends. It may be a very early indicator of an upcoming bear market, but it is not proving to be useful in timing.
Last week price and inverted VIX have both moved higher. There is no new short-term divergence.
Comparing VIX and VVIX: Last week both VIX and VVIX have moved lower. VIX has made a new swing low below the low of the week beginning 21st of September, but VVIX has not. VVIX remains slightly elevated. This divergence is bearish for price as a volatility of VIX is normally associated with bearish movements in price.
DAILY CHART
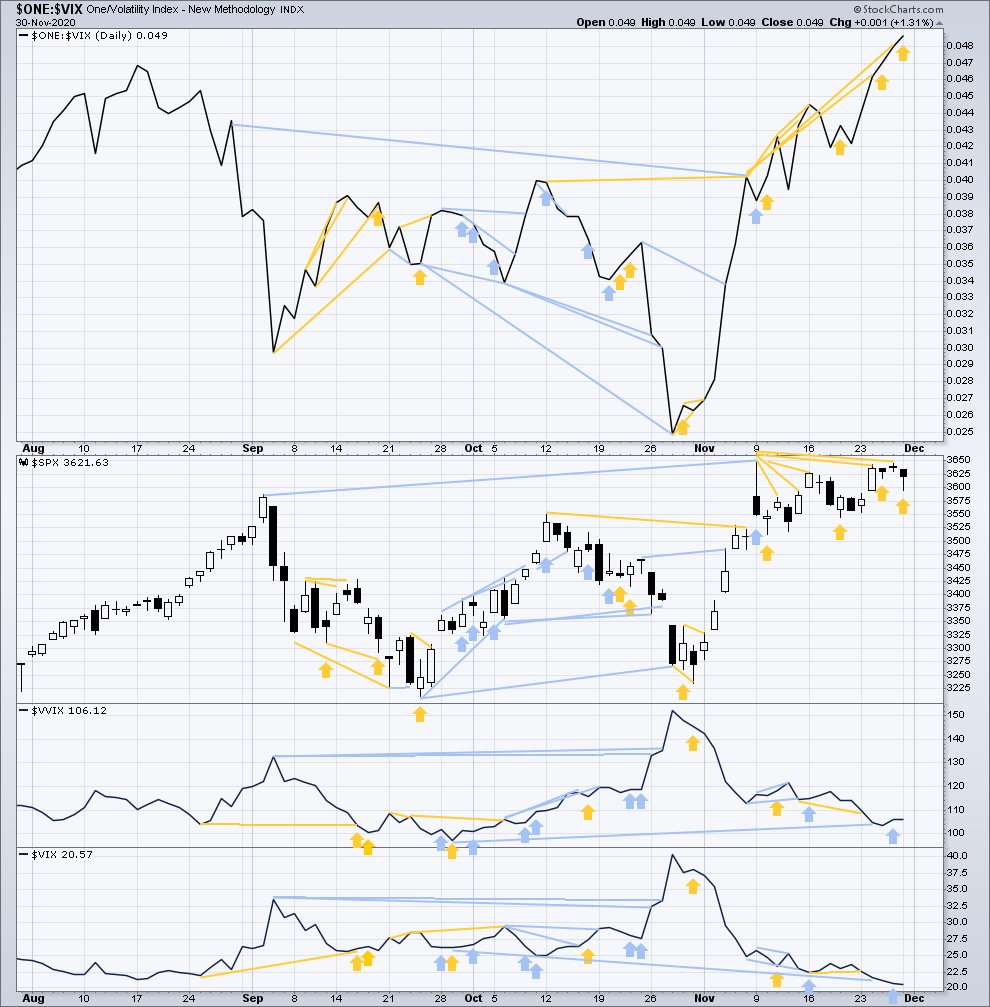
Click chart to enlarge. Chart courtesy of StockCharts.com. So that colour blind members are included, bearish signals will be noted with blue and bullish signals with yellow.
Today price has moved lower, but inverted VIX has moved higher. This divergence is bullish and supports the main hourly Elliott wave count.
Comparing VIX and VVIX at the daily chart level: Short-term bearish divergence noted on Friday has been followed by a downwards session, so it may be resolved.
Today both VIX and VVIX are close to flat. There is no new short-term divergence. Mid-term bearish divergence remains.
DOW THEORY
Dow Theory confirms a new bull market with new highs made on a closing basis:
DJIA: 29,568.57 – closed above on 16th November 2020.
DJT: 11,623.58 – closed above on 7th October 2020.
Adding in the S&P and Nasdaq for an extended Dow Theory, confirmation of a bull market would require new highs made on a closing basis:
S&P500: 3,393.52 – closed above on 21st August 2020.
Nasdaq: 9,838.37 – closed above on June 8, 2020.
Published @ 06:48 p.m. ET.
—
Careful risk management protects your trading account(s).
Follow my two Golden Rules:
1. Always trade with stops.
2. Risk only 1-5% of equity on any one trade.
—
New updates to this analysis are in bold.