
S&P 500: Elliott Wave and Technical Analysis | Charts – October 14, 2020
Summary: A target for primary wave 3 to end is now at 4,606 . The invalidation point is moved up to 3,209.45.
For the short term, three hourly charts are used today. There is some technical support for the second alternate. If price breaks below the channel on the first two hourly charts, then seriously consider the second alternate. If the first two hourly charts are invalidated with a new low below 3,431.56, then expect a deeper and longer lasting pullback is underway, which may find support about 3,417.
The second wave count considers the possibility that a once in multi-generations trend change may have occurred. Some confidence in this wave count would come with invalidation of the first wave count below 2,191.86. However, at this stage, the probability of this bearish wave count is reduced.
At this stage, a new high above 3,588.11 would invalidate the second very bearish Elliott wave count, leaving only a bullish Elliott wave count.
The biggest picture, Grand Super Cycle analysis, is here.
Monthly charts are here, with video here.
ELLIOTT WAVE COUNTS
FIRST WAVE COUNT
WEEKLY CHART
Click chart to enlarge.
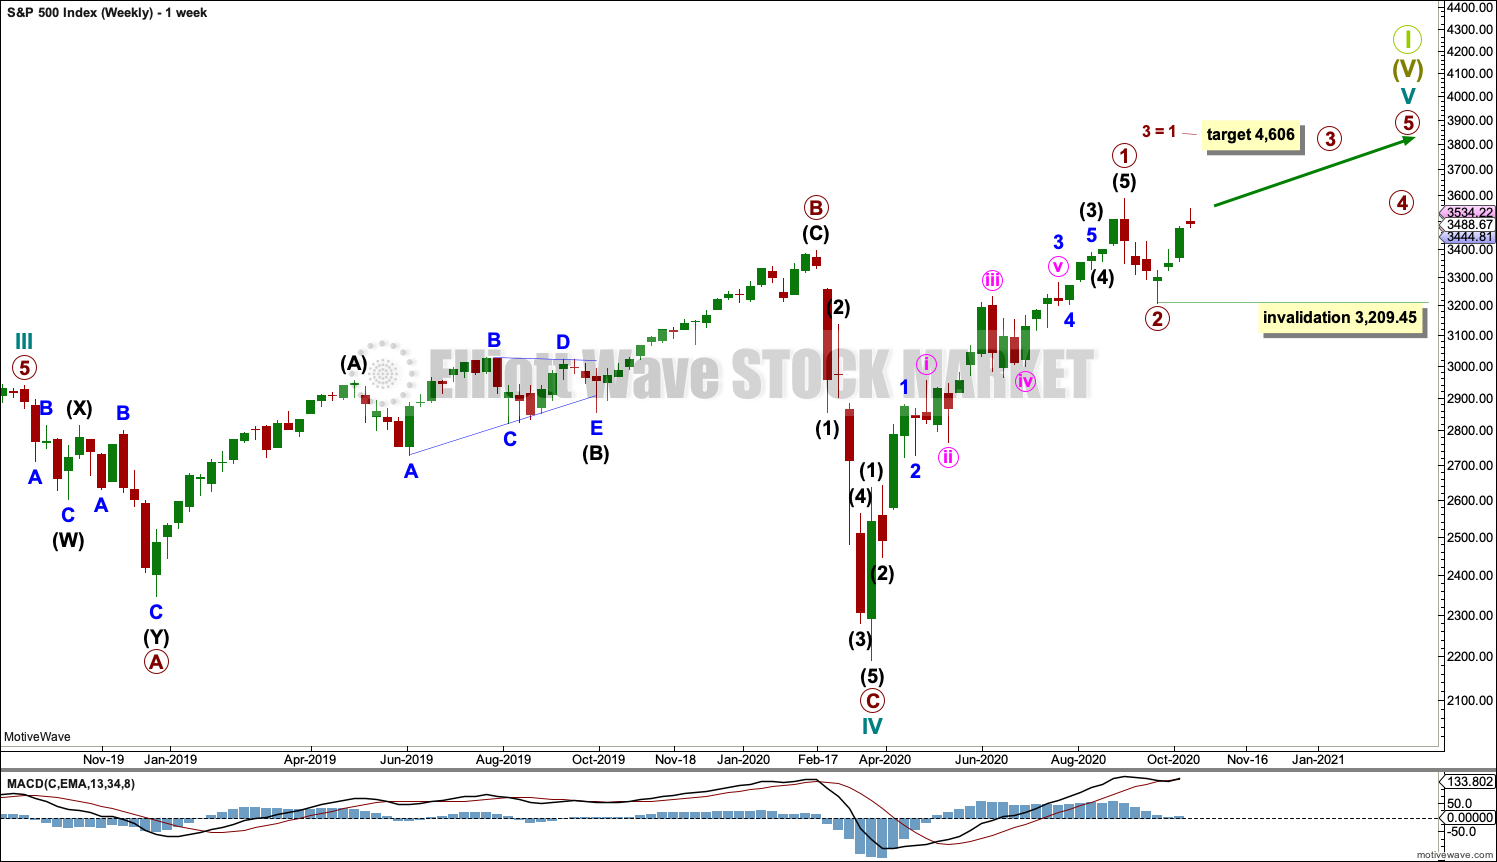
Cycle wave V may last from one to several years. So far it is in its seventh month.
Cycle wave V would most likely subdivide as an impulse. But if overlapping develops, then an ending diagonal should be considered. This chart considers the more common impulse.
Primary waves 1 and 2 may be complete.
Primary wave 3 may have begun. It may only subdivide as an impulse. No second wave correction within primary wave 3 may move beyond its start below 3,209.45.
There is already a Fibonacci ratio between cycle waves I and III within Super Cycle wave (V). The S&P500 often exhibits a Fibonacci ratio between two of its actionary waves but rarely between all three; it is less likely that cycle wave V would exhibit a Fibonacci ratio. The target for Super Cycle wave (V) to end would best be calculated at primary degree, but that cannot be done until all of primary waves 1, 2, 3 and 4 are complete.
DAILY CHART
Click chart to enlarge.
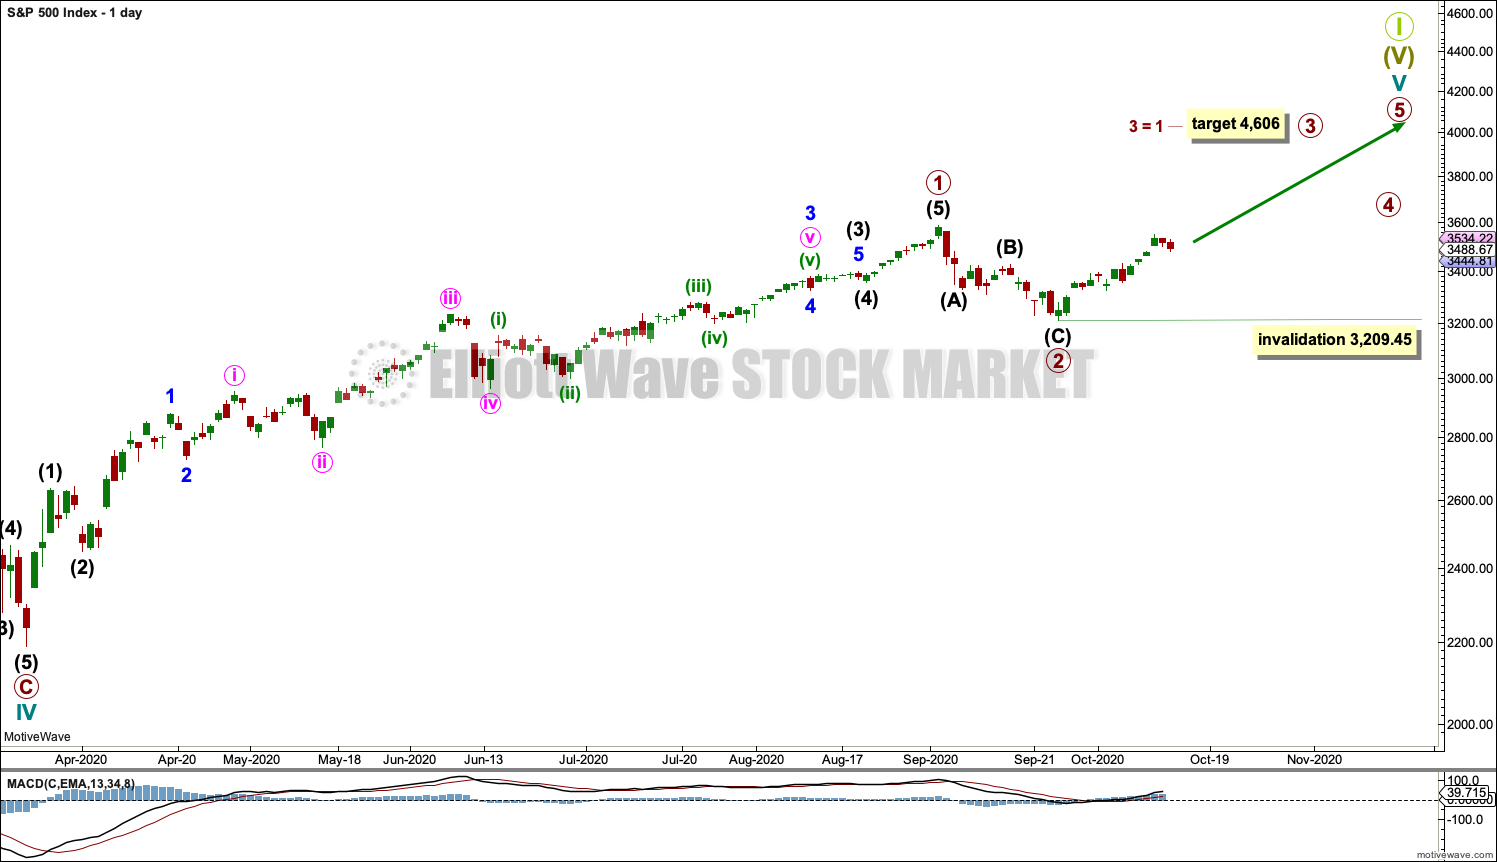
Primary waves 1 and 2 may both be complete. Primary wave 3 may now be underway.
Primary wave 3 may only subdivide as an impulse. No second wave correction within primary wave 3 may move beyond the start of its first wave below 3,209.45.
Primary wave 1 looks extended. The target for primary wave 3 expects it to also be extended.
HOURLY CHART
Click chart to enlarge.
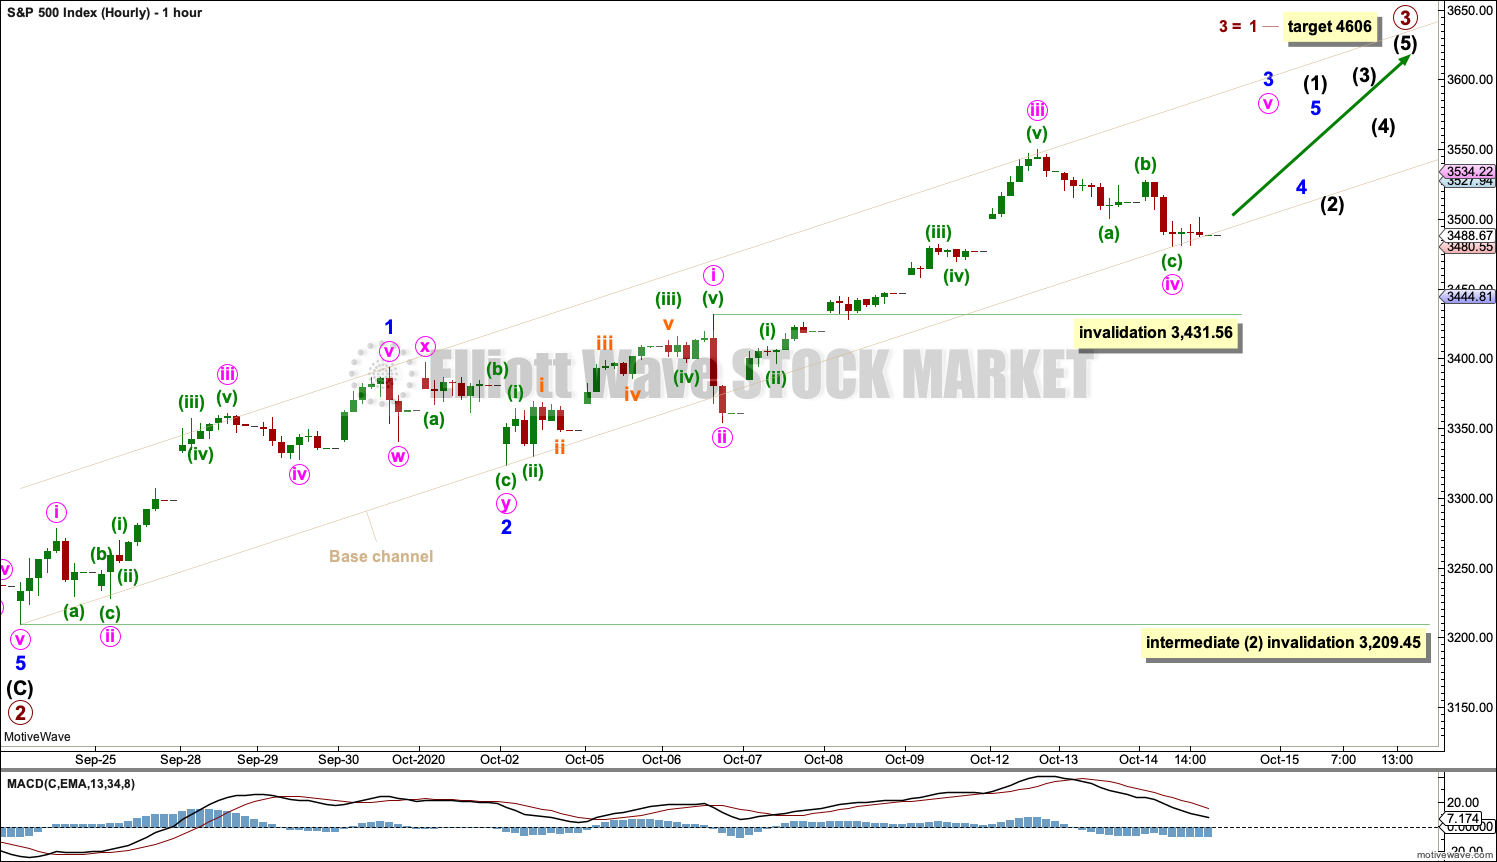
It is possible that primary wave 2 was over as a relatively brief and shallow 0.27 zigzag.
Primary wave 3 may only subdivide as an impulse.
Today this hourly chart and the alternate hourly chart consider the possibility that intermediate wave (1) within primary wave 3 is incomplete.
When intermediate wave (1) may be over, then intermediate wave (2) may be a pullback to last at least a week and possibly up to three or four weeks.
Intermediate wave (1) may be unfolding as an impulse with an extended third wave for minor wave 3 within it. This is the most commonly extended wave for this market, so this hourly wave count has the highest probability of the hourly wave counts today.
Minute wave iv within minor wave 3 may not move into minute wave i price territory below 3,431.56.
If the base channel is breached by a full hourly candlestick below and not touching the lower edge, then it may be possible that minor wave 3 may be over. Minor wave 4 may not move into minor wave 1 price territory below 3,393.56.
ALTERNATE HOURLY CHART
Click chart to enlarge.
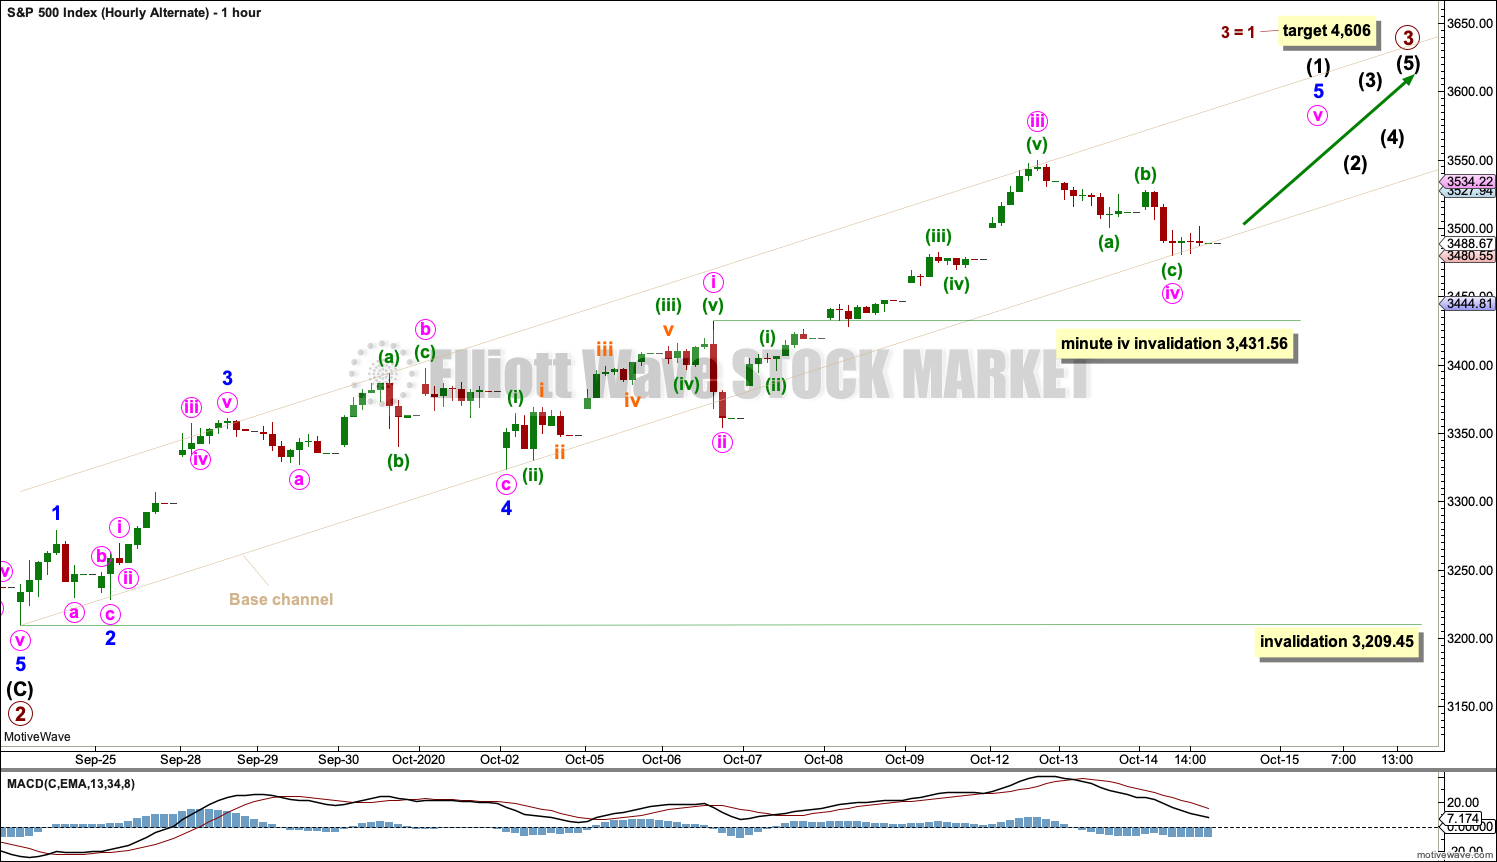
With many subdivisions now within upwards movement from the low on 24th September, there are multiple ways to label it.
Intermediate wave (1) may be ending with an extended minor wave 5. Behaviour following extended fifth waves suggests the following correction may be sharp and may find support about the low of wave 2 within the extension. Support for intermediate wave (2) may occur about the low of minute wave ii at 3,354.54.
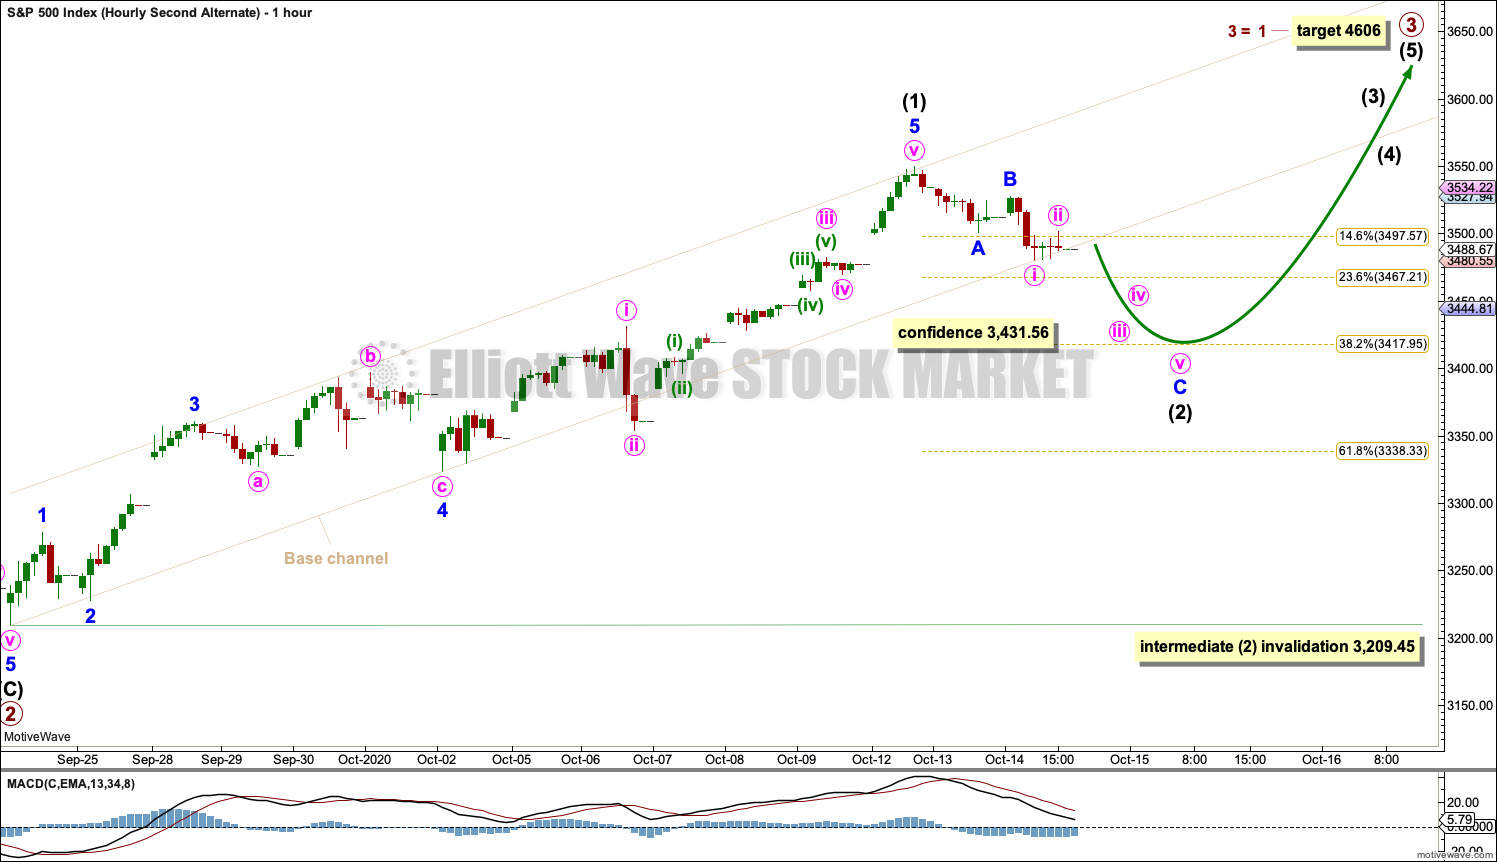
SECOND ALTERNATE HOURLY CHART
Click chart to enlarge.
It is also possible that intermediate wave (1) may be complete, although this labelling does not have as good a look as either of the first two hourly wave counts. This wave count is considered because today there is some support for this view from technical analysis: an exhaustion gap and bearish divergence between price and both the AD line and VIX.
If intermediate wave (1) is over, then intermediate wave (2) may continue for several more sessions. Intermediate wave (2) would most likely subdivide as a zigzag and most likely be relatively shallow. Intermediate wave (2) may not move beyond the start of intermediate wave (1) below 3,209.45.
SECOND WAVE COUNT
DAILY CHART
Click chart to enlarge.
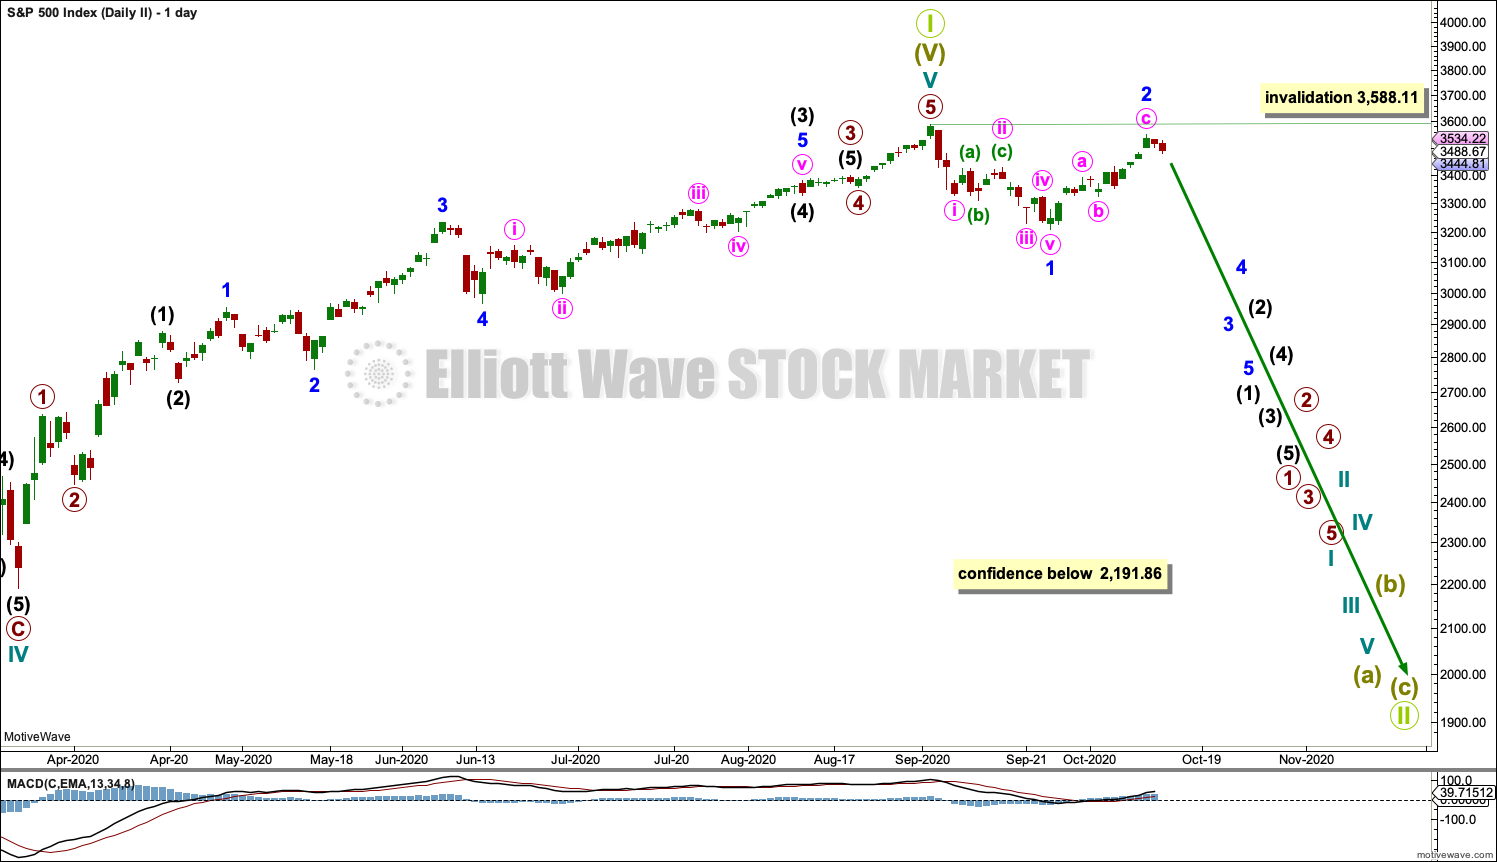
This wave count is the same as the first wave count with the exception of the degree of labelling within cycle wave V. If the degree of labelling is moved up one degree, then it is possible that cycle wave V to end Super cycle wave (V) to end Grand Super Cycle wave I is complete.
A new low below 2,191.86 would add confidence in this wave count. At that stage, the first wave count would be invalidated.
A new bear market at Grand Super Cycle degree may be expected to last over a decade. It may take price below the start of Super Cycle wave (V) at 666.79 in March 2009.
A first five down, labelled minor wave 1, may be complete. Minor wave 2 now also may be complete. A third wave down at minor degree may just have begun. It should exhibit strength if this wave count is correct. So far it has not. This wave count does not have support from technical analysis.
Major new downwards trends for this market usually begin with strength. The lack of any 90% down days or back to back 80% down days reduces the probability of this wave count. Now with the AD line making a new all time high and two back to back 80% upwards days the probability of this wave count has reduced further.
HOURLY CHART
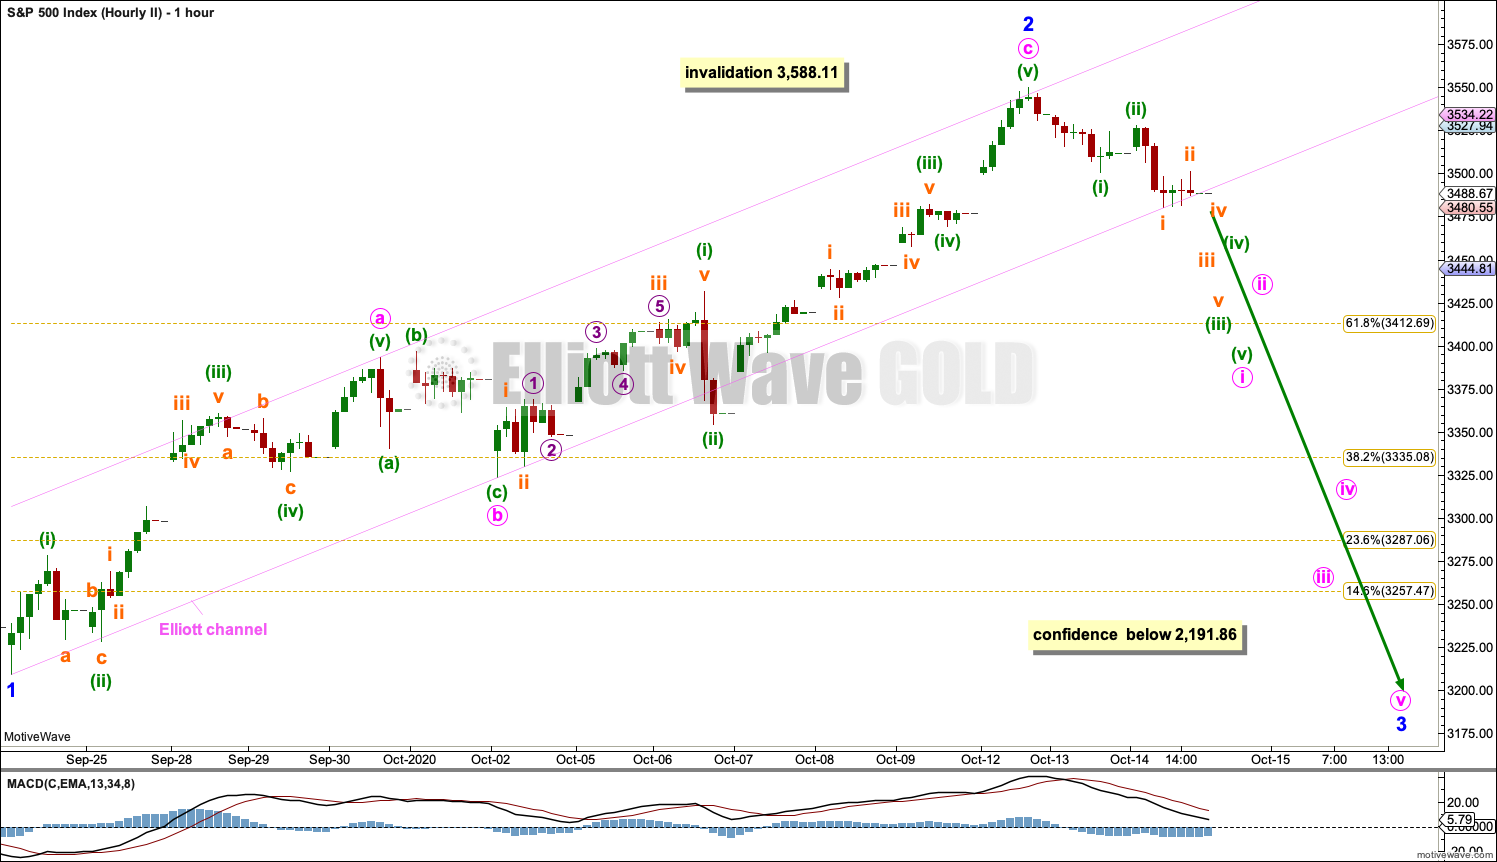
Click chart to enlarge.
Minor wave 2 may be a complete zigzag.
If it continues higher as a double zigzag, then minor wave 2 may not move beyond the start of minor wave 1 above 3,588.11.
TECHNICAL ANALYSIS
WEEKLY CHART
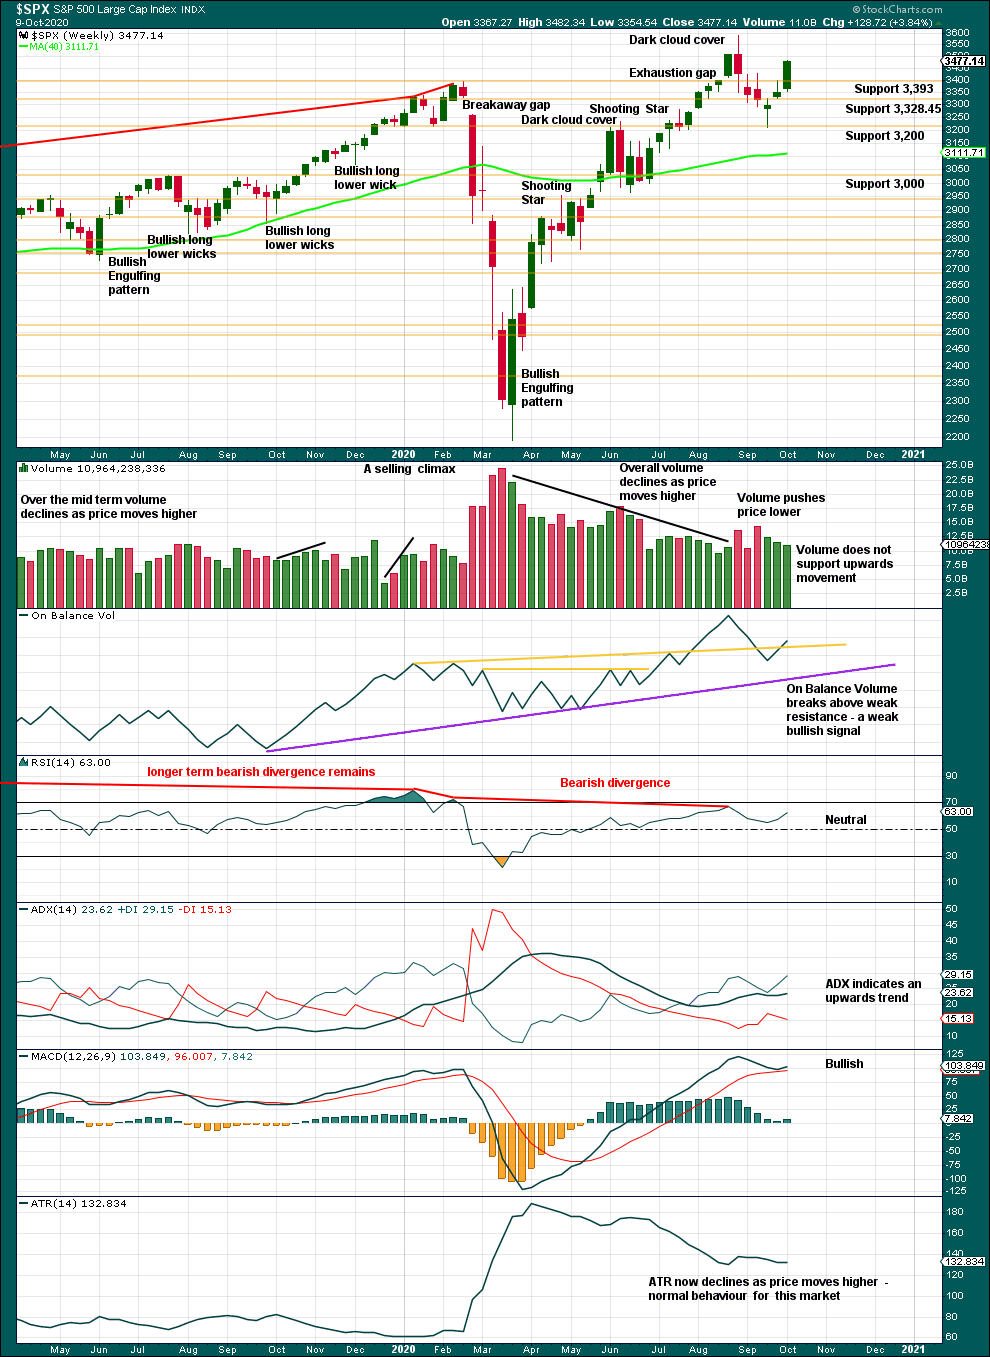
Click chart to enlarge. Chart courtesy of StockCharts.com.
Last week price closes near highs for the week. Range has increased. This suggests more upwards movement this week.
DAILY CHART
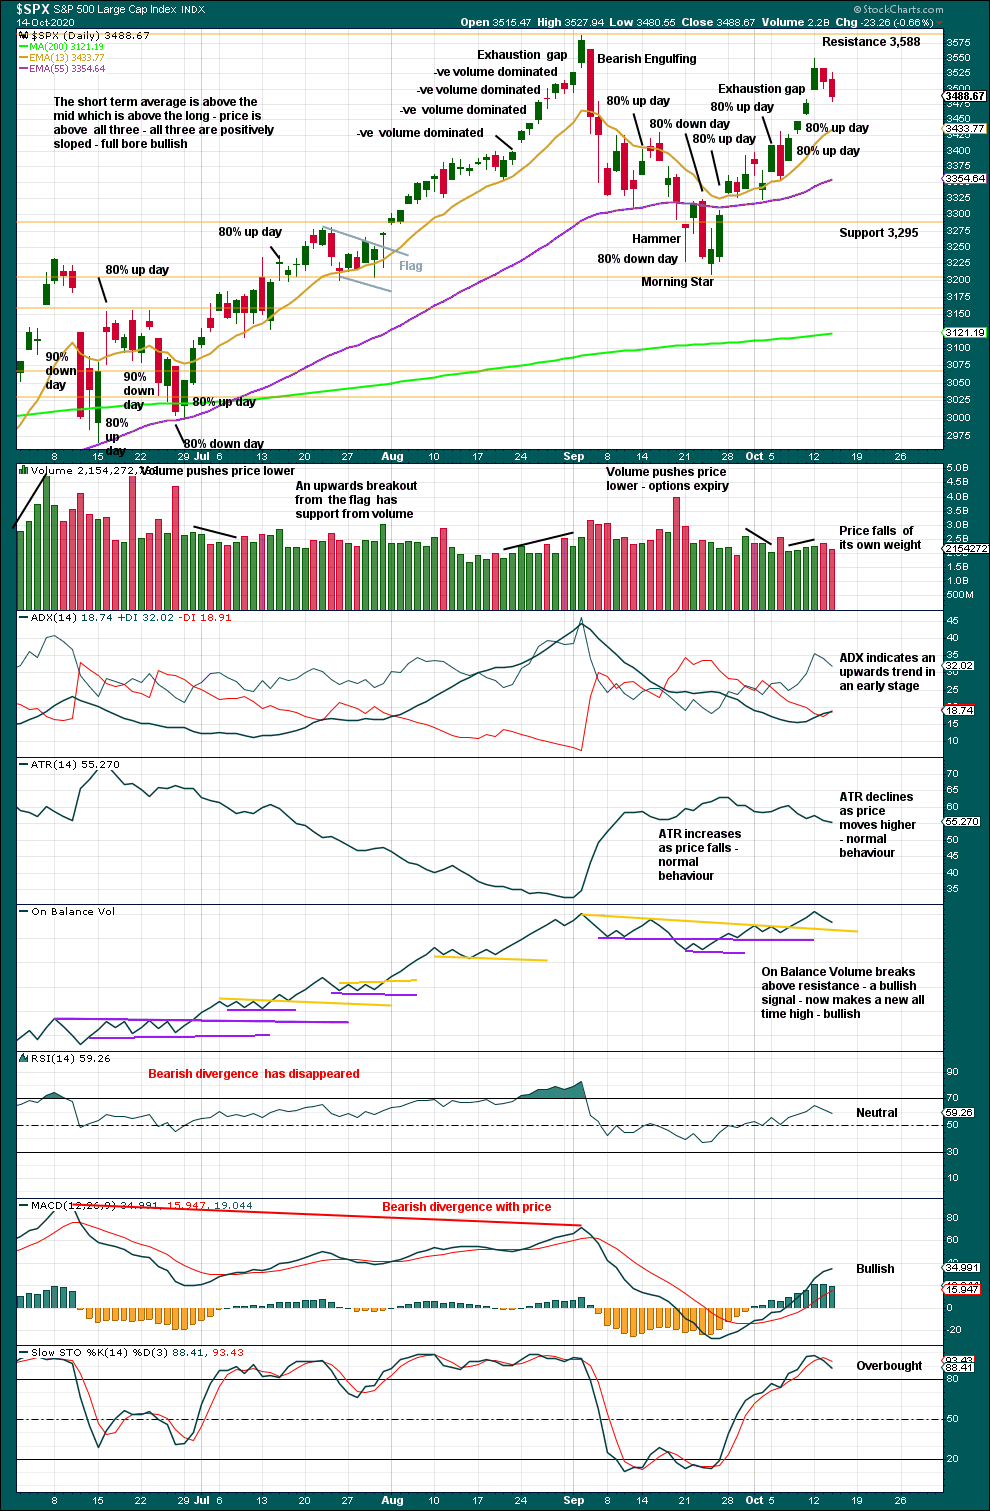
Click chart to enlarge. Chart courtesy of StockCharts.com.
There are now two back to back 80% upwards days.
The bullish signal from On Balance Volume has reasonable technical significance because the trend line breached had four tests and was reasonably long held and close to horizontal. On Balance Volume gives another bullish signal as it makes a new all time high.
ADX gives a strong bullish signal.
New all time highs may be close by.
The last gap is now closed, so it is renamed an exhaustion gap. A pullback may find support about 3,435 or below that about 3,295.
BREADTH – AD LINE
WEEKLY CHART

Click chart to enlarge. Chart courtesy of StockCharts.com. So that colour blind members are included, bearish signals will be noted with blue and bullish signals with yellow.
Breadth should be read as a leading indicator.
Lowry’s Operating Companies Only AD line has still not made new all time highs, but at the end of last week it is very close. The last high for the OCO AD line was in the week beginning January 13, 2020. There was 7 and a half months of bearish divergence between price and the OCO AD line at the September high.
The NYSE All Issues AD line made new highs last week. This divergence is bullish.
Large caps all time high: 3,588.11 on September 2, 2020.
Mid caps all time high: 2,109.43 on February 20, 2020.
Small caps all time high: 1,100.58 on August 27, 2018.
This rise has been led by large caps, which is a feature of an aged bull market. Above the swing high of the 11th of August, large caps first made a new high now followed by mid caps. Small caps have not yet made a new high above this point.
DAILY CHART
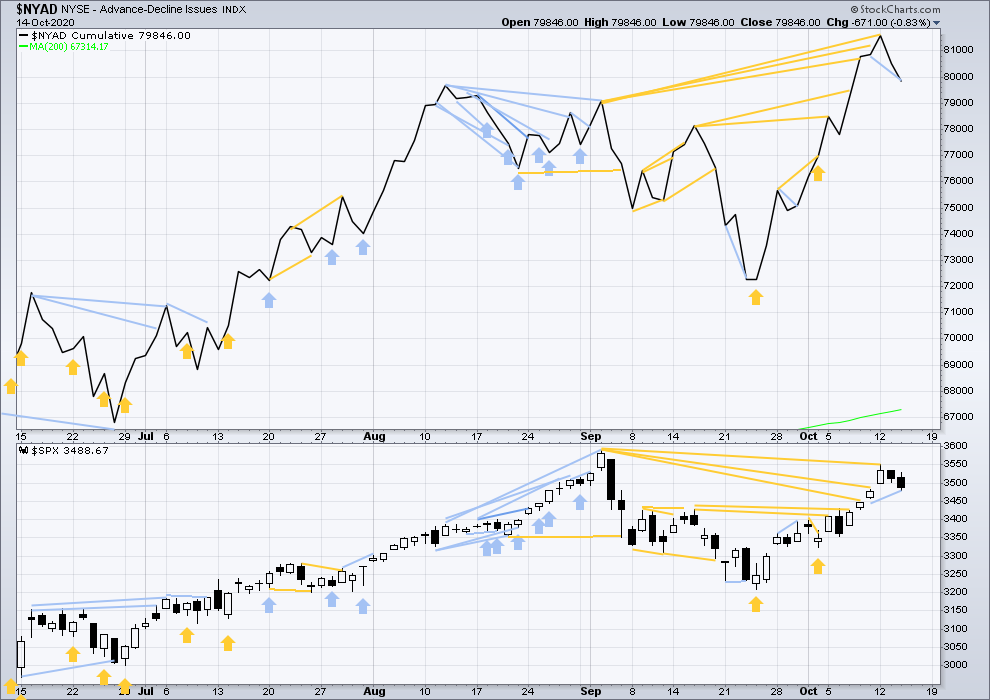
Click chart to enlarge. Chart courtesy of StockCharts.com. So that colour blind members are included, bearish signals will be noted with blue and bullish signals with yellow.
Today both the AD line and price have moved lower. The AD line has made a new short-term low below the low three sessions prior, but price has not. This divergence is bearish for the short term. Breadth is falling faster than price. This supports the second alternate hourly Elliott wave count.
The OCO AD line will be watched carefully. If that too makes a new all time high, then that would be a very bullish signal; it has not done so yet, but it is very close.
VOLATILITY – INVERTED VIX CHART
WEEKLY CHART
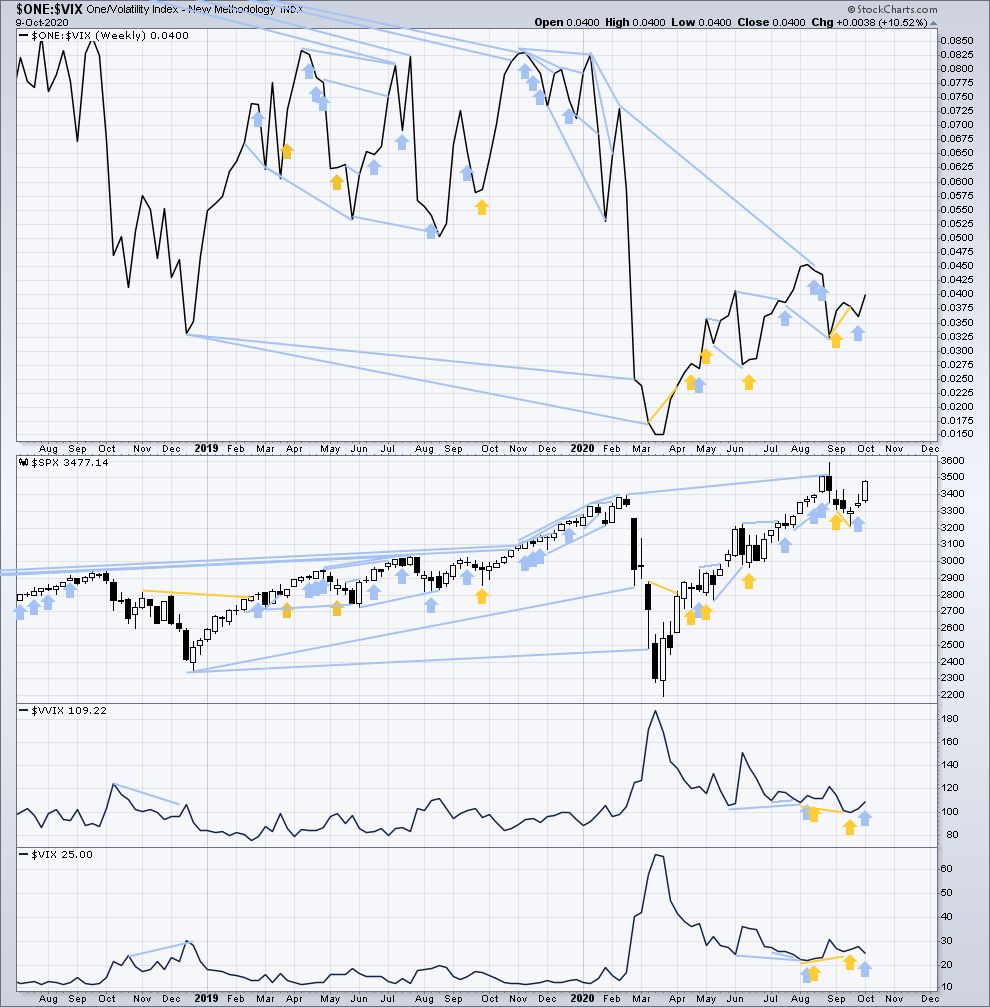
Click chart to enlarge. Chart courtesy of StockCharts.com. So that colour blind members are included, bearish signals will be noted with blue and bullish signals with yellow.
Inverted VIX remains well below all time highs. The all time high for inverted VIX was in the week beginning October 30, 2017. There is nearly 3 years of bearish divergence between price and inverted VIX. There is all of long, mid and short-term bearish divergence.
Last week both price and inverted VIX have moved higher. There is no new divergence.
Comparing VIX and VVIX: Last week VIX has moved lower, but VVIX has moved higher. This divergence is bearish for the short term. If a cluster of bearish signals develops, then that may warn of a deeper pullback.
DAILY CHART
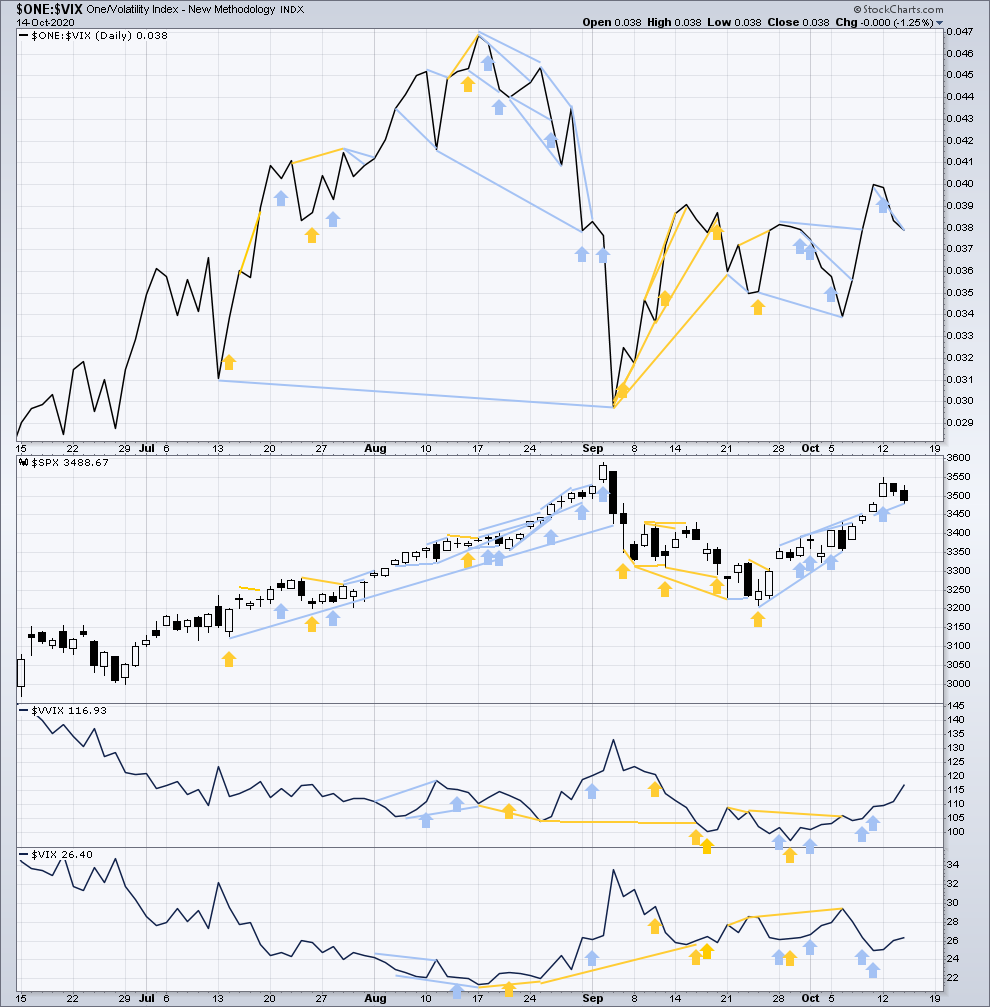
Click chart to enlarge. Chart courtesy of StockCharts.com. So that colour blind members are included, bearish signals will be noted with blue and bullish signals with yellow.
Today both price and inverted VIX have moved lower. Inverted VIX has made a new low below the low three sessions prior, but price has not. This divergence is bearish and supports the second alternate hourly Elliott wave count.
There is an increasing cluster of bearish signals from VIX.
Comparing VIX and VVIX at the daily chart level: For two days in a row last week VIX has moved lower, but VVIX has moved slightly higher. This divergence is bearish for the short term for price.
DOW THEORY
Dow Theory still concludes a bear market is in place.
Dow Theory confirmed a bear market with the following lows made on a closing basis:
DJIA: 21,712.53 – a close below this point was been made on the March 12, 2020.
DJT: 8,636.79 – a close below this point was been made on March 9, 2020.
Adding in the S&P and Nasdaq for an extended Dow Theory, a bear market was confirmed:
S&P500: 2,346.58 – a close below this point was made on March 20, 2020.
Nasdaq: 7,292.22 – a close below this point was made on the March 12, 2020.
At this time, to shift Dow Theory from viewing a bear market to confirmation of a new bull market would require new highs made on a closing basis:
DJIA: 29,568.57
DJT: 11,623.58 – closed above on 7th October 2020.
Adding in the S&P and Nasdaq for an extended Dow Theory, confirmation of a bull market would require new highs made on a closing basis:
S&P500: 3,393.52 – closed above on 21st August 2020.
Nasdaq: 9,838.37 – closed above on June 8, 2020.
Published @ 06:56 p.m. ET.
—
Careful risk management protects your trading account(s).
Follow my two Golden Rules:
1. Always trade with stops.
2. Risk only 1-5% of equity on any one trade.
—
New updates to this analysis are in bold.