
S&P 500: Elliott Wave and Technical Analysis | Charts – August 27, 2020
The next short-term target was met and passed today before a quick sharp reversal.
Summary: A target for upwards movement to end is at either 3,486 or 3,800.
There is now a strong cluster of bearish divergence between price and the AD line, and price and VIX. With RSI now extreme, the warning that a large bearish move may be closer is getting louder. Risk management is extremely important in this type of environment. It is looking now like a blow off top or bubble may be forming. Either alternate wave count may outline this possibility.
Confidence points for downwards movement are 3,354.68 and 2,637.01. Further confidence in a sustainable high may be had as each price point is passed.
A new low below 2,191.86 would be extremely bearish.
The biggest picture, Grand Super Cycle analysis, is here.
Monthly charts are here, with video here.
ELLIOTT WAVE COUNTS
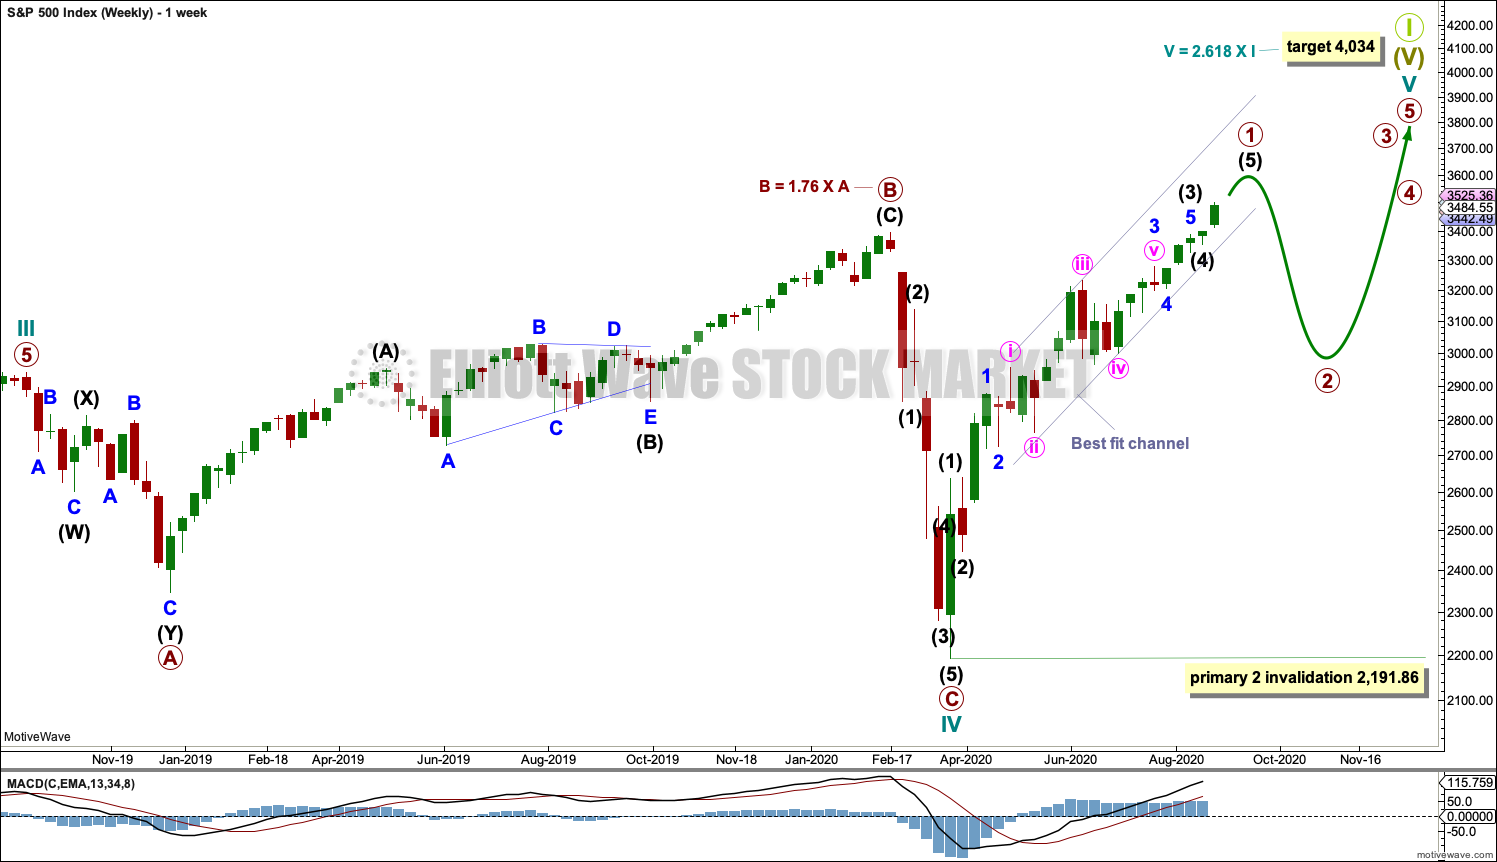
FIRST WAVE COUNT
WEEKLY CHART
Click chart to enlarge.
Cycle wave V may last from one to several years.
Cycle wave V may be underway and would most likely subdivide as an impulse. But if overlapping develops, then an ending diagonal should be considered. This chart considers the more common impulse.
Primary wave 1 may be incomplete. Primary wave 2 may not move beyond the start of primary wave 1 below 2,191.86.
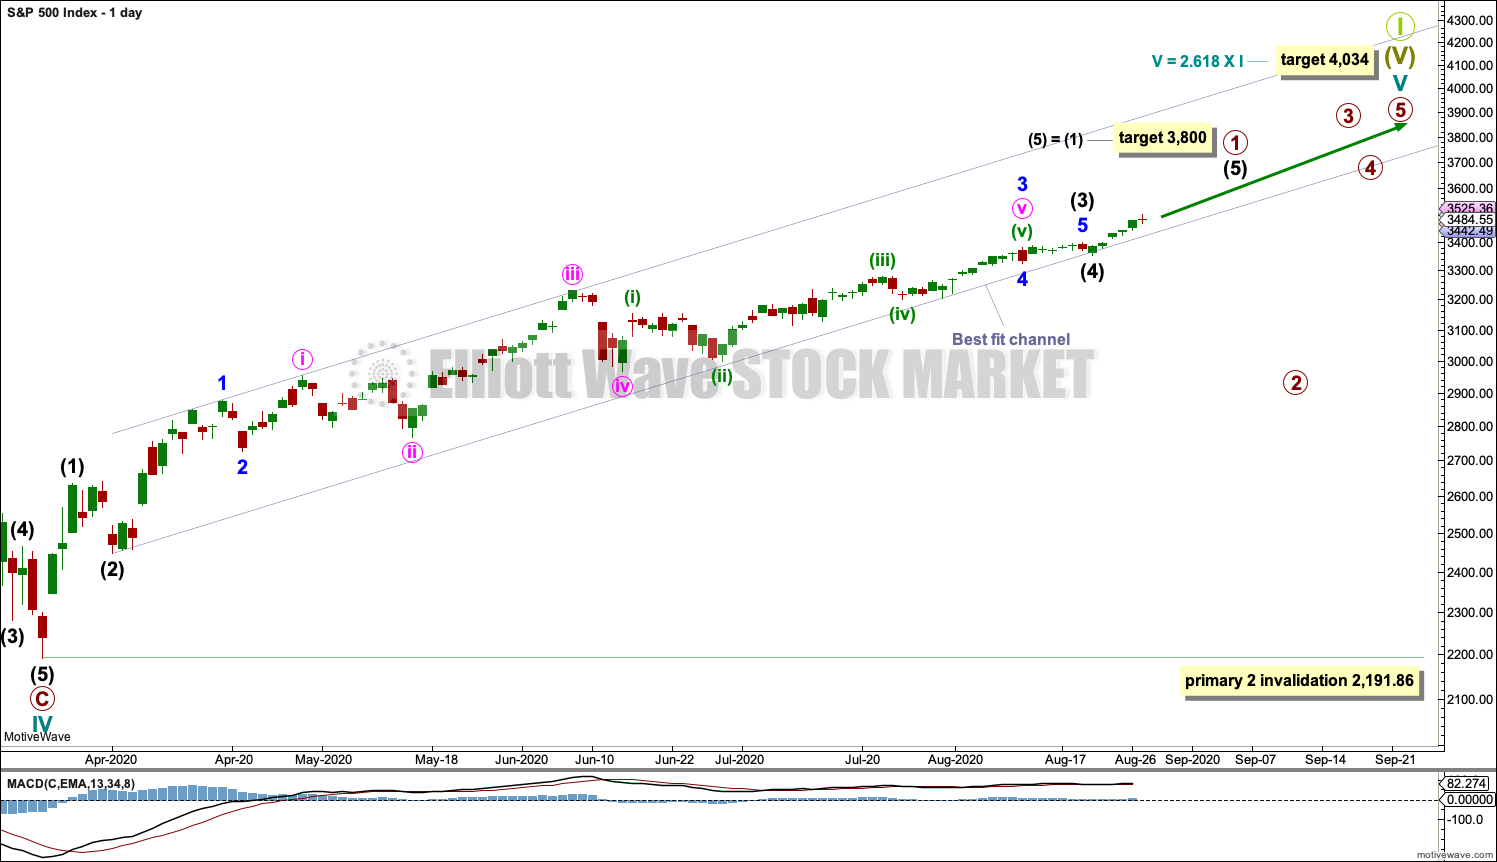
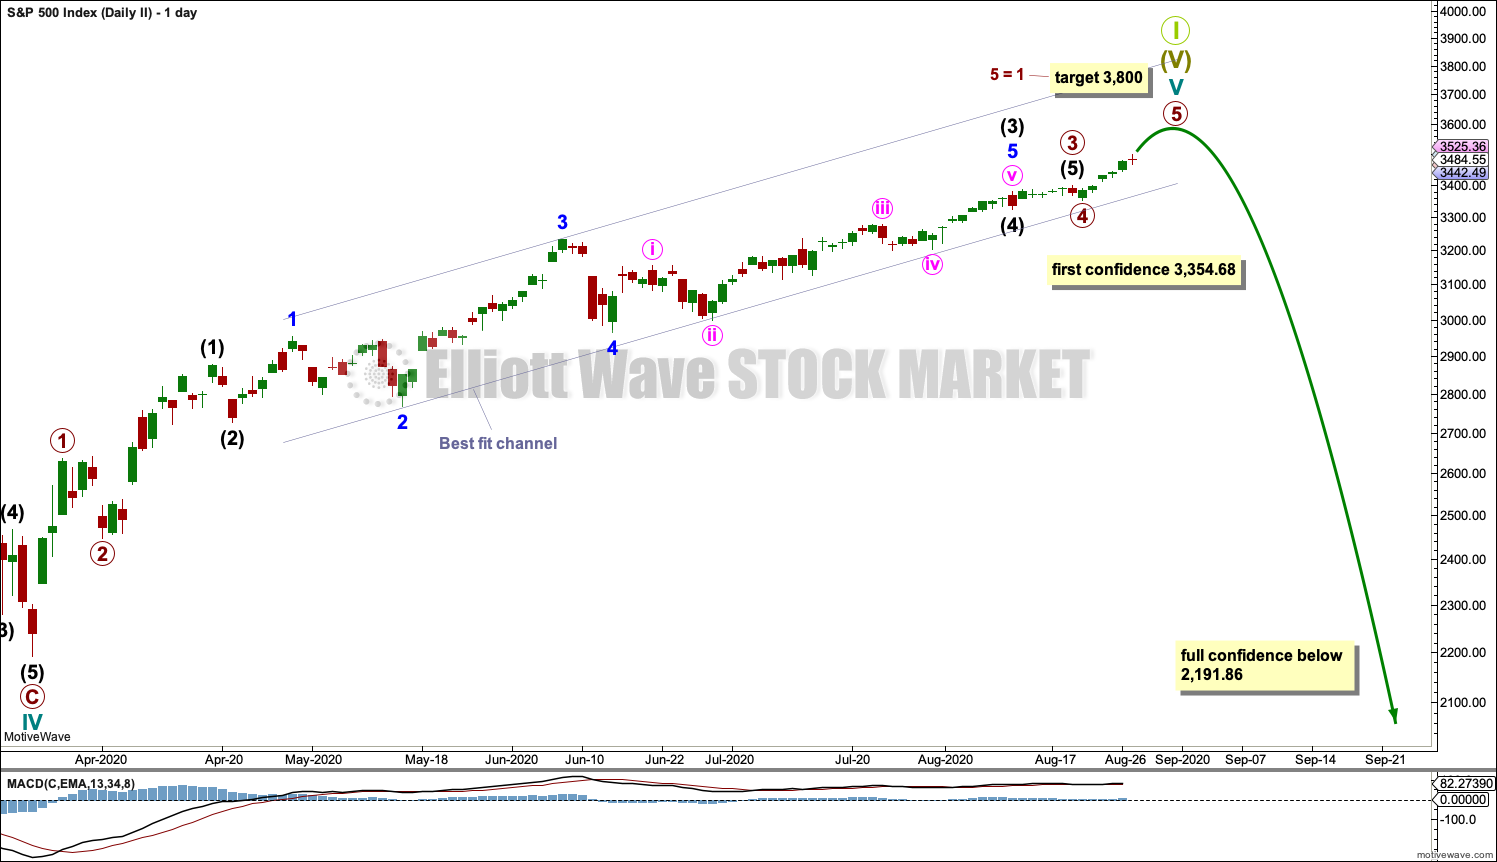
DAILY CHART
Click chart to enlarge.
It is possible to see primary wave 1 as an impulse in which intermediate wave (3) is longer than intermediate wave (1).
A target is calculated for intermediate wave (5) based upon the most common Fibonacci ratio to intermediate wave (1).
The best fit channel contains all of primary wave 1.
When this best fit channel is breached by a full daily candlestick below and not touching the lower edge, then that may be taken as an indication that primary wave 1 may be over and primary wave 2 may have begun.
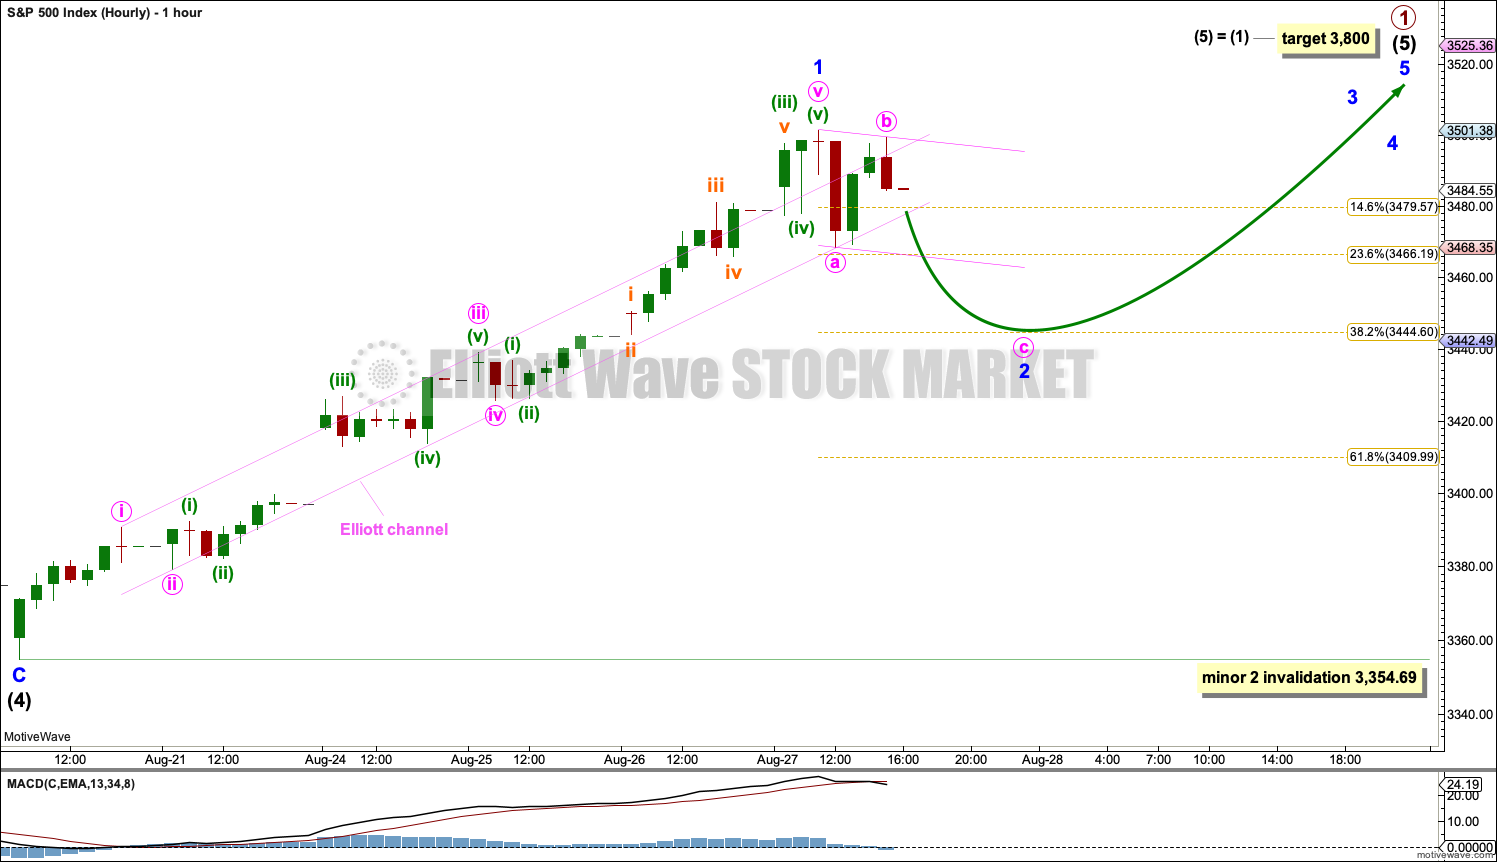
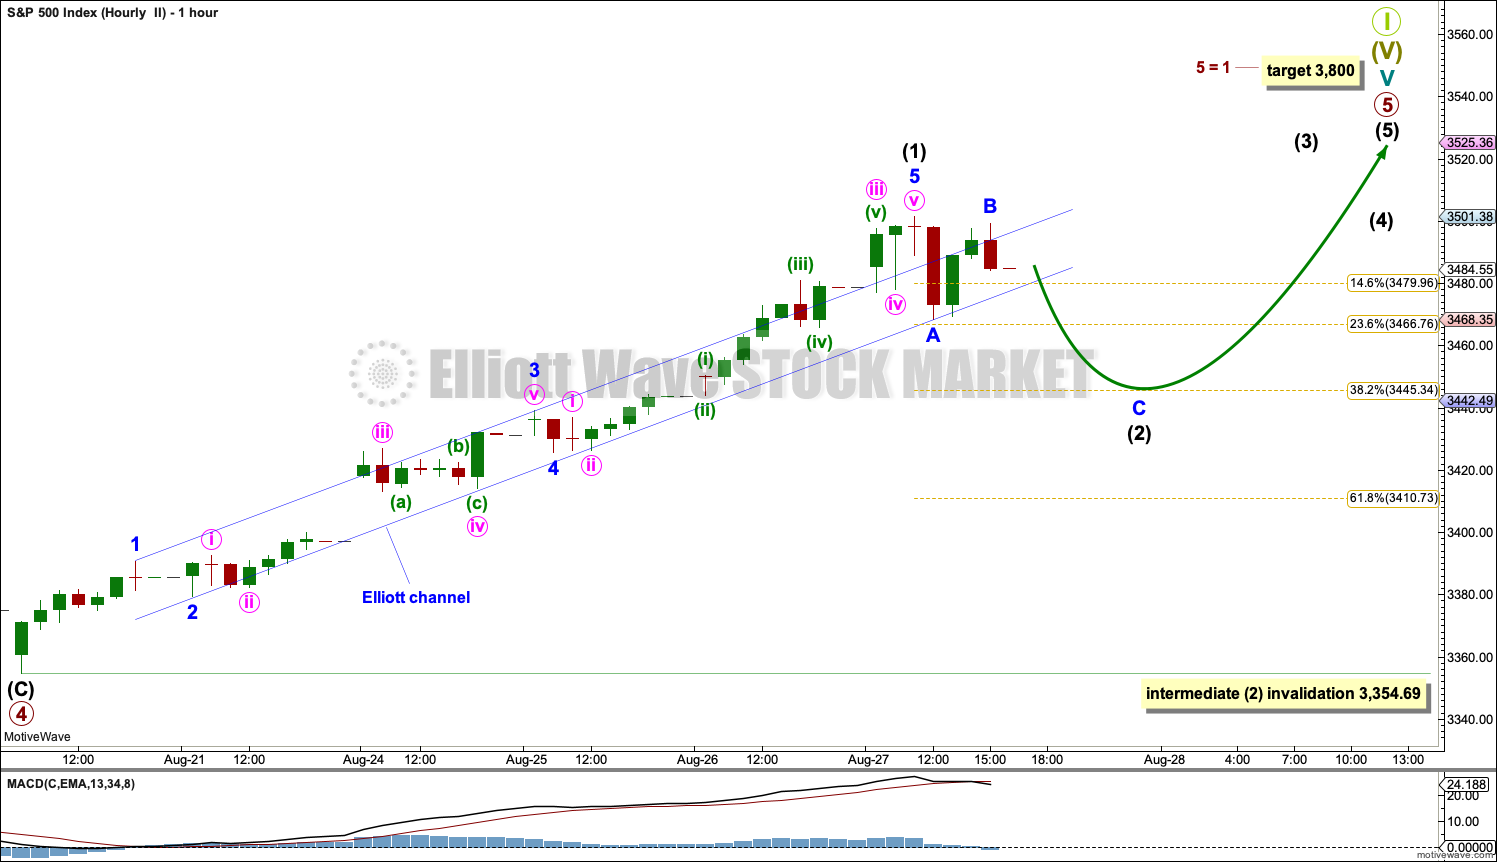
HOURLY CHART
Click chart to enlarge.
Intermediate wave (5) must subdivide as a five wave motive structure, most likely an impulse. Minor wave 1 within intermediate wave (5) may be complete.
Minor wave 2 may be a brief pullback within the ongoing upwards trend; it may only barely breach the channel that contains minor wave 1. Minor wave 2 may end about the 0.382 Fibonacci ratio of minor wave 1; if this target is wrong, then it may be too low.
Minor wave 2 may not move beyond the start of minor wave 1 below 3,354.69.
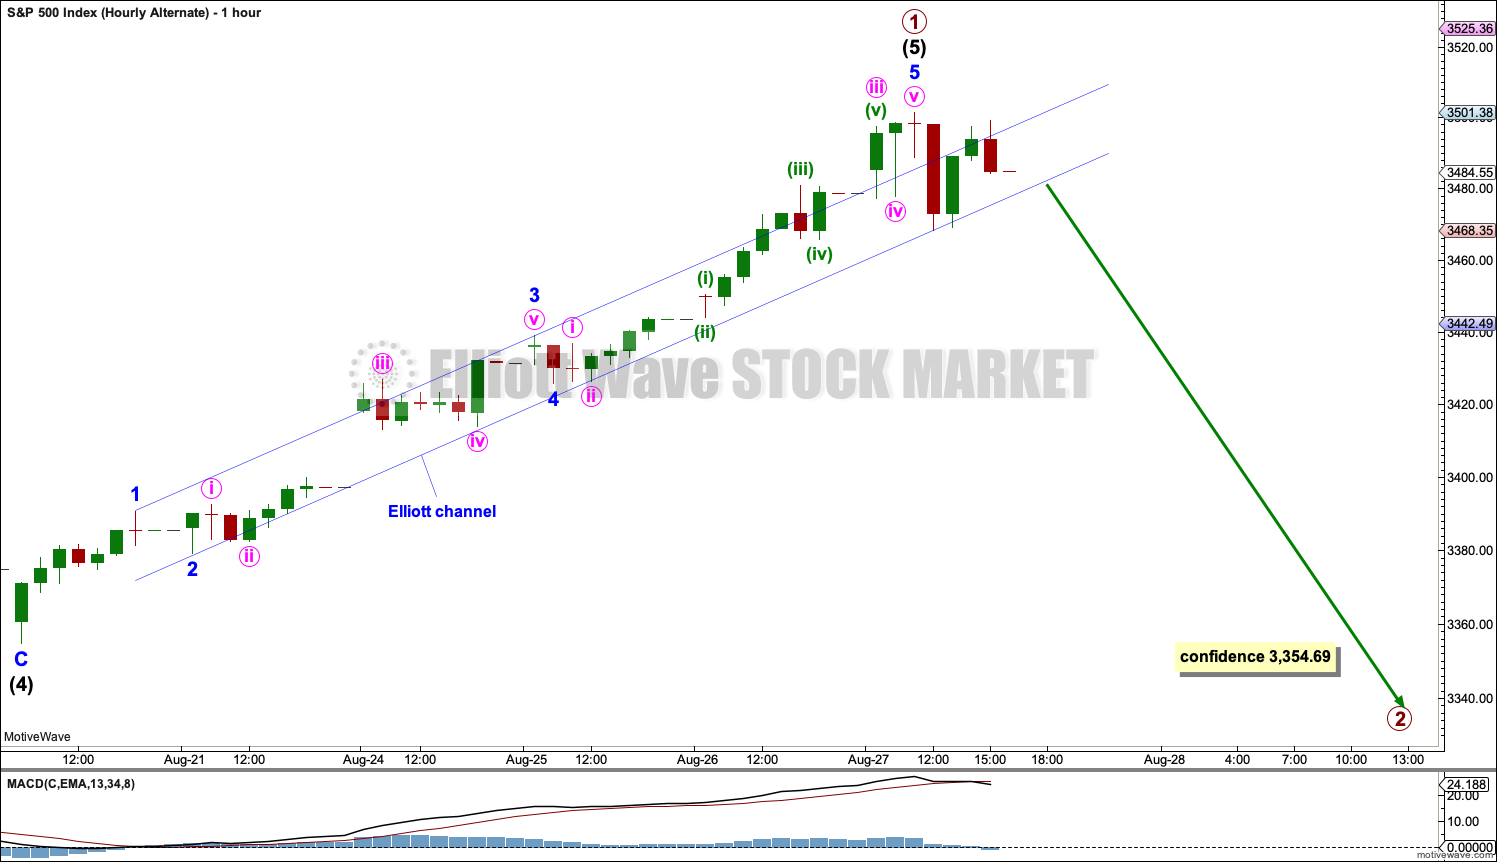
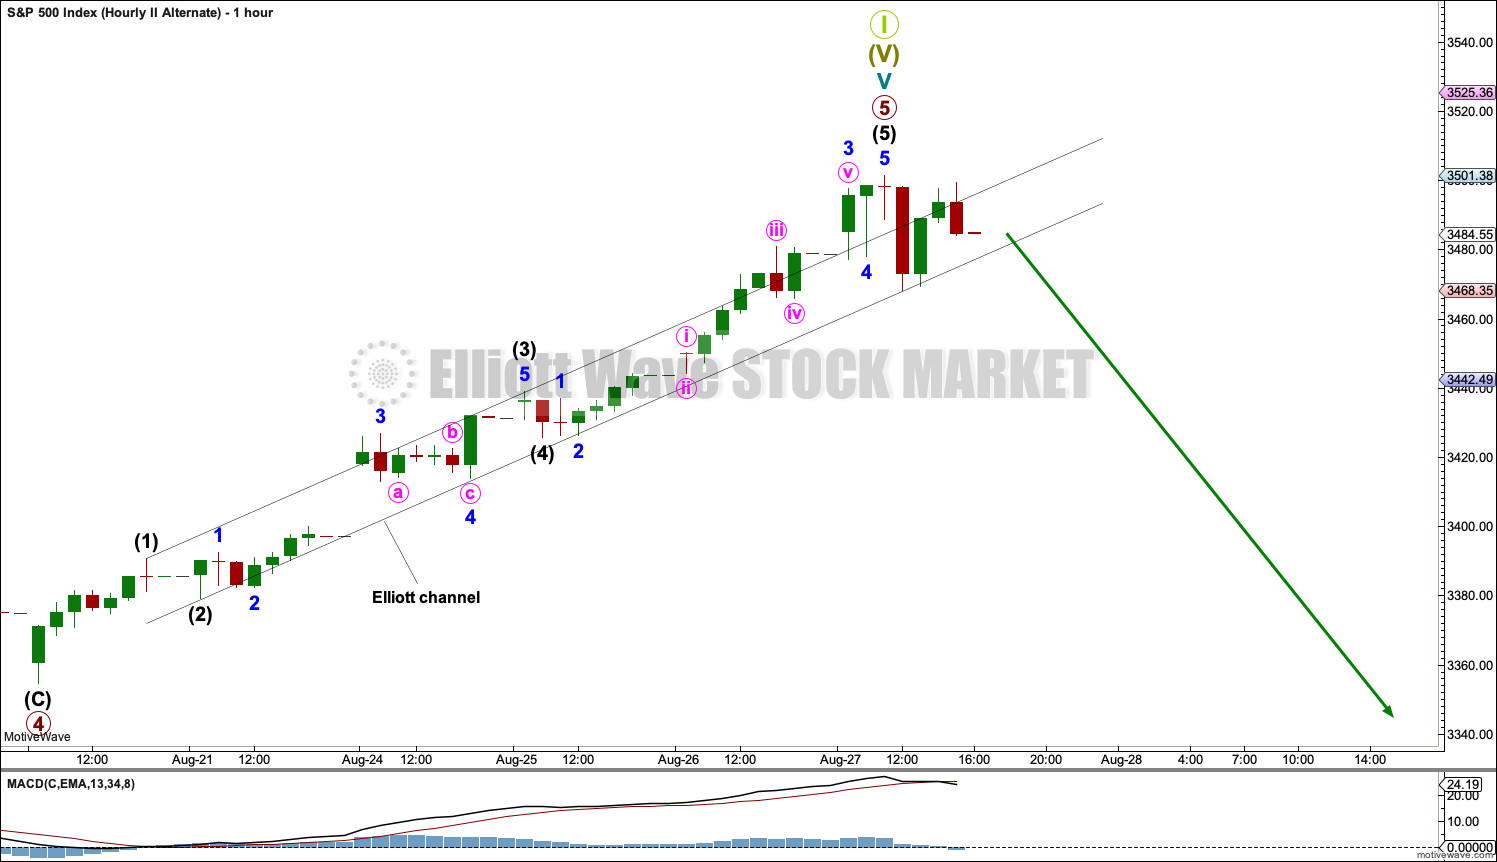
ALTERNATE HOURLY CHART
Click chart to enlarge.
By simply moving the degree of labelling within intermediate wave (5) up one degree, it is possible that at today’s high intermediate wave (5) is complete and primary wave 1 may be complete.
Primary wave 2 should last at least a few days. It may correct to either the 0.382 Fibonacci ratio at 2,928 or the 0.618 Fibonacci ratio at 2,621. Primary wave 2 may not move beyond the start of primary wave 1 below 2,181.86.
SECOND WAVE COUNT
DAILY CHART
Click chart to enlarge.
This wave count is the same as the first wave count with the exception of the degree of labelling within cycle wave V. If the degree of labelling is moved up one degree, then it is possible that cycle wave V to end Super cycle wave (V) to end Grand Super Cycle wave I is very close to completion.
Primary waves 1 through to 4 within cycle wave V may be complete. Primary wave 5 may be almost complete.
A new low below 3,354.68 would indicate at least a short-term trend change.
A new low below 2,191.86 would add full confidence in this wave count. At that stage, the first wave count would be invalidated.
HOURLY CHART
Click chart to enlarge.
At the hourly chart level, this wave count is exactly the same as the first wave count with the sole exception being the degree of labelling. Here, the degree of labelling is one degree higher.
Intermediate wave (2) may not move beyond the start of intermediate wave (1) below 3,354.69.
ALTERNATE HOURLY CHART
Click chart to enlarge.
If the degree of labelling within primary wave 5 is moved up one degree, then it is possible that a Grand Super Cycle degree trend change may have occurred today.
TECHNICAL ANALYSIS
WEEKLY CHART
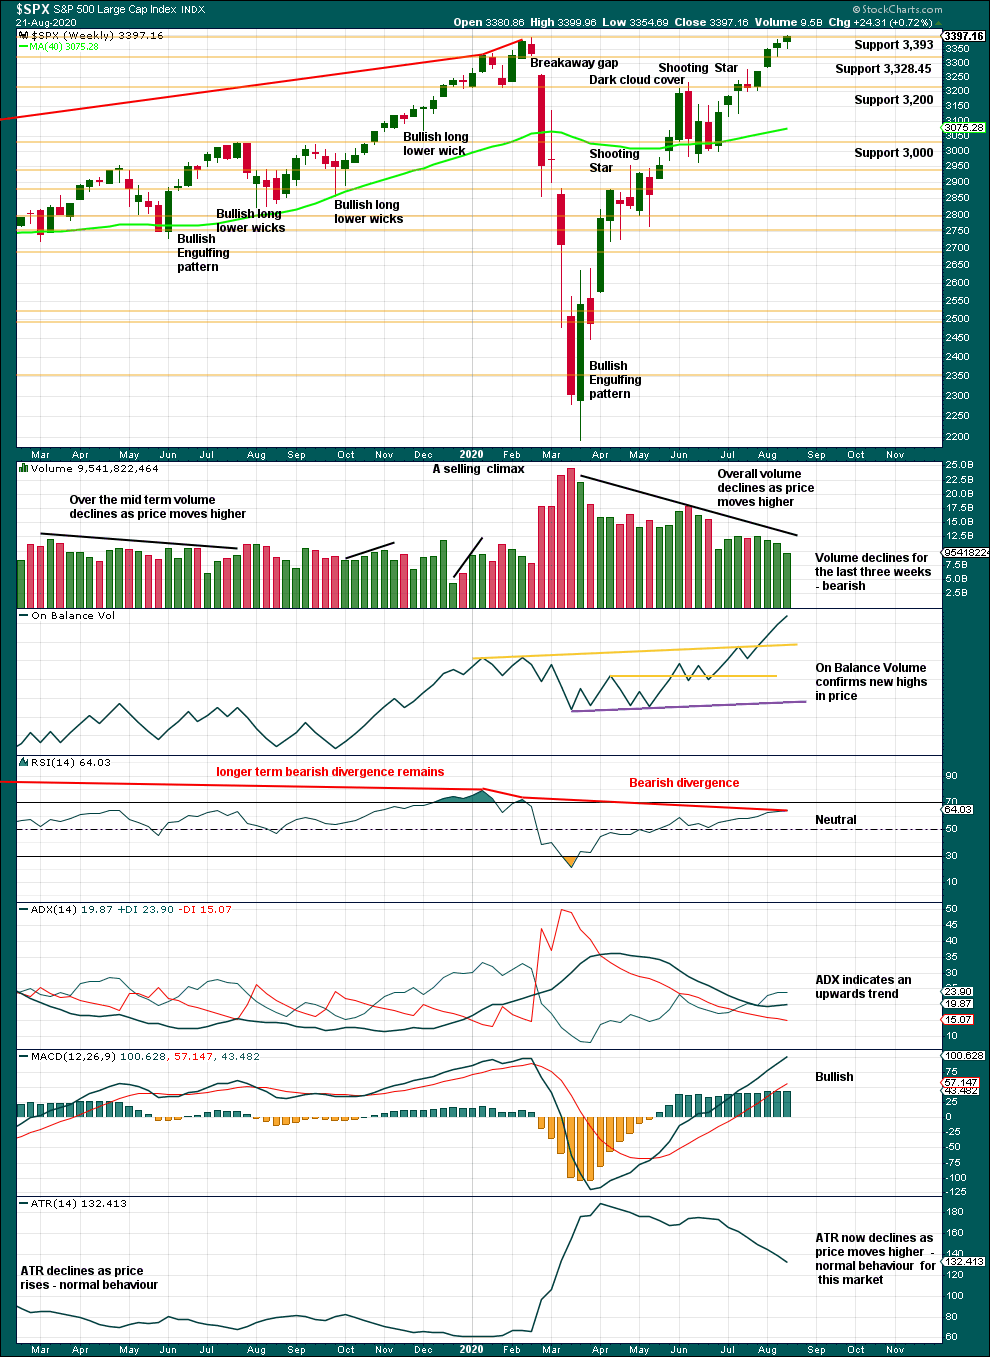
Click chart to enlarge. Chart courtesy of StockCharts.com.
A further decline in range and volume last week indicates weakness. Last week has closed above the prior all time high at 3,393.52. Now that this has been breached, it is possible that some energy may be released and price may move up with a little more strength.
RSI is not overbought, but it does exhibit bearish divergence with price. Sometimes this can disappear, but it is often a signal of weakness and appears before a sustainable high.
For the short term, a close near highs for the week and a slightly bullish lower wick suggest more upwards movement next week.
DAILY CHART
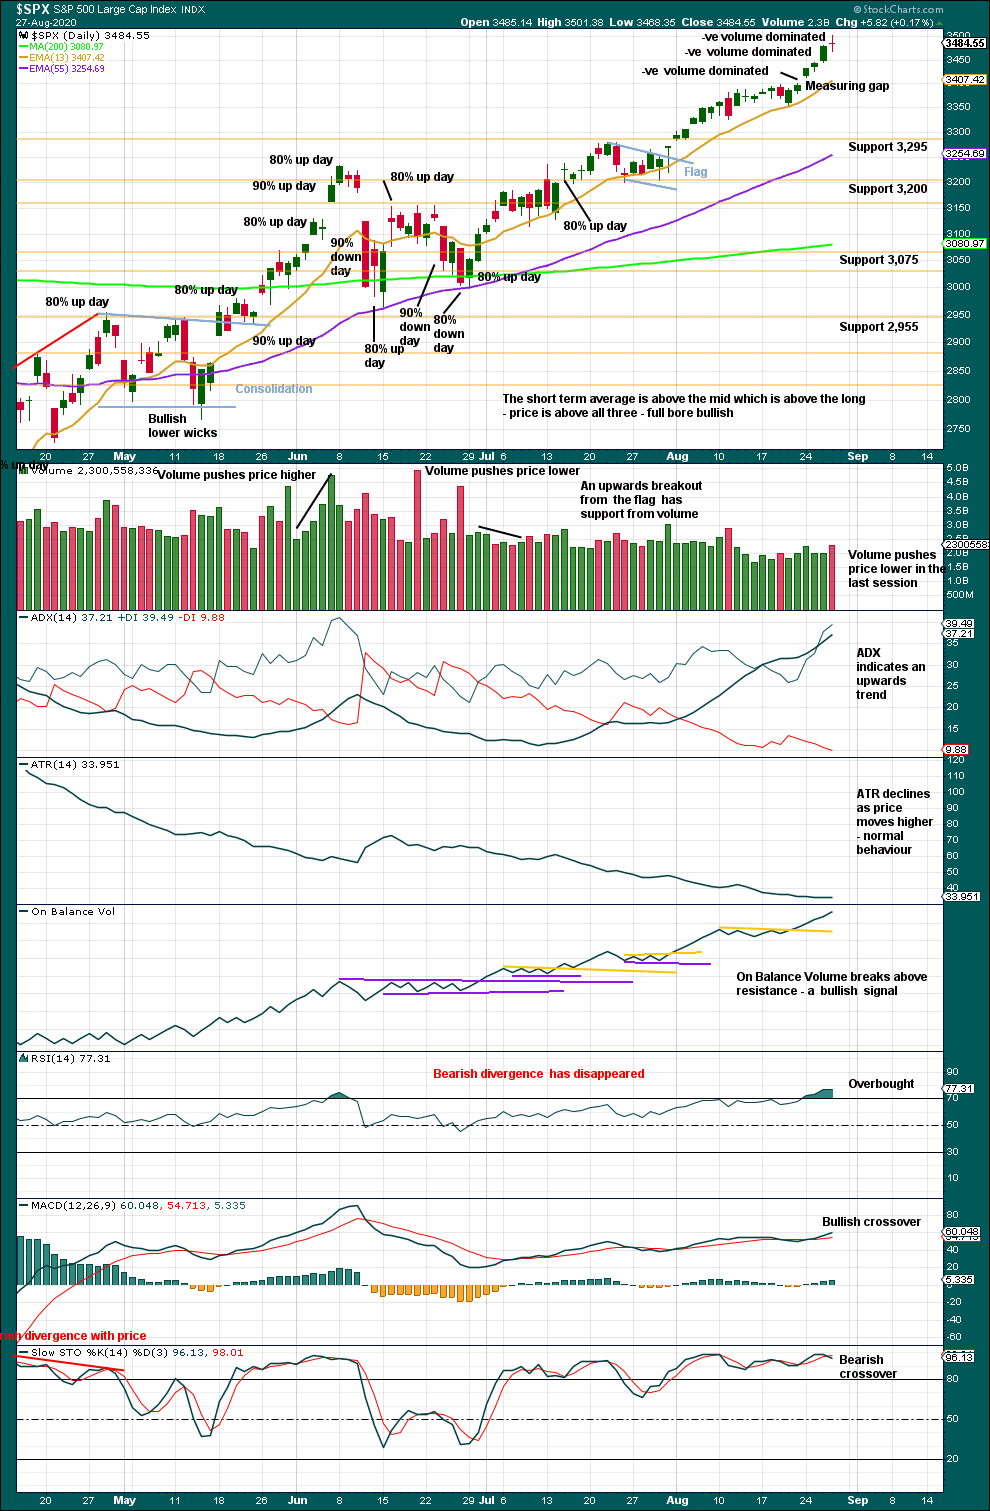
Click chart to enlarge. Chart courtesy of StockCharts.com.
Assume the trend remains the same, upwards, until proven otherwise.
However, bearish warnings are becoming louder. RSI is reaching more deeply overbought. 3 of the last 5 upwards days exhibit negative volume dominating total up / down volume. The upwards slope is increasing; a blow off top may possibly be forming. These are usually followed by sharp reversals. Risk of a sharp pullback or a trend change is increasing.
BREADTH – AD LINE
WEEKLY CHART
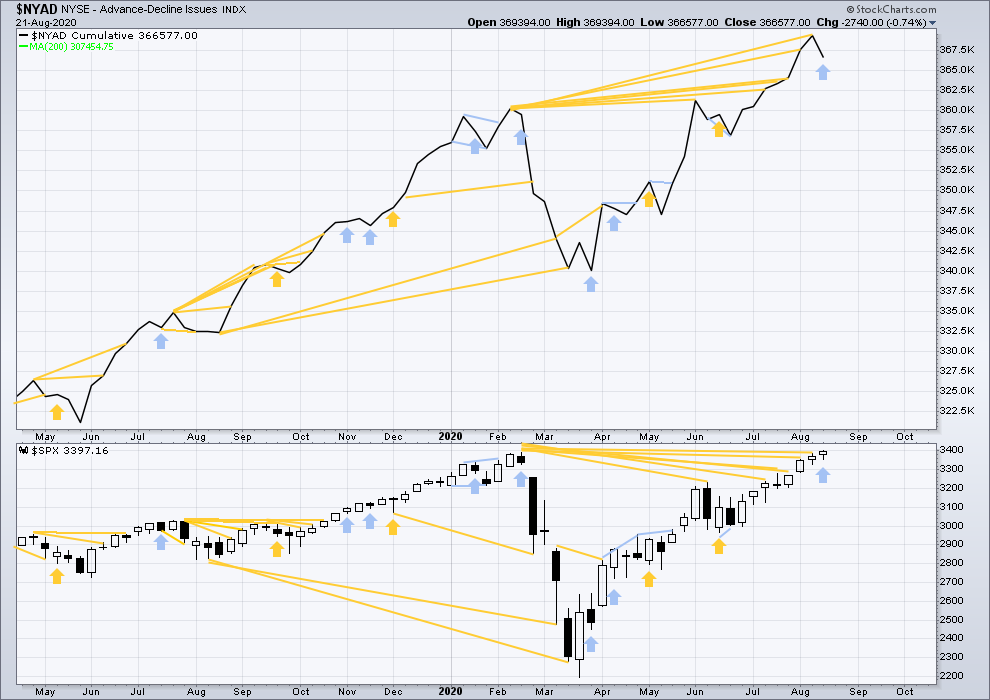
Click chart to enlarge. Chart courtesy of StockCharts.com. So that colour blind members are included, bearish signals will be noted with blue and bullish signals with yellow.
Breadth should be read as a leading indicator.
Lowry’s Operating Companies Only AD line has still not made new all time highs. The last high for the OCO AD line was in the week beginning January 13, 2020. There is now 7 months of bearish divergence between price and the OCO AD line. This may now support the more bearish second wave count. It is possible now that a major trend change may occur.
The NYSE All Issues AD line made new highs in the week beginning 1st of June.
Last week price has continued higher, but the AD line has declined. This is a single week instance of bearish divergence.
Large caps all time high: 3,501.38 on 27th August 2020.
Mid caps all time high: 2,109.43 on 20th February 2020.
Small caps all time high: 1,100.58 on 27th August 2018.
Last week only large caps made new all time highs. This rise is led by large caps, which is a feature of an aged bull market.
DAILY CHART
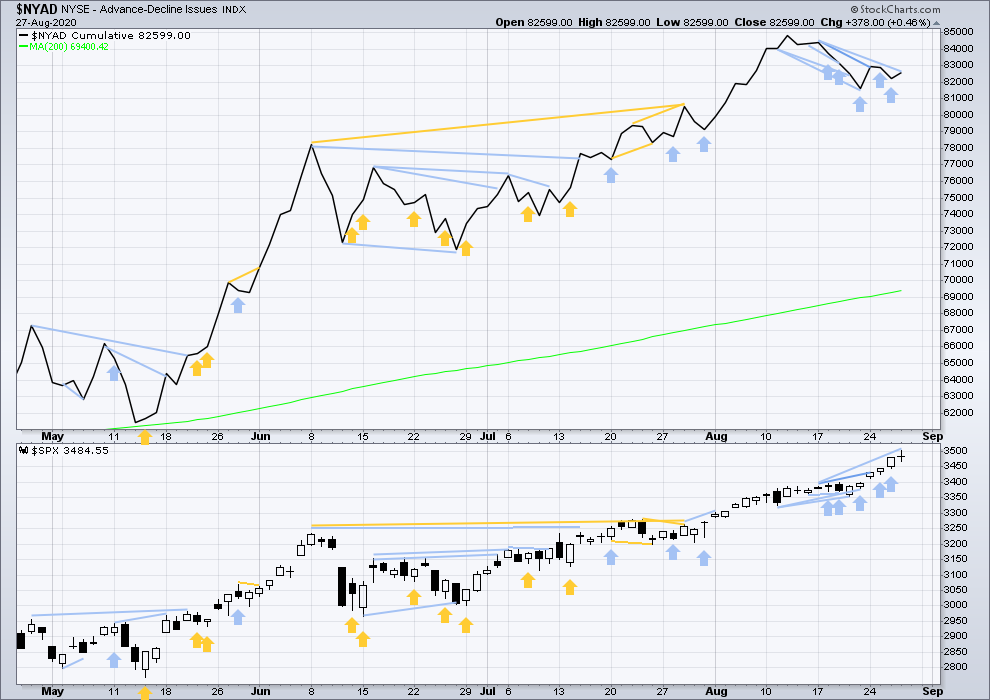
Click chart to enlarge. Chart courtesy of StockCharts.com. So that colour blind members are included, bearish signals will be noted with blue and bullish signals with yellow.
Today price has made another new all time high, but the AD line has not. This divergence is bearish.
There is an increasing cluster of bearish signals now from the AD line, a multi-week pullback may now be very close.
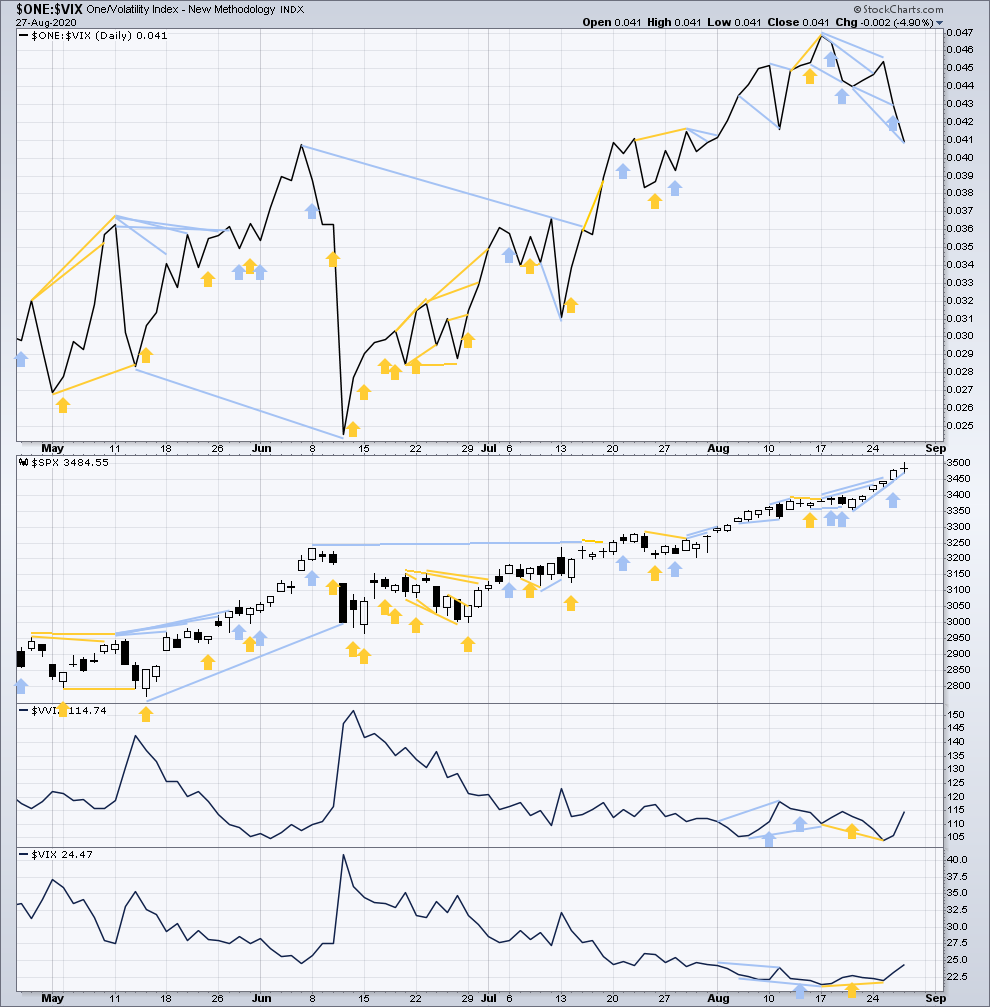
VOLATILITY – INVERTED VIX CHART
WEEKLY CHART
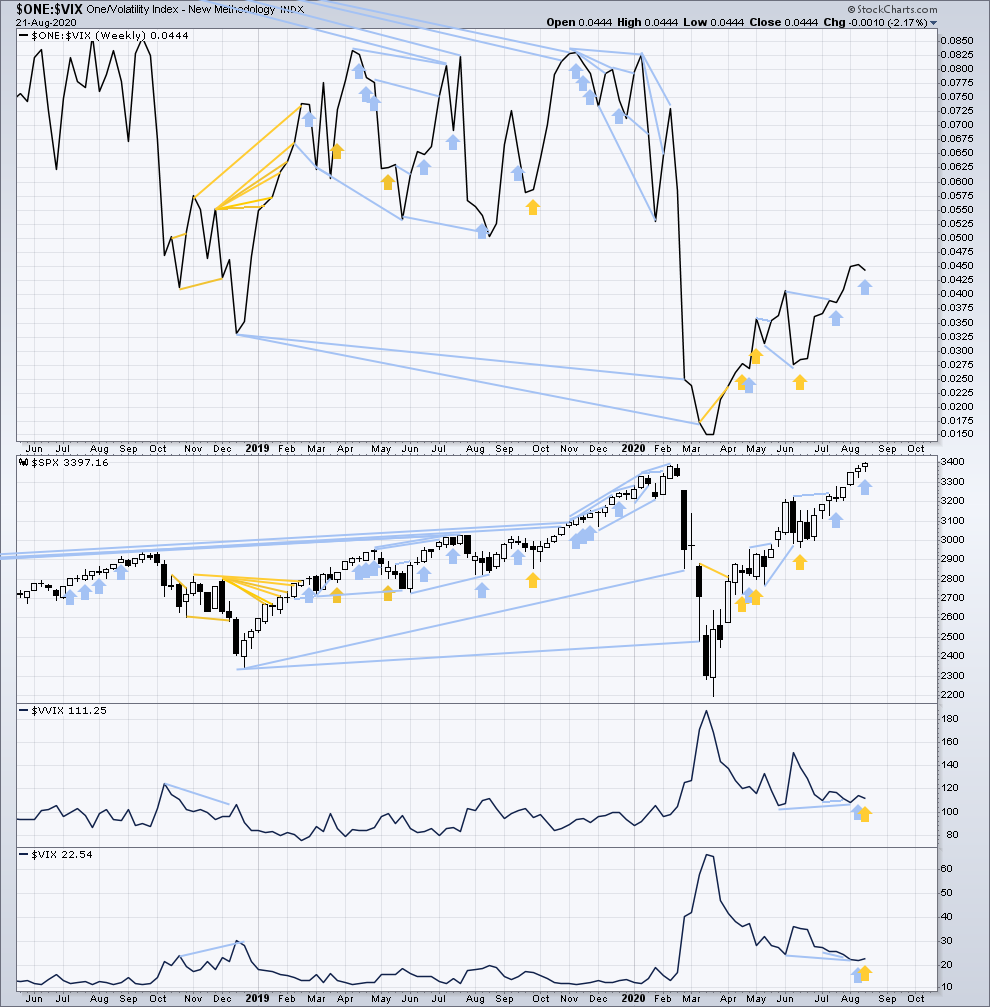
Click chart to enlarge. Chart courtesy of StockCharts.com. So that colour blind members are included, bearish signals will be noted with blue and bullish signals with yellow.
Inverted VIX remains well below all time highs. There remains over two years of strong bearish divergence between price and inverted VIX.
Last week price has moved higher, but inverted VIX has moved lower. This divergence is bearish.
Comparing VIX and VVIX: From weeks beginning 1st June to last week, VIX has made new lows as price has made new highs, but VVIX has failed to make corresponding new lows with VIX. VVIX remains slightly elevated. This divergence is not strong, but it is bearish for price.
Last week VIX has moved higher, but VVIX has moved lower. This divergence is bullish for price for the short term.
DAILY CHART
Click chart to enlarge. Chart courtesy of StockCharts.com. So that colour blind members are included, bearish signals will be noted with blue and bullish signals with yellow.
Again, today price has moved higher, but inverted VIX has moved lower. This rise in price does not come with a normal corresponding decline in VIX. VIX is increasing. This divergence is bearish for price. Inverted VIX has made another strong new short-term low, but price has not; this divergence is also bearish.
Comparing VIX and VVIX at the daily chart level: Both are moving higher. This is bearish for price.
DOW THEORY
Dow Theory still concludes a bear market is in place.
Dow Theory confirmed a bear market with the following lows made on a closing basis:
DJIA: 21,712.53 – a close below this point was been made on the March 12, 2020.
DJT: 8,636.79 – a close below this point was been made on March 9, 2020.
Adding in the S&P and Nasdaq for an extended Dow Theory, a bear market was confirmed:
S&P500: 2,346.58 – a close below this point was made on March 20, 2020.
Nasdaq: 7,292.22 – a close below this point was made on the March 12, 2020.
At this time, to shift Dow Theory from viewing a bear market to confirmation of a new bull market would require new highs made on a closing basis:
DJIA: 29,568.57
DJT: 11,623.58
Adding in the S&P and Nasdaq for an extended Dow Theory, confirmation of a bull market would require new highs made on a closing basis:
S&P500: 3,393.52 – closed above on 21st August 2020.
Nasdaq: 9,838.37 – closed above on June 8, 2020.
Published @ 06:25 p.m. ET
—
Careful risk management protects your trading account(s).
Follow my two Golden Rules:
1. Always trade with stops.
2. Risk only 1-5% of equity on any one trade.
—
New updates to this analysis are in bold.