
S&P 500: Elliott Wave and Technical Analysis | Charts – August 6, 2020
The first Elliott wave count expected upwards movement, which is what has happened again today.
Summary: There is an upwards trend in place. The final target is either for it to end prior to 3,432.15 (second wave count) or 3,640 (first wave count). A new all time high would add confidence in either of the first two wave counts.
Bearish wave counts remain valid while price remains below the all time high.
The biggest picture, Grand Super Cycle analysis, is here.
Monthly charts are here, with video here.
ELLIOTT WAVE COUNTS
FIRST WAVE COUNT
WEEKLY CHART
Click chart to enlarge.
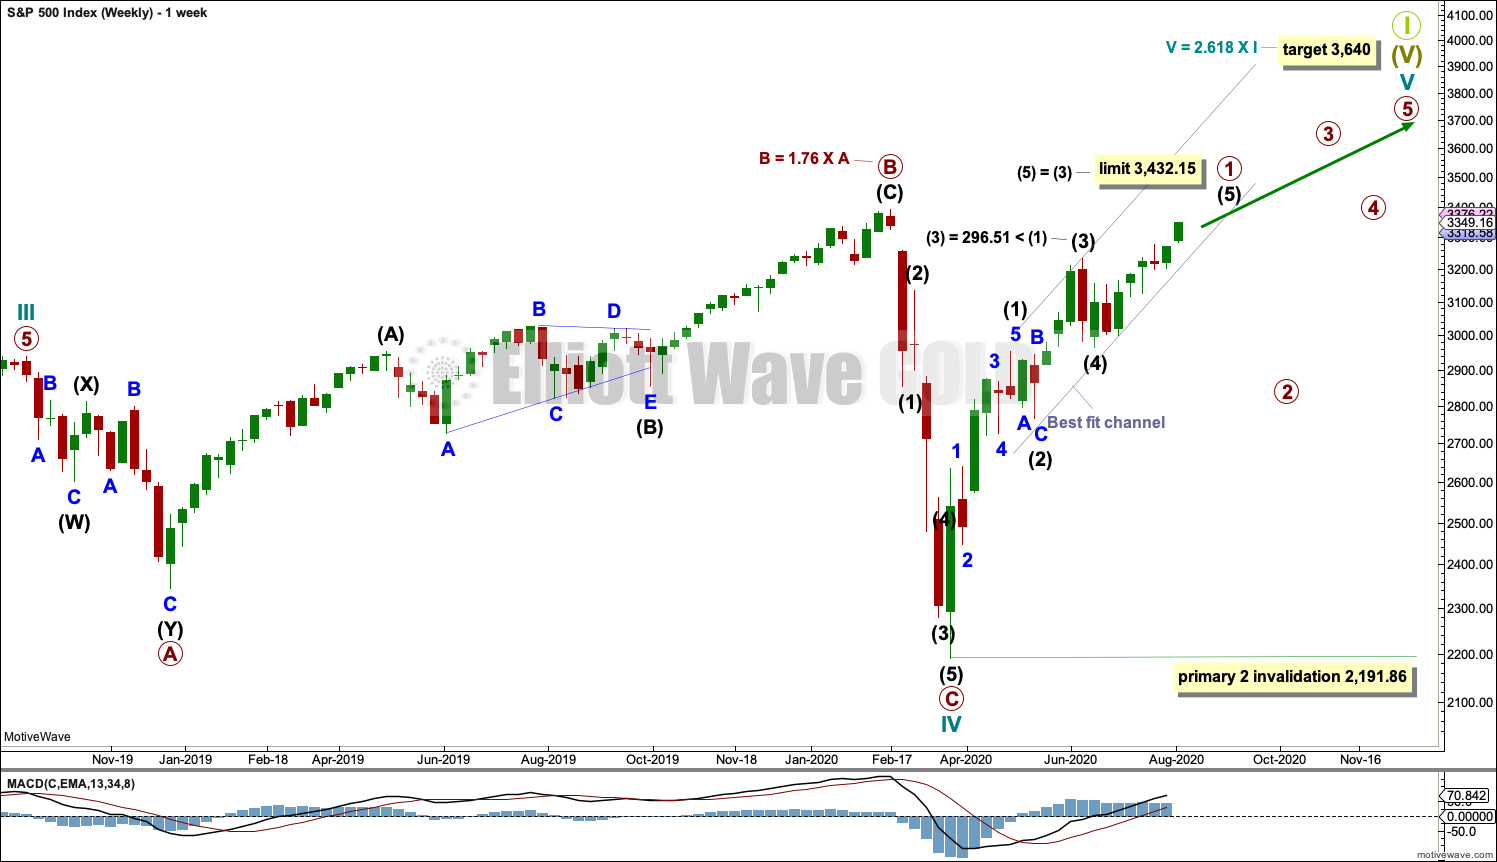
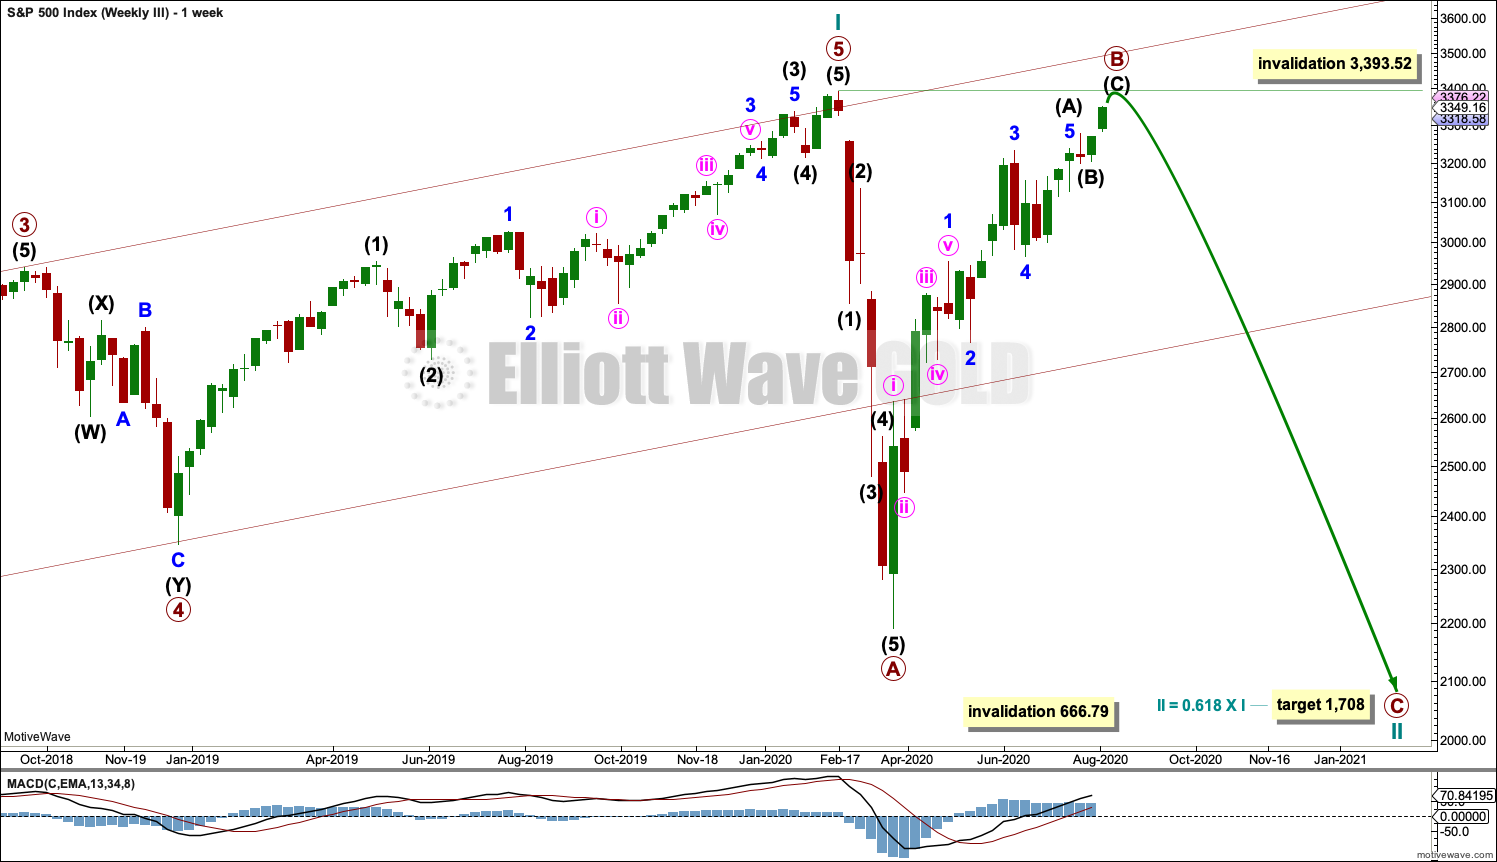
Confidence in this wave count may be had if price makes a new all time high above 3,393.52.
Cycle wave V may last from one to several years.
Cycle wave V may be underway and would most likely subdivide as an impulse. But if overlapping develops, then an ending diagonal should be considered. This chart considers the more common impulse.
Primary wave 1 may be nearing completion. Primary wave 2 may not move beyond the start of primary wave 1 below 2,191.86.
DAILY CHART
Click chart to enlarge.
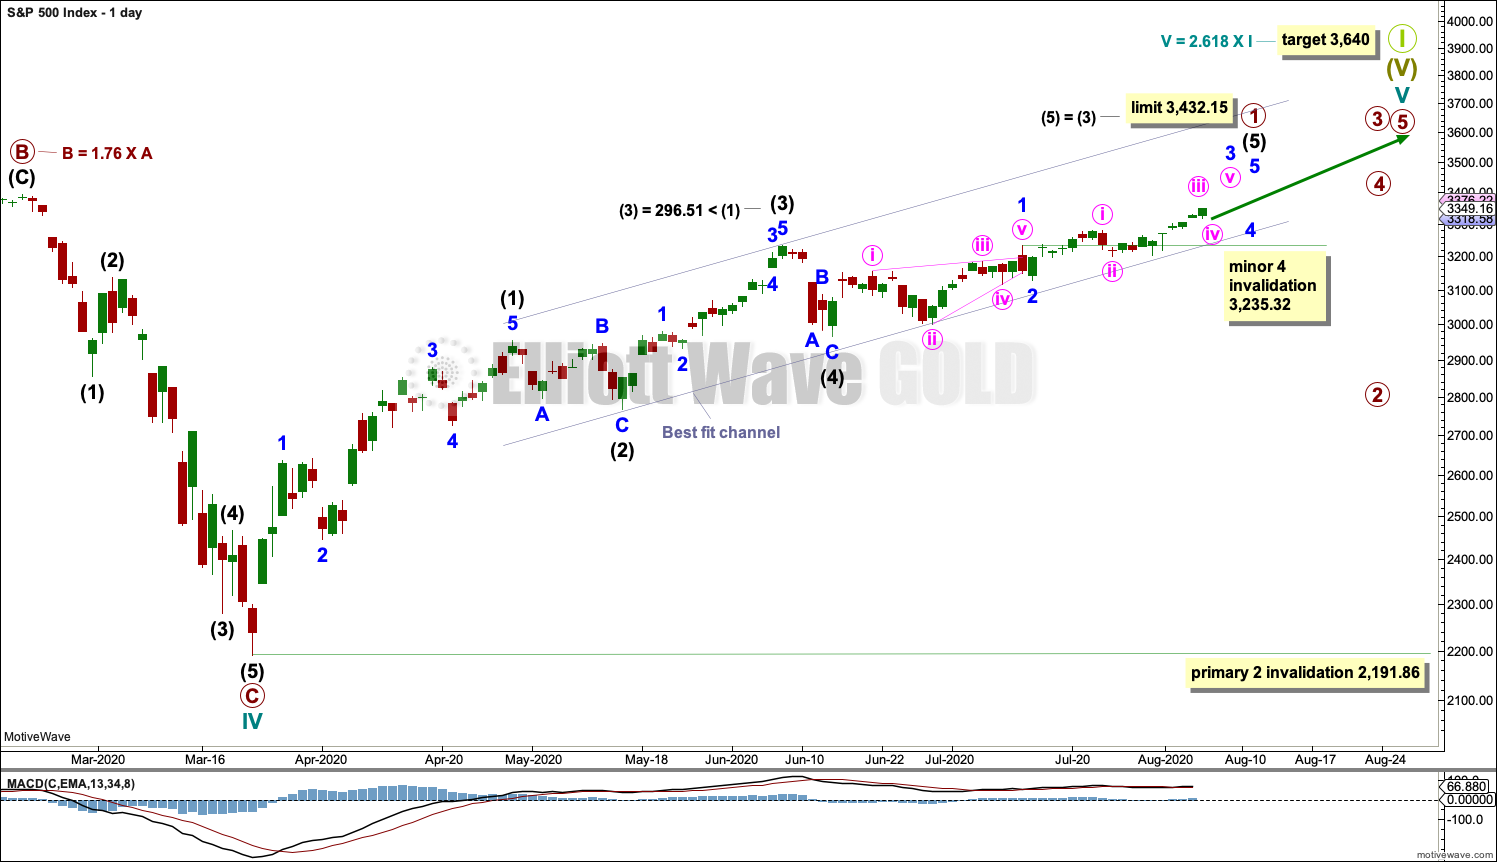
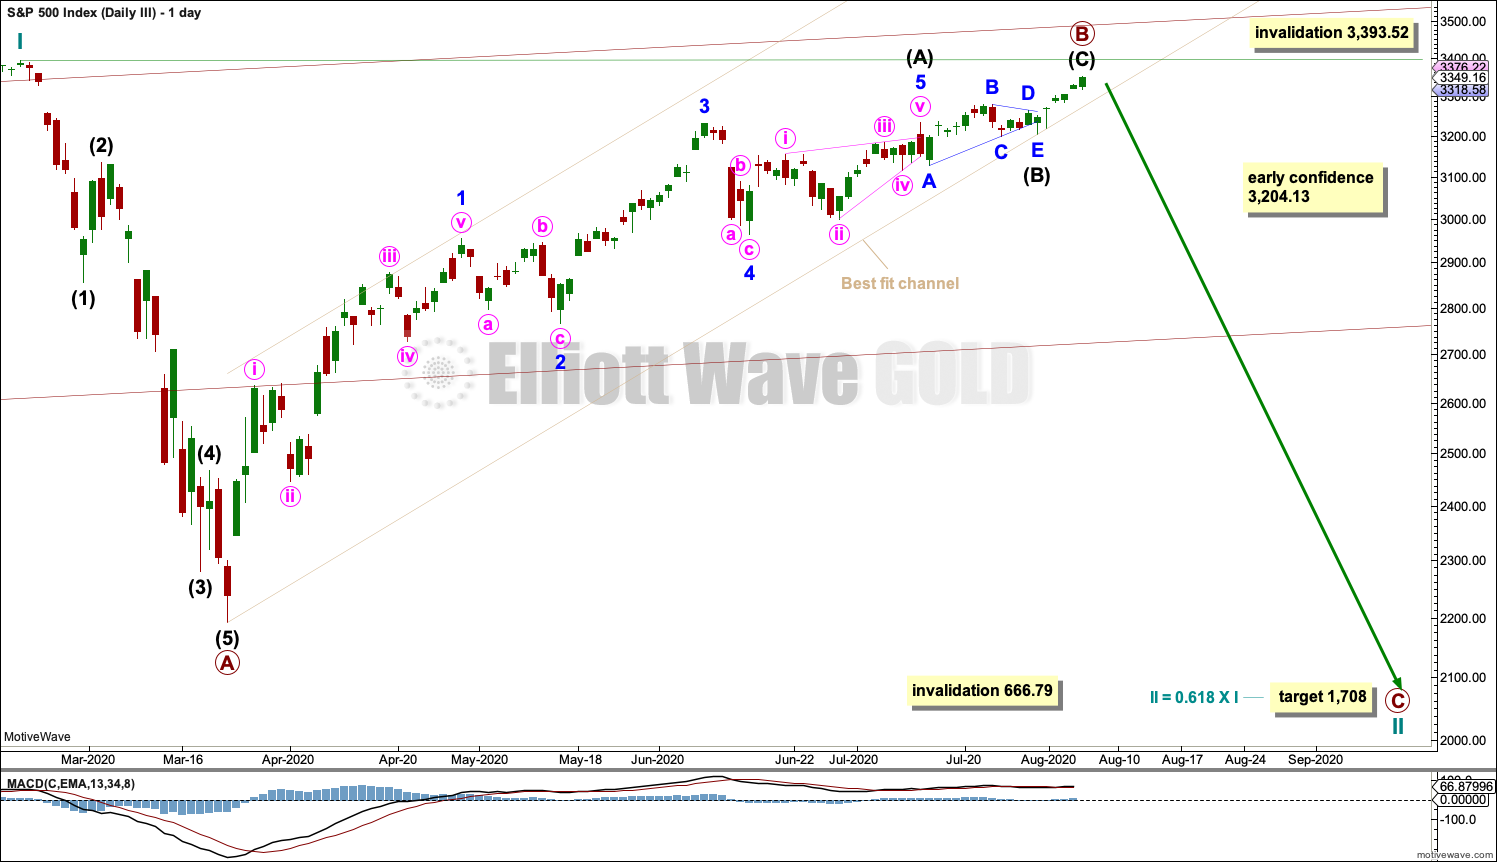
The target for the end of this bull market is provisional. It would best be calculated at primary degree, but that cannot be done until all of primary waves 1 through to 4 are complete. At that stage, the target will be recalculated and will very likely change.
Cycle wave V must subdivide as a five wave motive structure, most likely an impulse. Primary wave 1 within cycle wave V may be nearing completion.
Within primary wave 1: intermediate waves (1) through to (4) may be complete.
The channel drawn about primary wave 1 is a best fit. While intermediate wave (5) continues higher, along the way smaller corrections may find support about the lower edge of this channel. A breach of this channel at this stage may indicate an end to primary wave 1.
Intermediate wave (3) within primary wave 1 is shorter than intermediate wave (1). Because intermediate wave (3) may not be the shortest actionary wave, intermediate wave (5) is limited to no longer than equality in length with intermediate wave (3) at 3,432.15.
When primary wave 1 may be a complete five wave structure, then primary wave 2 should then unfold as a multi-week pullback and may not move beyond the start of primary wave 1 below 2,191.86.
HOURLY CHART
Click chart to enlarge.
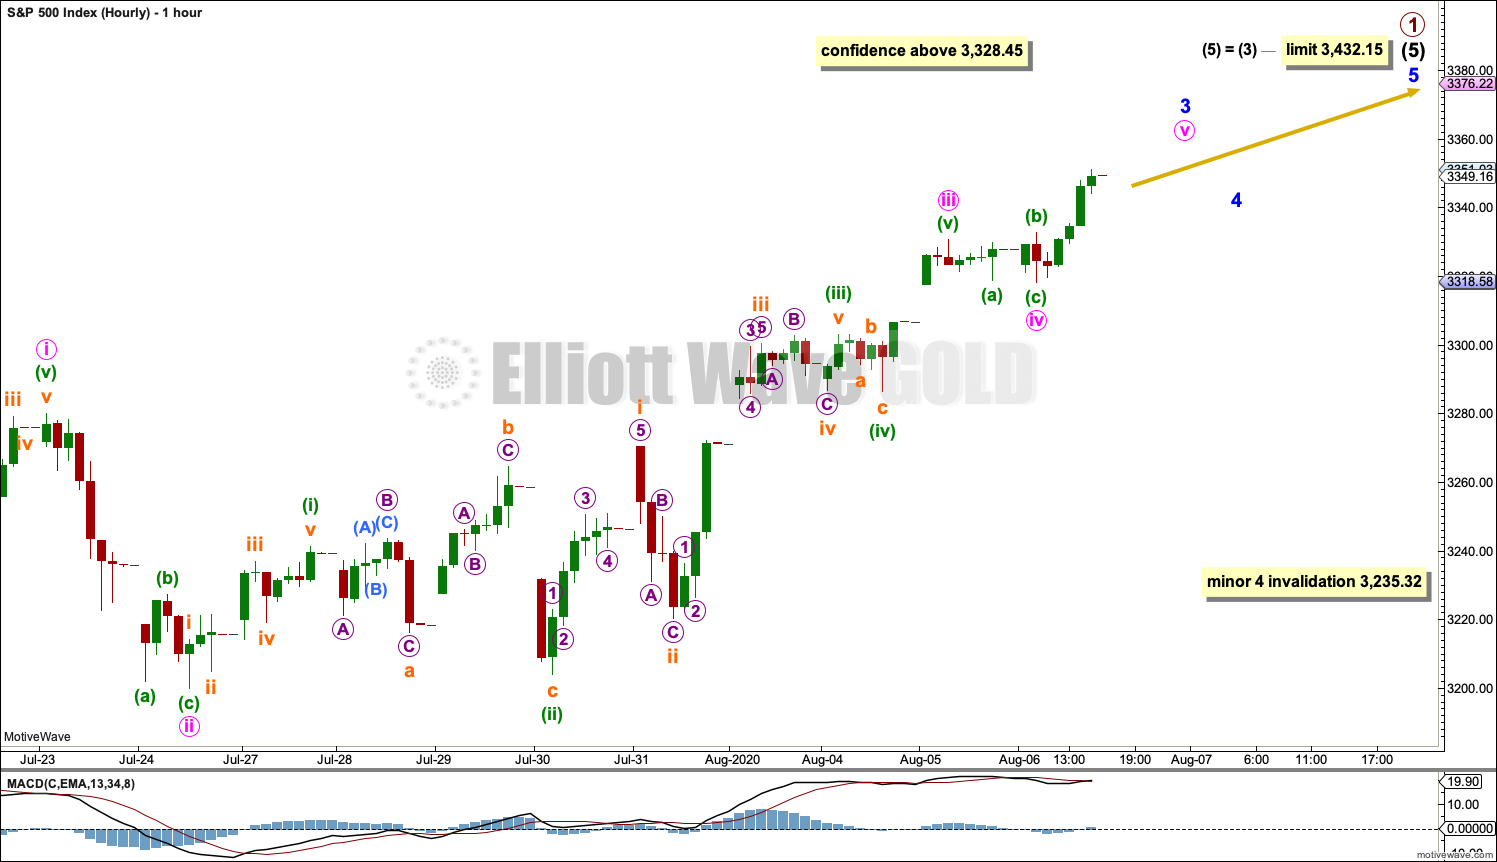
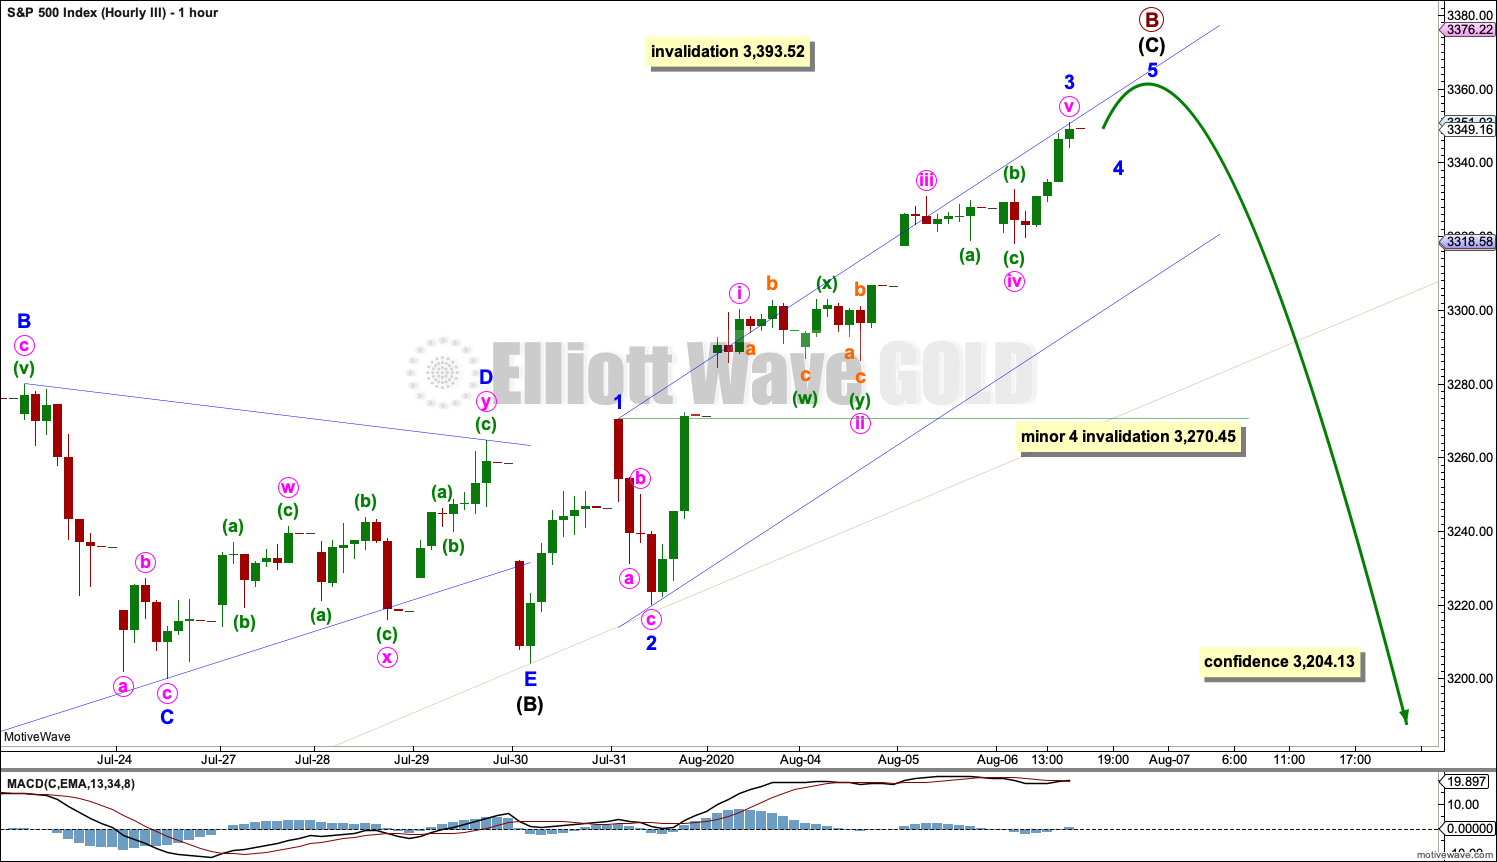
The hourly chart focusses on the middle of minor wave 3 from the end of minute waves i and ii within it.
This wave count now expects that minor wave 3 may have moved through the middle strongest portion. Minute wave iv may not move into minute wave i price territory below 3,279.99.
Minor wave 3 should exhibit strength.
SECOND WAVE COUNT
DAILY CHART
Click chart to enlarge.
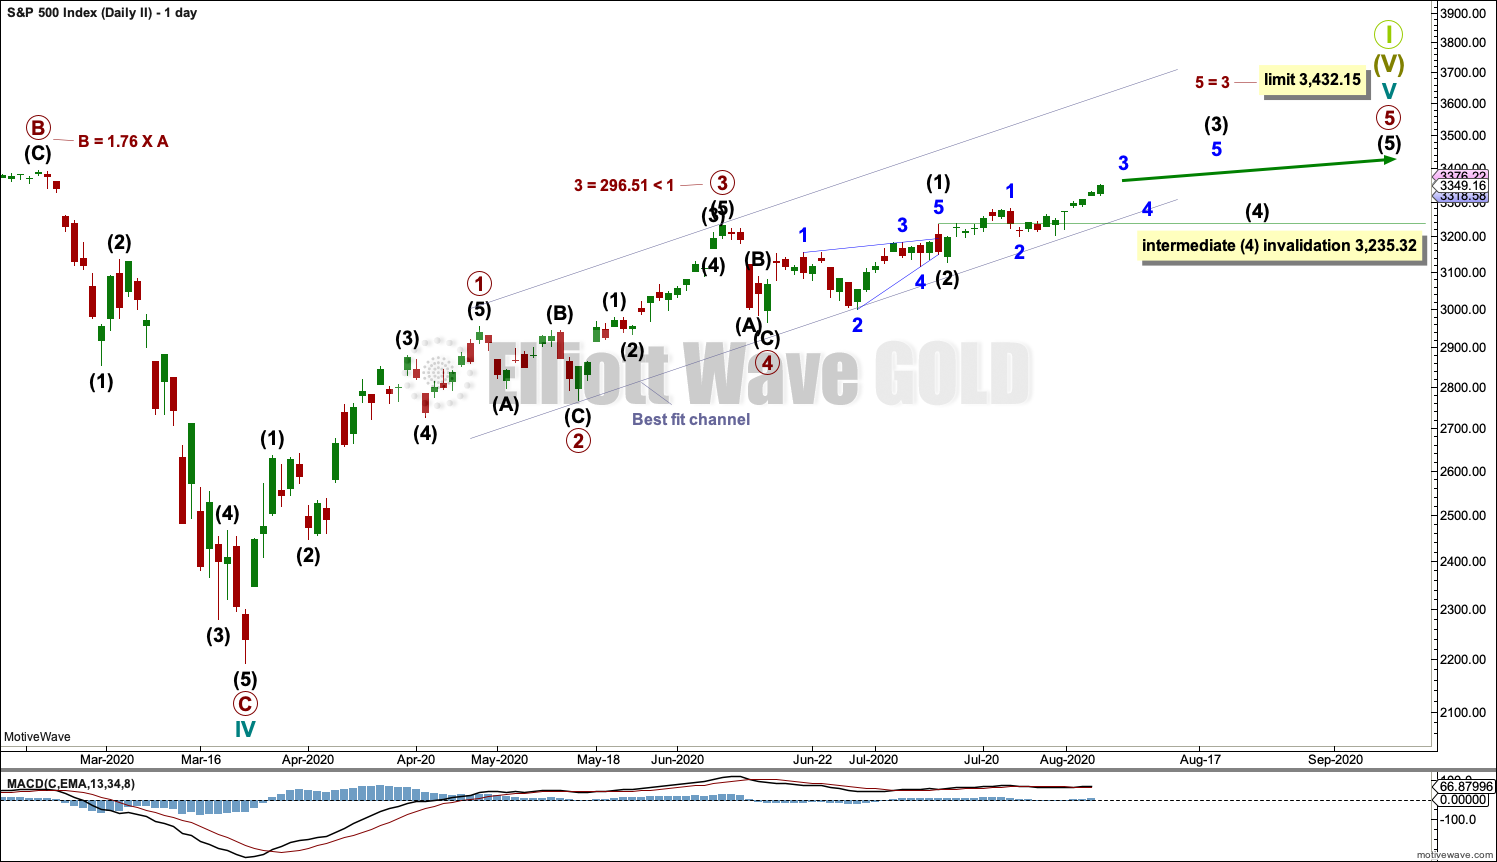
This wave count is the same as the first wave count with the exception of the degree of labelling within cycle wave V. If the degree of labelling is moved up one degree, then it is possible that cycle wave V to end Super cycle wave (V) to end Grand Super Cycle wave I is very close to completion.
Primary waves 1 through to 4 within cycle wave V may be complete. Primary wave 5 may end within another one to few months.
Cycle wave V would be very likely to make at least a slight new high above the end of cycle wave I at 3,393.52 to avoid a truncation.
Intermediate wave (4) may not move into intermediate wave (1) price territory below 3,235.32.
THIRD WAVE COUNT
WEEKLY CHART
Click chart to enlarge.
The probability of this wave count is reduced with closure of the gap created on the 24th of February.
Cycle wave II would most likely subdivide as a zigzag; thus far that looks like what is unfolding. Primary wave B may be now very close to completion. It may end this week or possibly next week. When primary wave B may again be complete, then a second target would again be calculated for primary wave C to end cycle wave II.
Cycle wave II may not move beyond the start of cycle wave I below 666.79.
DAILY CHART
Click chart to enlarge.
Draw the wide maroon trend channel carefully: draw the first trend line from the end of primary wave 1 at 2,093.55 (December 26, 2014), to the end of primary wave 3 at 2,940.91 (September 21, 2018), then place a parallel copy on the end of primary wave 2 at 1,810.10 (February 11, 2016). The channel was fully breached in March 2020 indicating a trend change from the multi-year bull trend to a new bear trend. During the next downwards wave this line may offer some support.
Cycle wave II may subdivide as any Elliott wave corrective structure except a triangle. It would most likely be a zigzag (zigzags subdivide 5-3-5).
Minor wave A may have ended on the 13th of July with an ending contracting diagonal for minor wave 5, followed by a running contracting triangle for intermediate wave (B).
Primary wave B may now be an incomplete single zigzag.
If primary wave A is correctly labelled as a five wave impulse, then primary wave B may not move beyond the start of primary wave A above 3,393.52.
HOURLY CHART
Click chart to enlarge.
Intermediate wave (C) must subdivide as a five wave motive structure, most likely an impulse.
Minor waves 1 through to 4 within the impulse of intermediate wave (C) may now be complete. On the five minute chart, minor wave 5 may need only one more small upwards wave to complete it. Intermediate wave (C) may be over now.
A new low now below the start of intermediate wave (C) at 3,204.13 could not be a second wave correction within intermediate wave (C), so at that stage intermediate wave (C) would have to be over. A new low below 3,204.13 would provide some confidence that a high may be in place.
FOURTH WAVE COUNT
WEEKLY CHART
Click chart to enlarge.
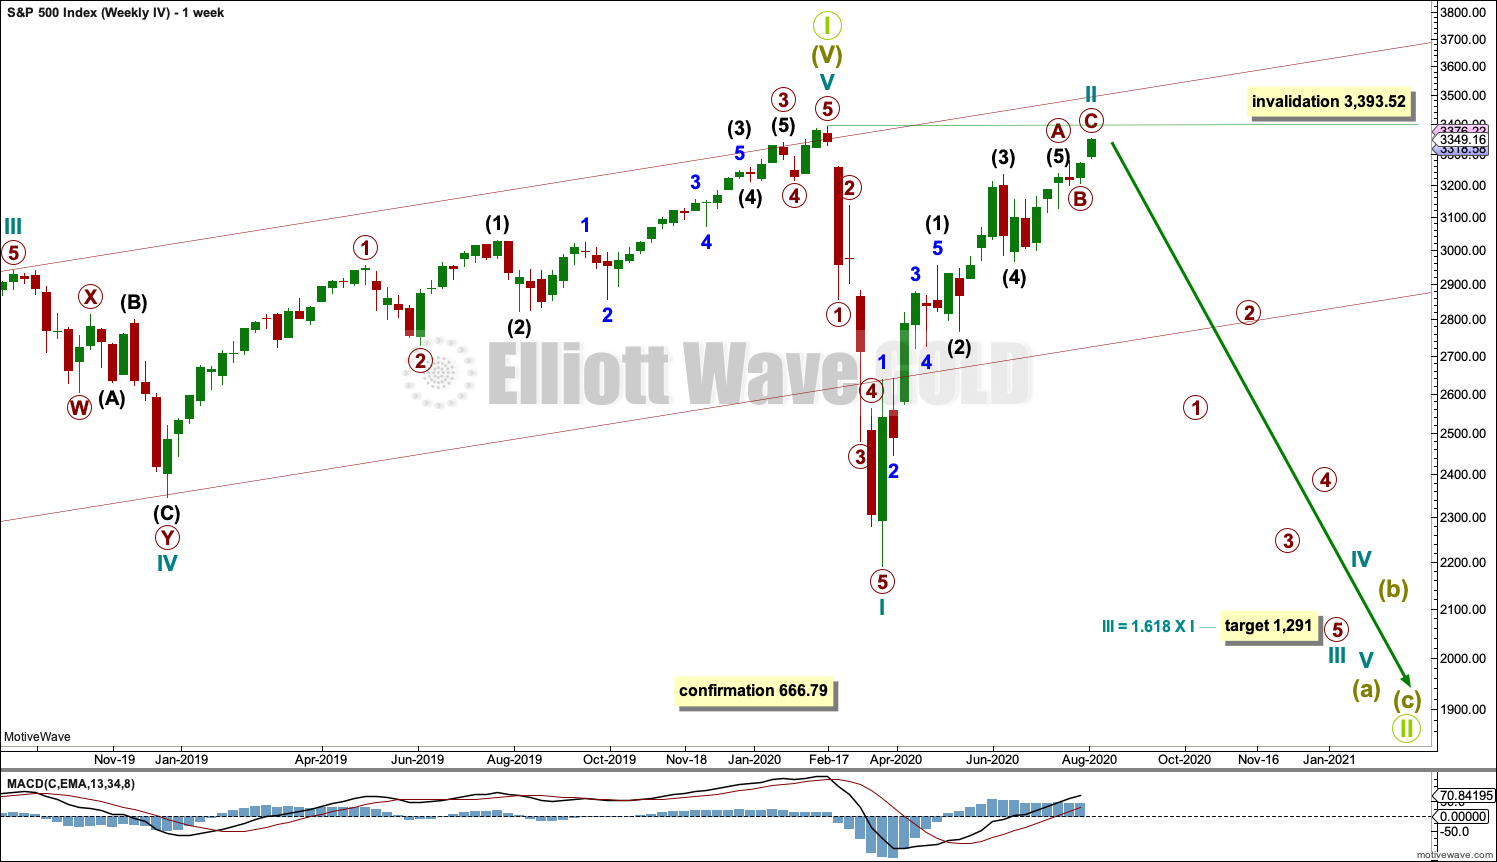
By simply moving the degree of labelling in the bull market beginning March 2009 up one degree, it is possible that a Grand Super Cycle trend change occurred on February 19, 2020. The bull market from March 2009 to February 2020 may have been a complete fifth wave labelled Super Cycle wave (V).
A bear market at Grand Super Cycle degree may be expected to last at least a decade, possibly longer. Corrections for this market tend to be much quicker than bullish moves, and so a fair amount of flexibility is required in expectations for duration of the different degrees.
Grand Super Cycle II would most likely subdivide as a zigzag, although it may be any corrective structure except a triangle. It should begin with a five down at the weekly chart time frame, which would be incomplete.
The first wave down on the daily chart is labelled cycle wave I. If this degree of labelling is wrong, it may be too high; it may need to be moved down one degree.
Following cycle wave I, cycle wave II may be an incomplete single zigzag.
If it continues any higher, then cycle wave II may not move beyond the start of cycle wave I above 3,393.52.
TECHNICAL ANALYSIS
WEEKLY CHART
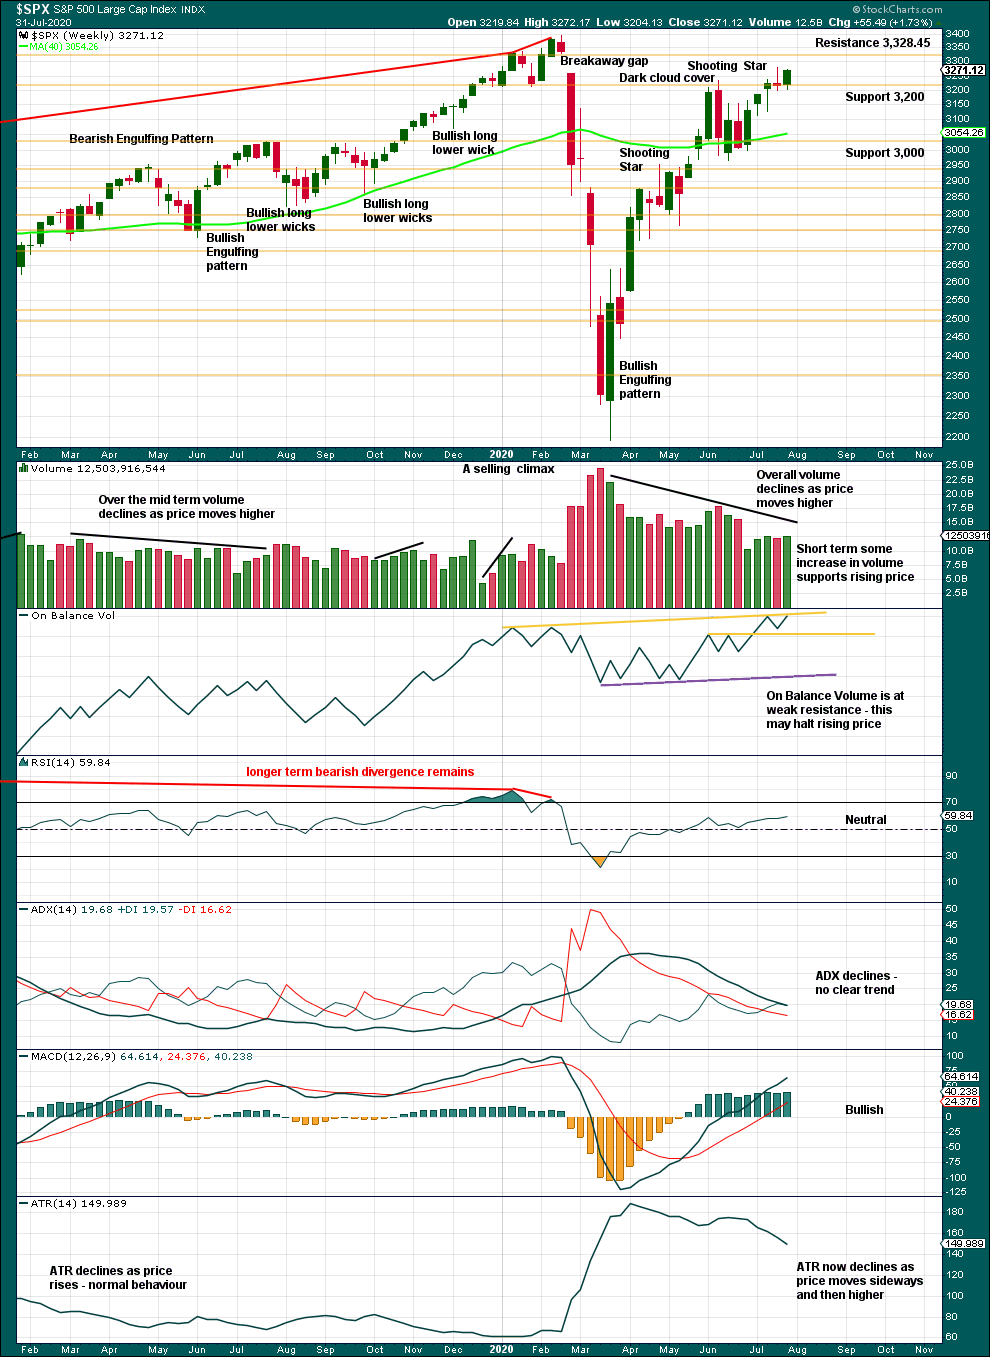
Click chart to enlarge. Chart courtesy of StockCharts.com.
An inside week completes with some increase in volume for upwards movement within it. This is bullish at least for the short term. There is no bearish reversal pattern.
DAILY CHART
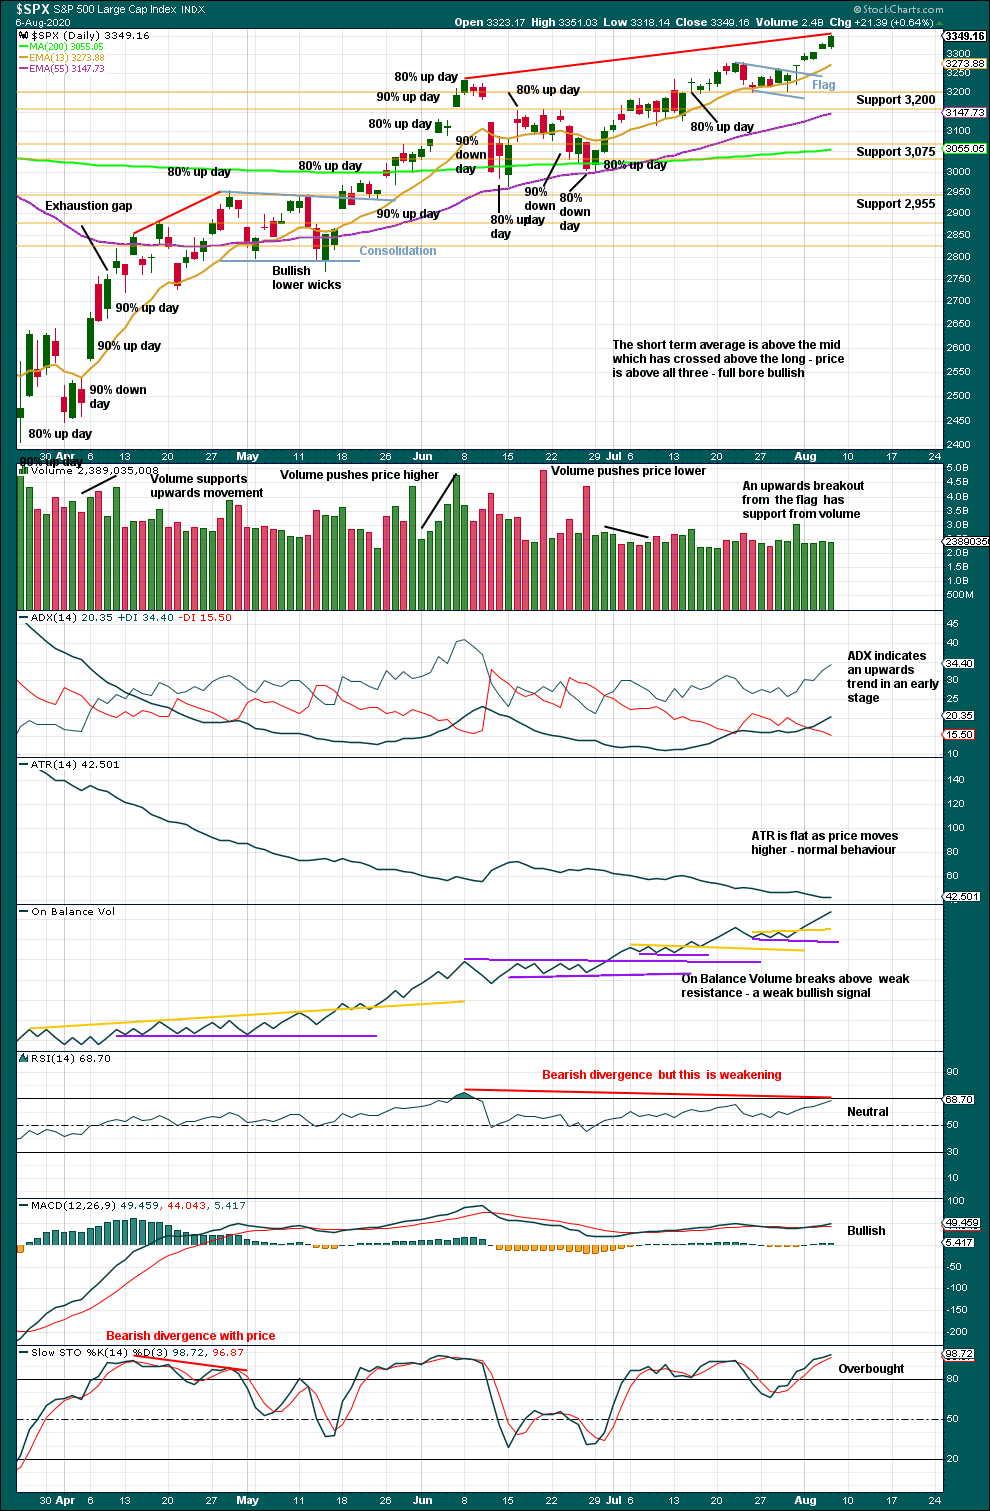
Click chart to enlarge. Chart courtesy of StockCharts.com.
The breakaway gap of 24th February has its upper edge at 3,328.45. This gap is now closed. A more bullish analysis expecting new all time highs has now increased in probability.
Friday completed an upwards breakout from a small flag pattern that has support from volume. A target from the flag pole would be at 3,405. This supports the first Elliott wave count.
Double bearish divergence between price and RSI has weakened to only now single bearish divergence.
Volume is light, but this has long been a characteristic of this market since 2009; price has been able to rise on light and declining volume for many years now. RSI and ADX are not extreme; there is room for upwards movement to continue.
Down volume dominated during this last session for 6th of August with 55% of total up/down volume. This session was weak. This is bearish for the short term.
BREADTH – AD LINE
WEEKLY CHART
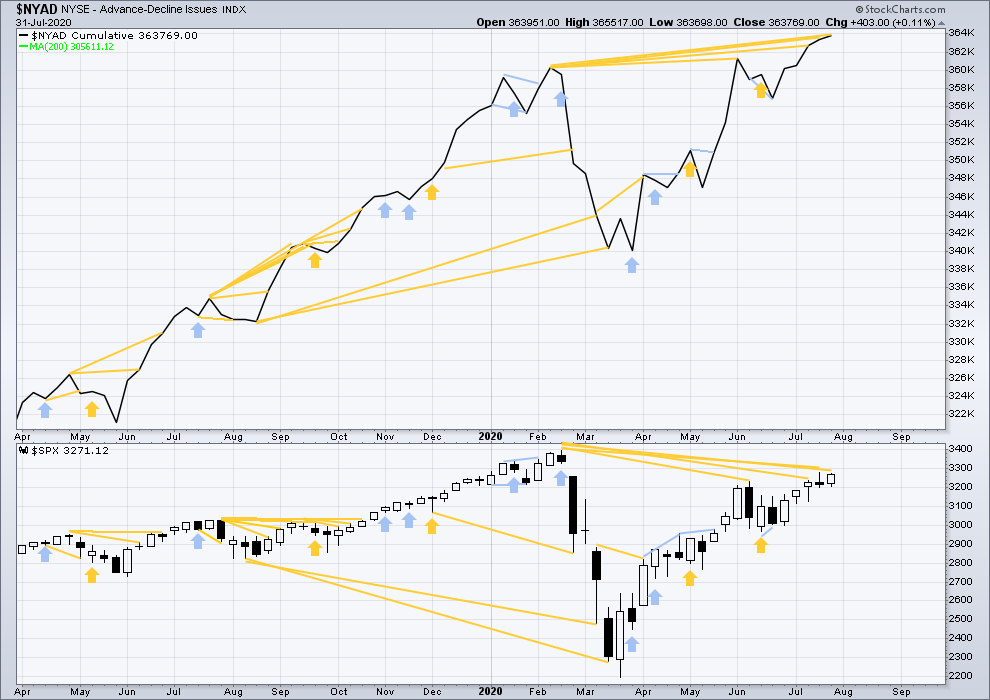
Click chart to enlarge. Chart courtesy of StockCharts.com. So that colour blind members are included, bearish signals will be noted with blue and bullish signals with yellow.
Breadth should be read as a leading indicator.
Last week the NYSE all issues AD line has made another new all time high, although Lowry’s Operating Companies Only AD line still has not. This divergence is bullish and noted on this chart, but failure of the OCO AD line to confirm this divergence reduces the strength of the signal.
Large caps all time high: 3,393.52 on 19th February 2020.
Mid caps all time high: 2,109.43 on 20th February 2020.
Small caps all time high: 1,100.58 on 27th August 2018.
It is still only large caps that have made new swing highs above the prior high of the 8th of June. Small and mid caps have not. The rise over the last several weeks is led by large caps, so it lacks breadth. This is normal of an aged bullish move and supports the third or fourth Elliott wave counts.
DAILY CHART
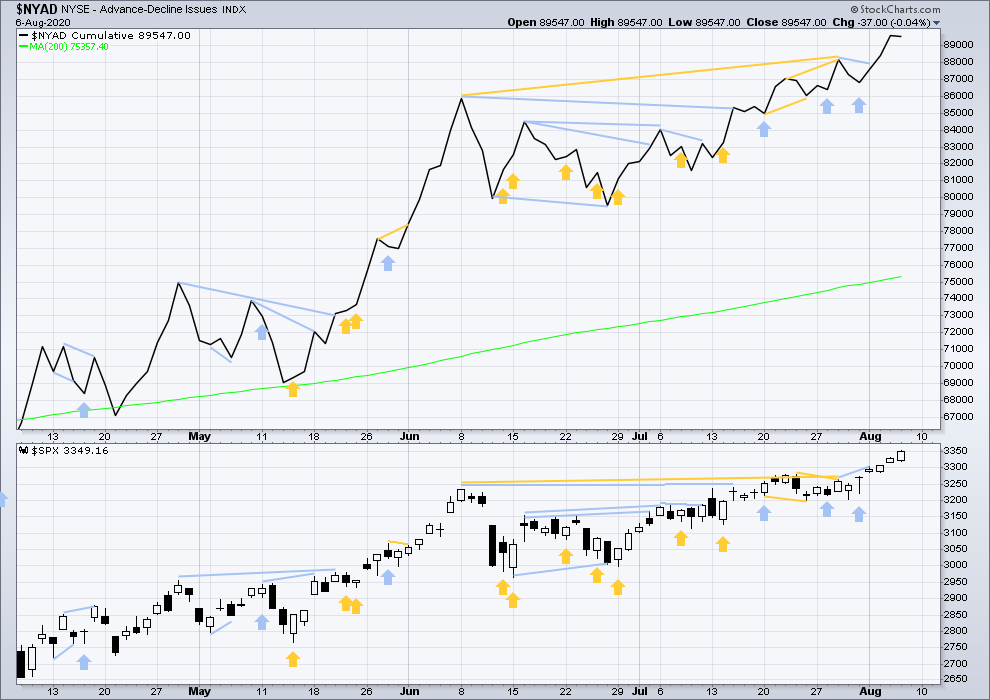
Click chart to enlarge. Chart courtesy of StockCharts.com. So that colour blind members are included, bearish signals will be noted with blue and bullish signals with yellow.
Today price has moved higher and the AD line has moved very slightly higher. There is no new divergence, but breadth for this session was weak and driven by a few large caps. Small caps declined.
VOLATILITY – INVERTED VIX CHART
WEEKLY CHART
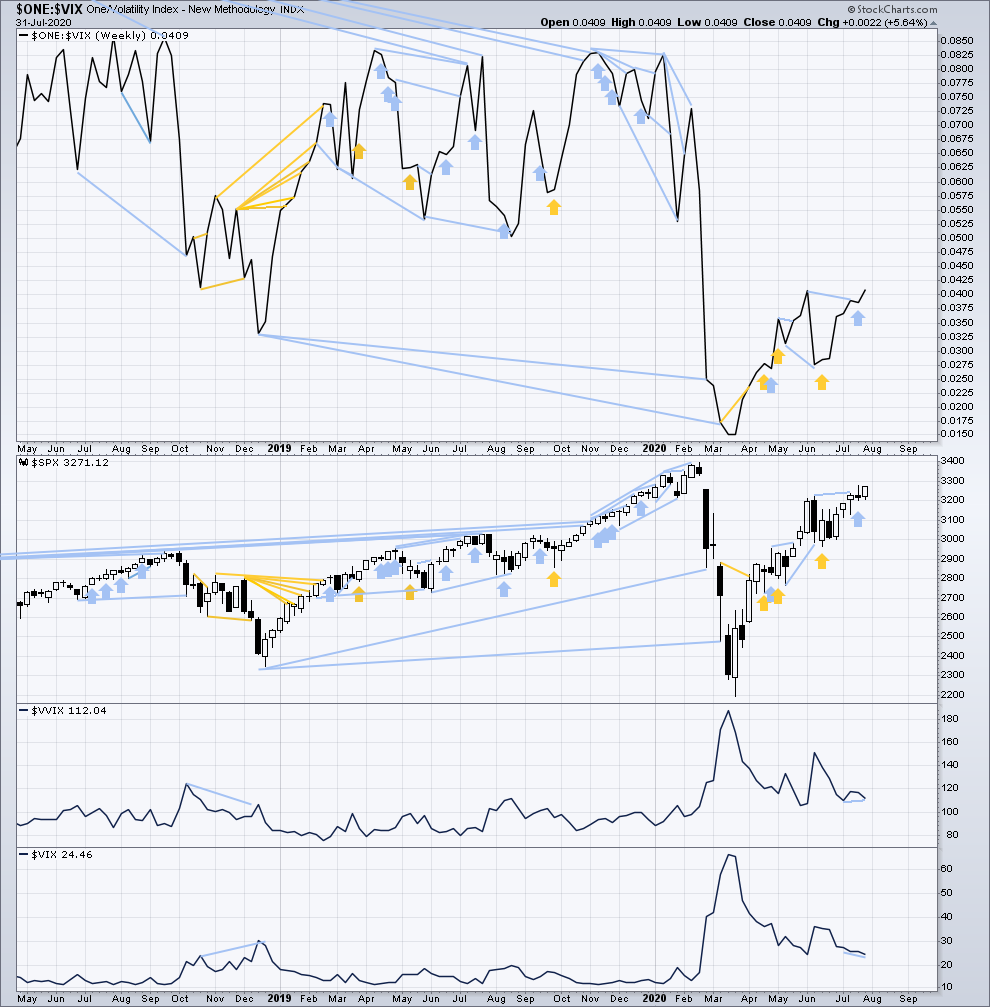
Click chart to enlarge. Chart courtesy of StockCharts.com. So that colour blind members are included, bearish signals will be noted with blue and bullish signals with yellow.
Inverted VIX remains well below all time highs. There remains over two years of strong bearish divergence between price and inverted VIX.
Last week both price and inverted VIX have moved higher. There is no new divergence.
Comparing VIX and VVIX: For the very short term, from weeks beginning 6th to 27th July, price has moved higher and VIX has declined; this is normal. But VVIX has not made a new short-term low and remains slightly elevated. This divergence is bearish for the short term.
DAILY CHART
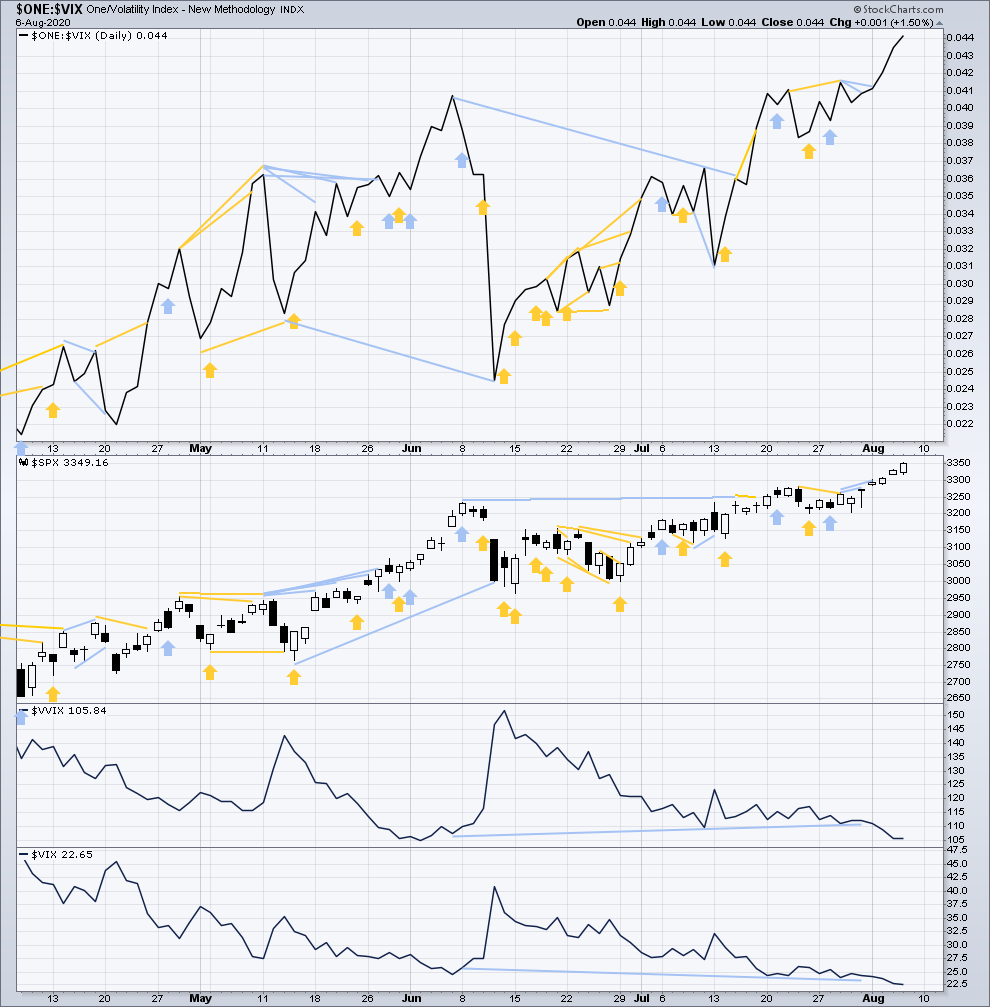
Click chart to enlarge. Chart courtesy of StockCharts.com. So that colour blind members are included, bearish signals will be noted with blue and bullish signals with yellow.
Today both price and inverted VIX have made new short-term highs. There is no new divergence.
DOW THEORY
Dow Theory has confirmed a bear market with the following lows made on a closing basis:
DJIA: 21,712.53 – a close below this point has been made on the March 12, 2020.
DJT: 8,636.79 – a close below this point has been made on March 9, 2020.
Adding in the S&P and Nasdaq for an extended Dow Theory, a bear market has now been confirmed:
S&P500: 2,346.58 – a close below this point has now been made on March 20, 2020.
Nasdaq: 7,292.22 – a close below this point was made on the March 12, 2020.
At this time, to shift Dow Theory from viewing a bear market to confirmation of a new bull market would require new highs made on a closing basis:
DJIA – 29,568.57
DJT – 11,623.58
Adding in the S&P and Nasdaq for an extended Dow Theory:
S&P500 – 3,393.52
Nasdaq – 9,838.37 – closed above on June 8, 2020.
Additionally, neither of DJIA nor DJT have made new swing highs above the prior highs of 8th of June. Only S&P500 and Nasdaq have made mid-term swing highs.
Published @ 08:37 p.m. ET
—
Careful risk management protects your trading account(s).
Follow my two Golden Rules:
1. Always trade with stops.
2. Risk only 1-5% of equity on any one trade.
—
New updates to this analysis are in bold.