
S&P 500: Elliott Wave and Technical Analysis | Charts – June 22, 2020
Summary: The bounce may be over. Downwards movement may resume. A mid-term target is at 2,723.
For the long term, a sustainable high may now be in place on June 8th. The main wave count has two final targets at 2,031 and 1,708. The daily alternate wave count has a target at 1,289 for a third wave down.
A new low below 2,954.86 would invalidate the third alternate wave count and provide confidence in downwards targets.
The third alternate wave count outlines a bullish scenario. A new high above 3,233.13 would be required for confidence in this wave count.
The biggest picture, Grand Super Cycle analysis, is here.
Last monthly charts are here. Video is here.
ELLIOTT WAVE COUNTS
MAIN WEEKLY CHART
Click chart to enlarge.
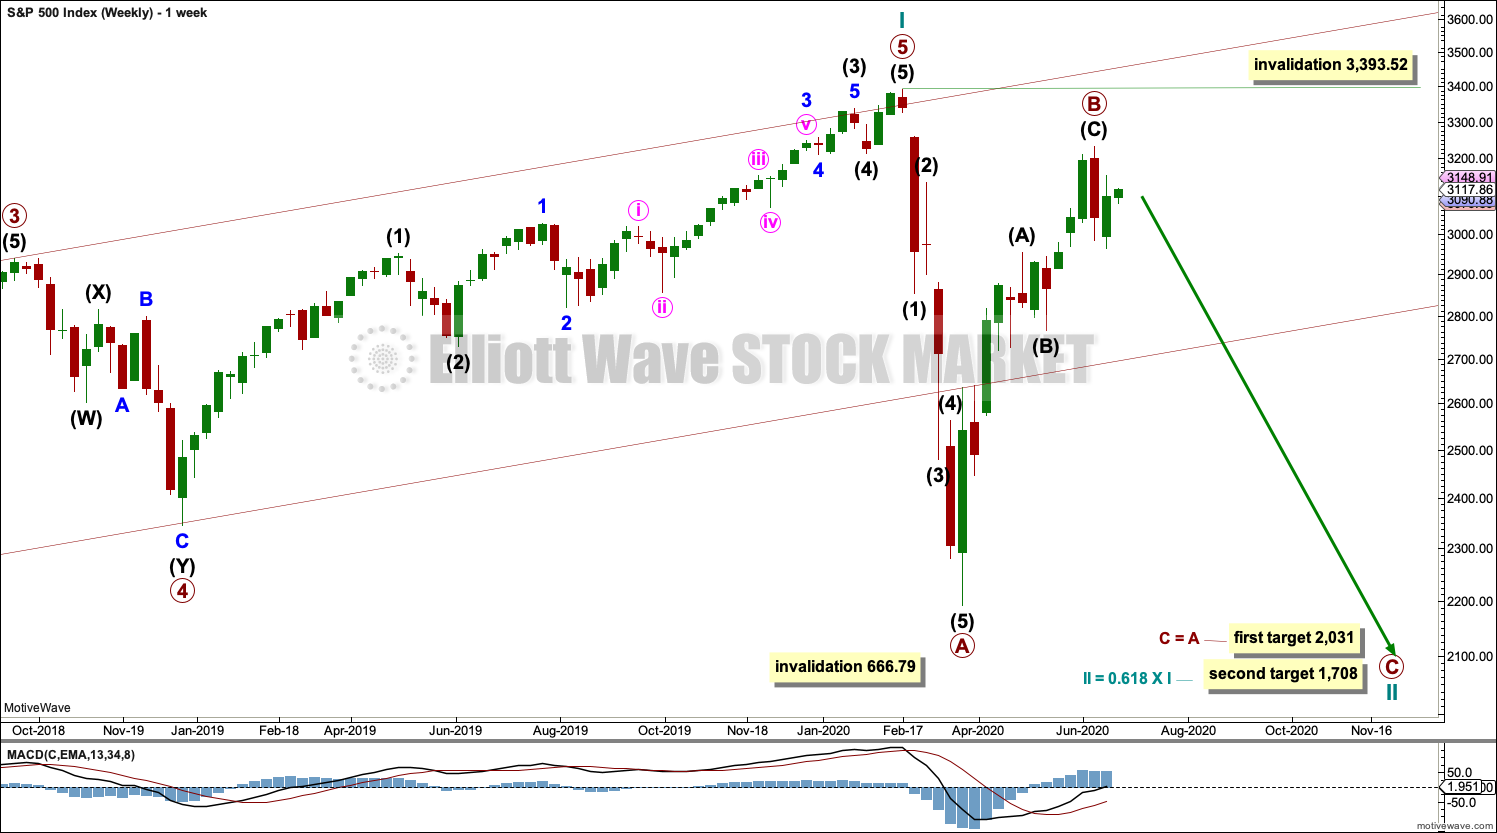
This main Elliott wave count expects that the bull market beginning in March 2009 was cycle wave I of Super Cycle wave (V). The trend change in February 2020 may have been only at cycle degree. Cycle wave II may last from one to a few years.
Cycle wave II would most likely subdivide as a zigzag; thus far that looks like what is unfolding. Primary waves A and B may both be complete. A second target is calculated at primary degree.
Cycle wave II may not move beyond the start of cycle wave I below 666.79.
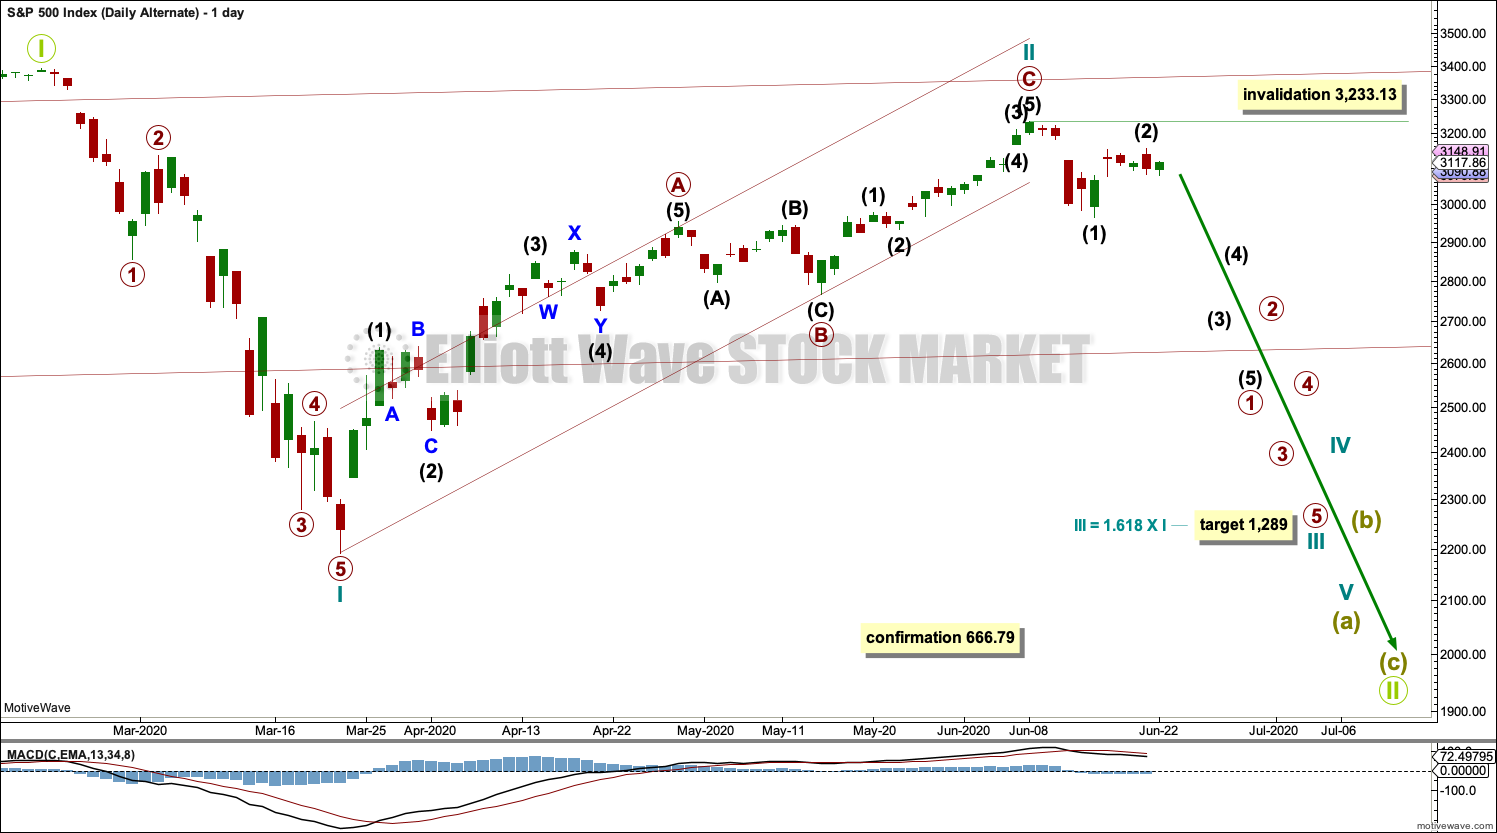
MAIN DAILY CHART
Click chart to enlarge.
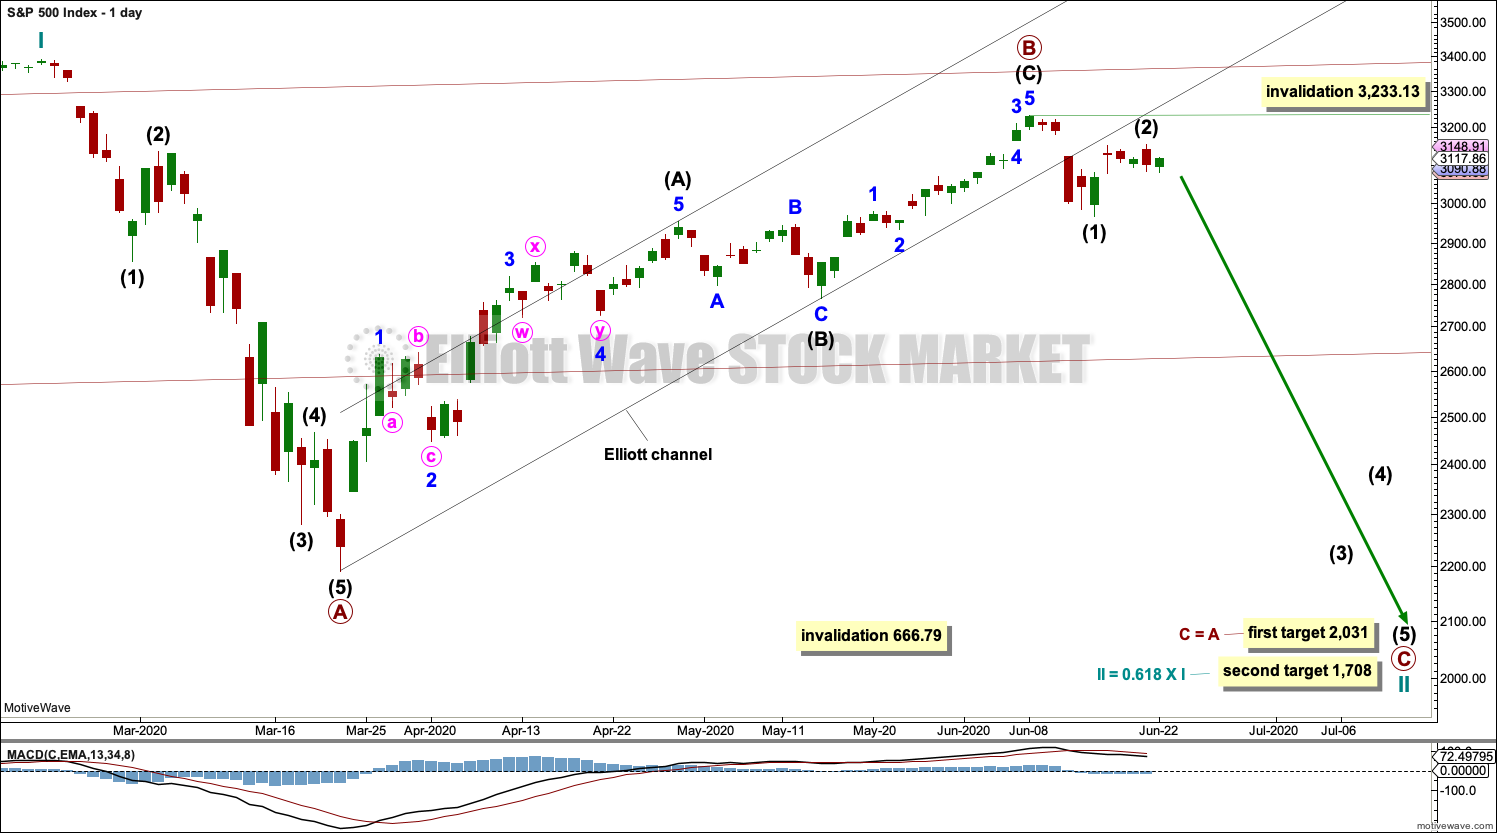
Draw the wide maroon trend channel carefully: draw the first trend line from the end of primary wave 1 at 2,093.55 (December 26, 2014), to the end of primary wave 3 at 2,940.91 (September 21, 2018), then place a parallel copy on the end of primary wave 2 at 1,810.10 (February 11, 2016). The channel is fully breached indicating a trend change from the multi-year bull trend to a new bear trend. Resistance at the lower edge has been overcome; price has closed above this trend line.
Cycle wave II may subdivide as any Elliott wave corrective structure except a triangle. It would most likely be a zigzag (zigzags subdivide 5-3-5). It may now be complete.
Draw a channel about primary wave B using Elliott’s technique for a correction. Draw the first trend line from the start of intermediate wave A to the end of intermediate wave B, then place a parallel copy on the end of intermediate wave A. Intermediate wave C may have ended mid way within the channel. A breach of the channel with a full daily candlestick below that does not touch the lower edge may be an indication that the bounce labelled primary wave B may be over and primary wave C downwards may have begun.
Intermediate wave (2) within primary wave C may not move beyond the start of intermediate wave (1) above 3,233.13. It remains technically possible that intermediate wave (2) may continue higher as a double zigzag. The invalidation point must be left to allow for this possibility.
Two targets are calculated now for primary wave C. If price approaches the first target and either the structure of primary wave C is incomplete or price keeps falling, then attention would turn to the second target.
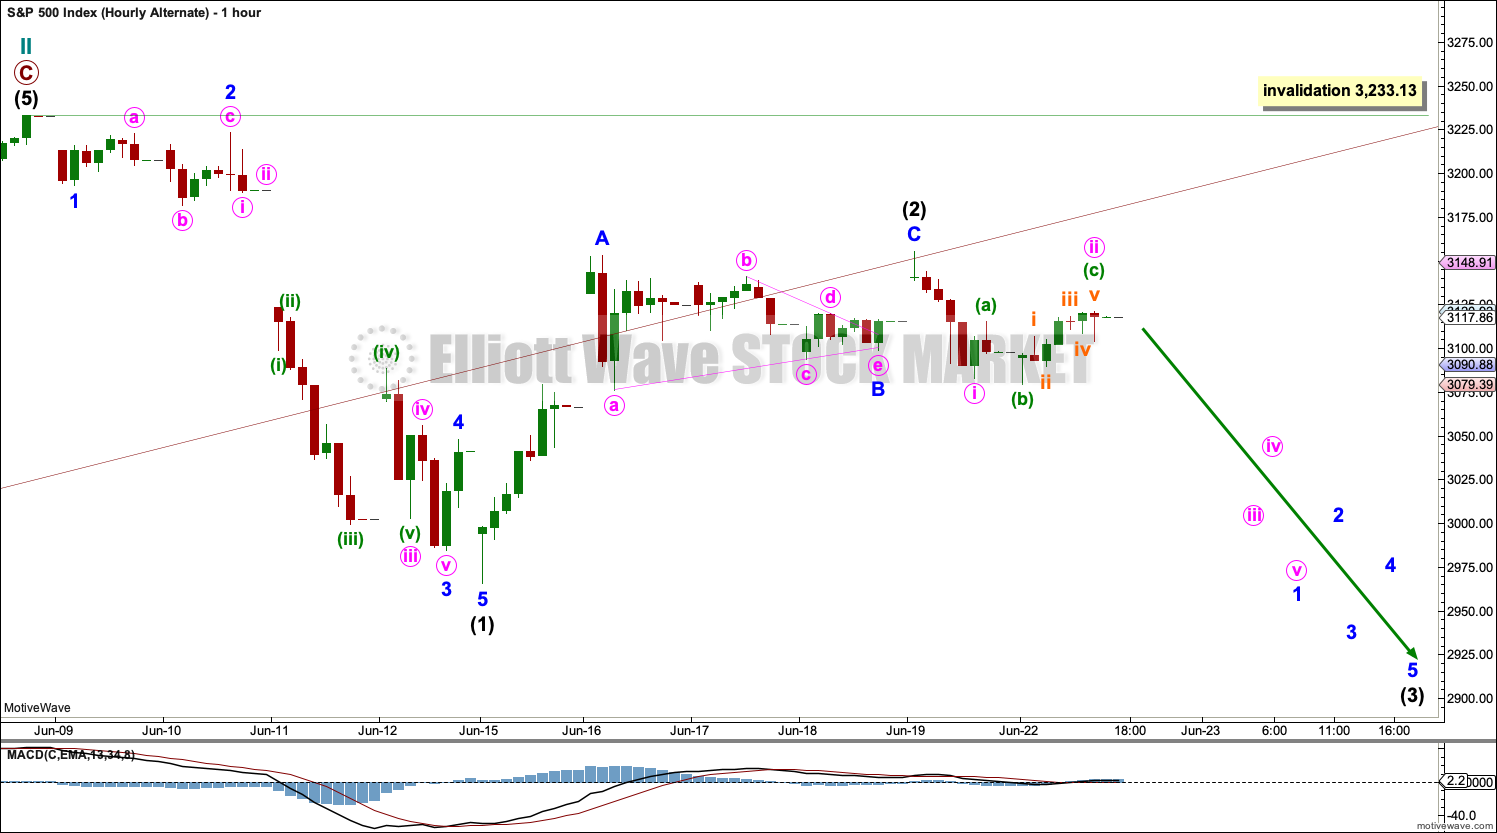
MAIN HOURLY CHART
Click chart to enlarge.
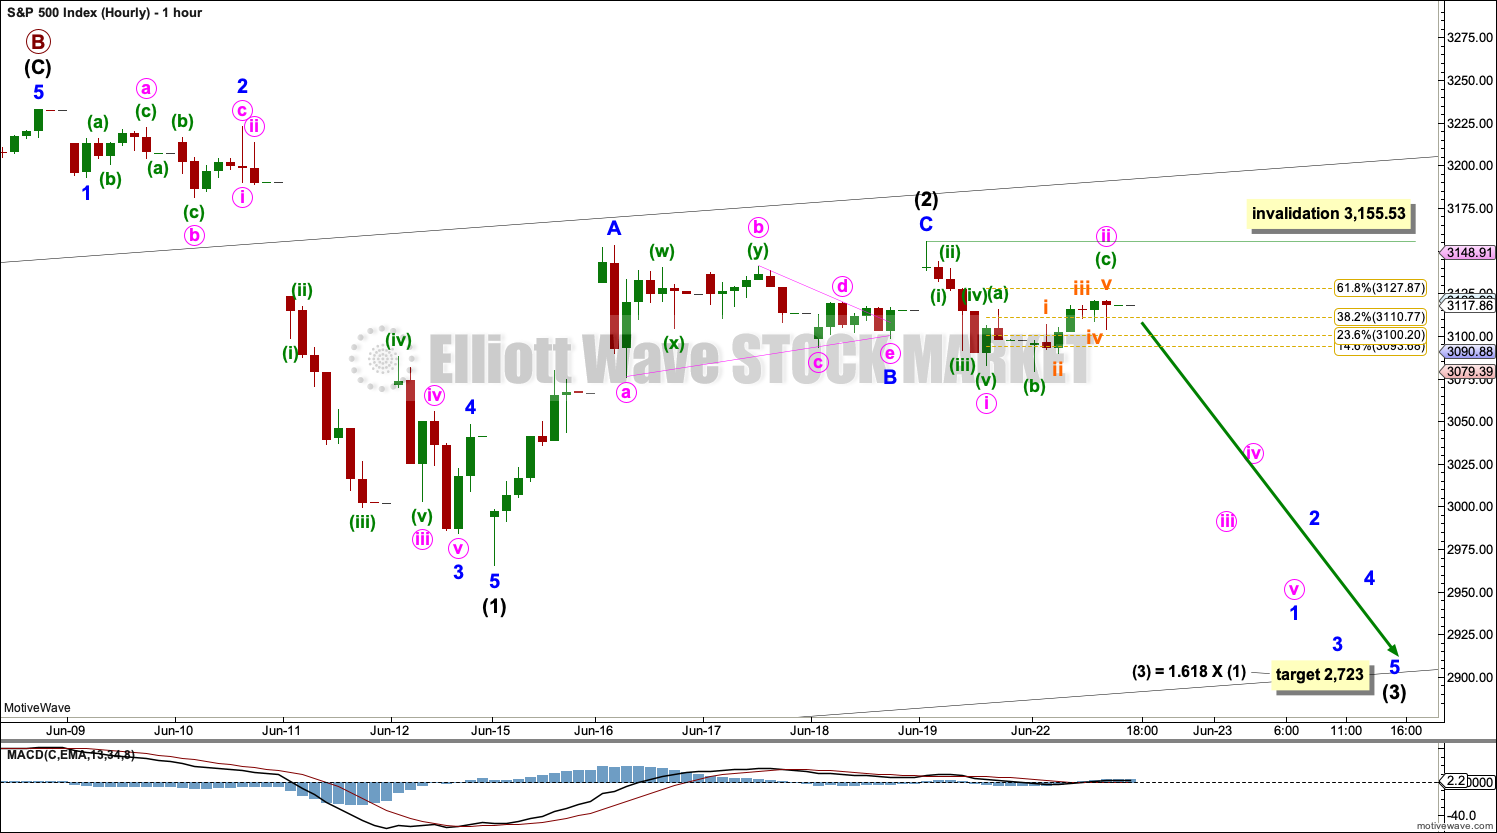
Intermediate (1) may have ended at the last low and intermediate wave (2) may now be a complete zigzag. Intermediate wave (3) may have begun at Friday’s high.
A target is recalculated for intermediate wave (3).
No second wave correction within intermediate wave (3) may move beyond the start of its first wave above 3,155.53.
ALTERNATE II HOURLY CHART
Click chart to enlarge.
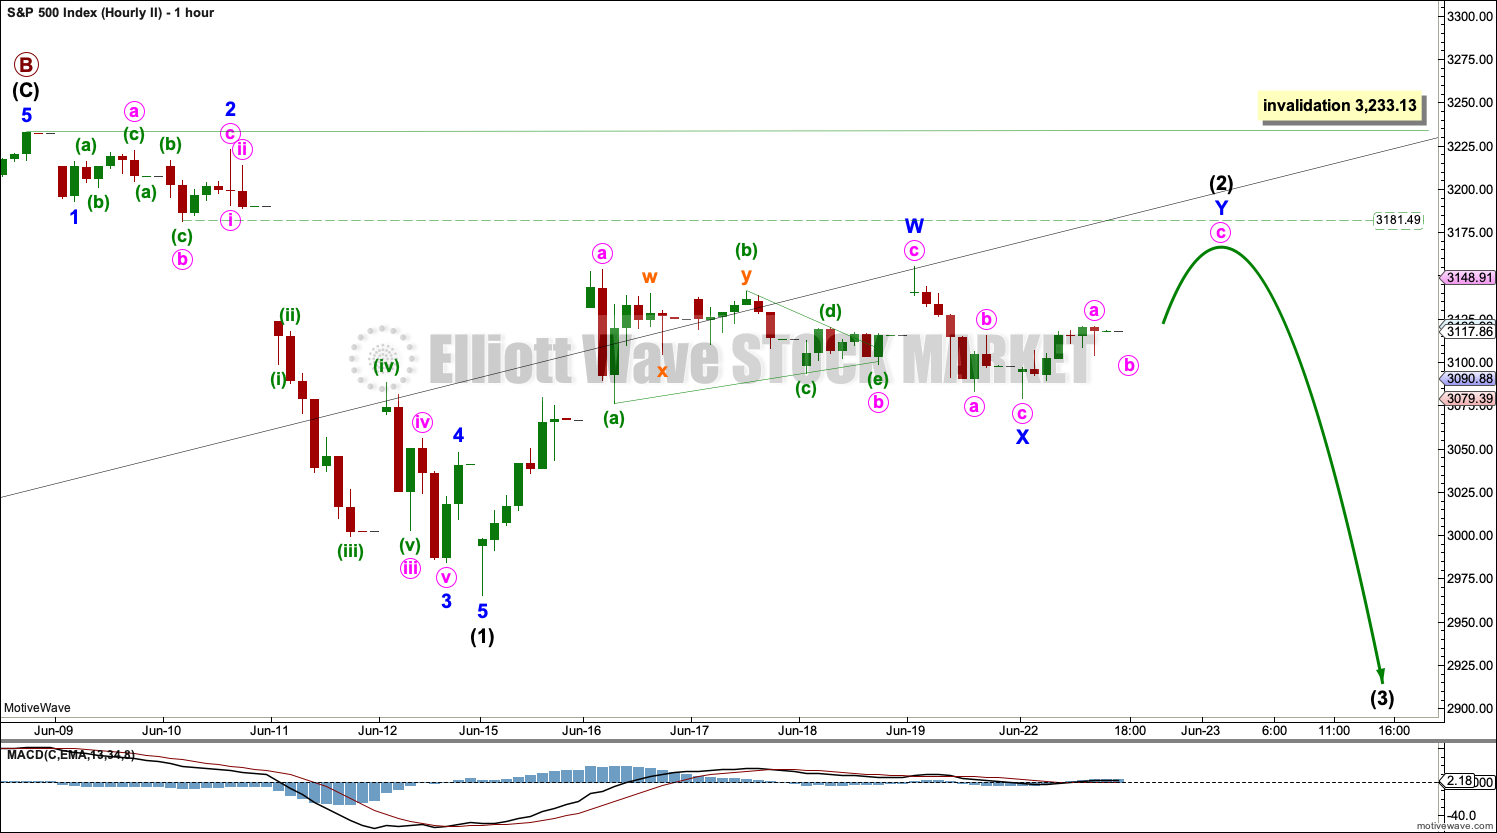
If the main wave count is invalidated in the short term, then intermediate wave (2) may be continuing higher as a double zigzag. The invalidation point would move higher to 3,233.13.
If intermediate wave (2) continues higher as a double zigzag, then it may end prior to closing the breakaway gap. It may end prior to 3,181.49.
Intermediate wave (2) may not move beyond the start of intermediate wave (1).
FIRST ALTERNATE DAILY CHART
Click chart to enlarge.
This alternate daily chart follows the First Alternate Monthly chart.
By simply moving the degree of labelling in the bull market beginning March 2009 up one degree, it is possible that a Grand Super Cycle trend change occurred on February 19, 2020. The bull market from March 2009 to February 2020 may have been a complete fifth wave labelled Super Cycle wave (V).
A bear market at Grand Super Cycle degree may be expected to last at least a decade, possibly longer. Corrections for this market tend to be much quicker than bullish moves, and so a fair amount of flexibility is required in expectations for duration of the different degrees.
Grand Super Cycle II would most likely subdivide as a zigzag, although it may be any corrective structure except a triangle. It should begin with a five down at the weekly chart time frame, which would be incomplete.
The first wave down on the daily chart is labelled cycle wave I. If this degree of labelling is wrong, it may be too high; it may need to be moved down one degree.
Following cycle wave I, cycle wave II may be a complete zigzag. A target for cycle wave III is now calculated.
Intermediate wave (2) within cycle wave III may not move beyond the start of intermediate wave (1) above 3,233.13.
FIRST ALTERNATE HOURLY CHART
Click chart to enlarge.
Cycle wave II may be a complete single zigzag. Hourly wave counts for the main daily chart work in the same way for this alternate. The degree of labelling for this alternate is all one degree higher.
The invalidation point is moved higher to the start of intermediate wave (1) to allow for the possibility that intermediate wave (2) may continue higher as a double zigzag.
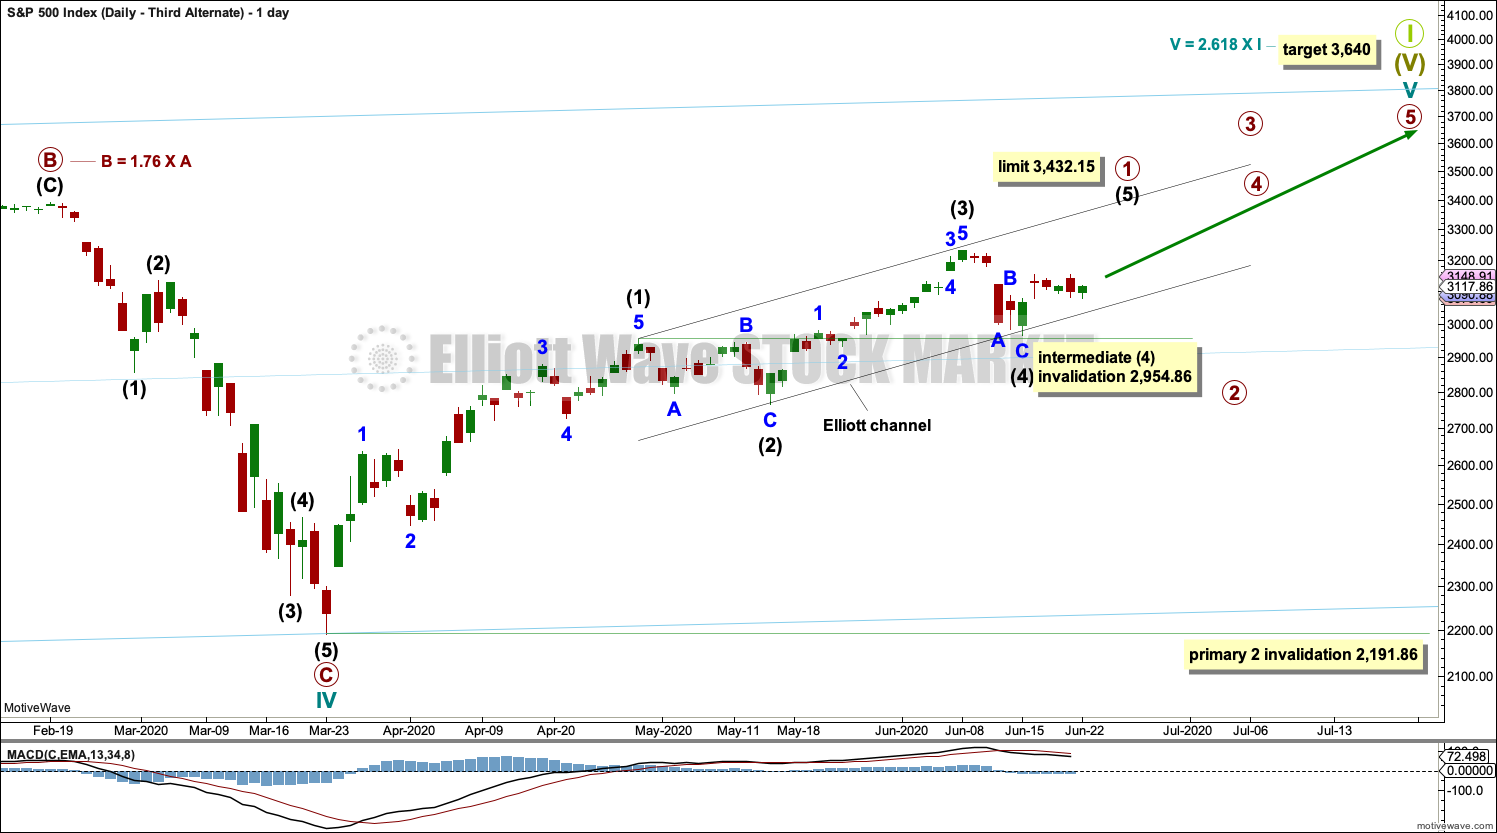
THIRD ALTERNATE DAILY CHART
Click chart to enlarge.
This alternate daily chart follows the third alternate monthly chart. It will be published daily because the structure of the current upwards wave is different and so the invalidation point is different. This alternate chart labels the subdivisions of the long bull market differently. The channel is a best fit.
The target for the end of this bull market is provisional. It would best be calculated at primary degree, but that cannot be done until all of primary waves 1 through to 4 are complete. At that stage, the target will be recalculated and will very likely change.
Cycle wave V must subdivide as a five wave motive structure, most likely an impulse. Primary wave 1 within cycle wave V may be nearing completion.
Within primary wave 1: intermediate waves (1) through to (3) may be complete and intermediate wave (4) may not move into intermediate wave (1) price territory below 2,954.86.
Use Elliott’s first technique to draw a channel about primary wave 1. Draw the first trend line from the ends of intermediate waves (1) to (3), then place a parallel copy on the end of intermediate wave (2). Intermediate wave (4) remains within the channel and may have found support about the lower edge.
When primary wave 1 may be a complete five wave structure, then primary wave 2 should then unfold as a multi-week pullback and may not move beyond the start of primary wave 1 below 2,191.86.
In the short term, invalidation of this wave count by a new low below 2,954.86 would add confidence to the first two wave counts.
This alternate wave count is bullish.
Cycle wave V may last from one to several years.
TECHNICAL ANALYSIS
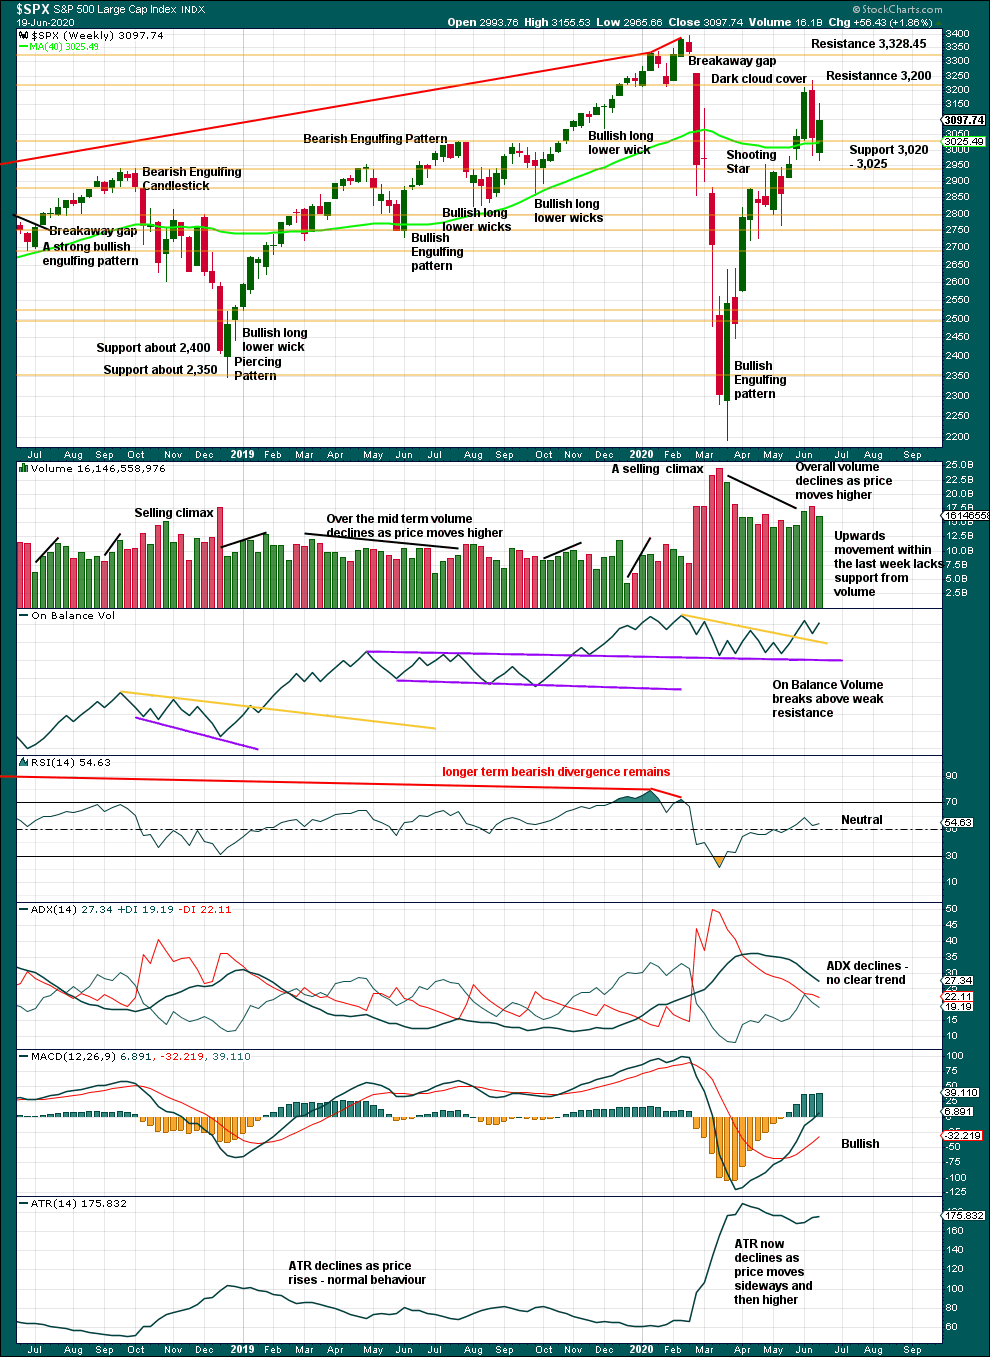
WEEKLY CHART
Click chart to enlarge. Chart courtesy of StockCharts.com.
Dark Cloud Cover is now followed by a downwards week although the downwards week has closed green. This is not interpreted as bullish. Price has overall moved lower.
DAILY CHART
Click chart to enlarge. Chart courtesy of StockCharts.com.
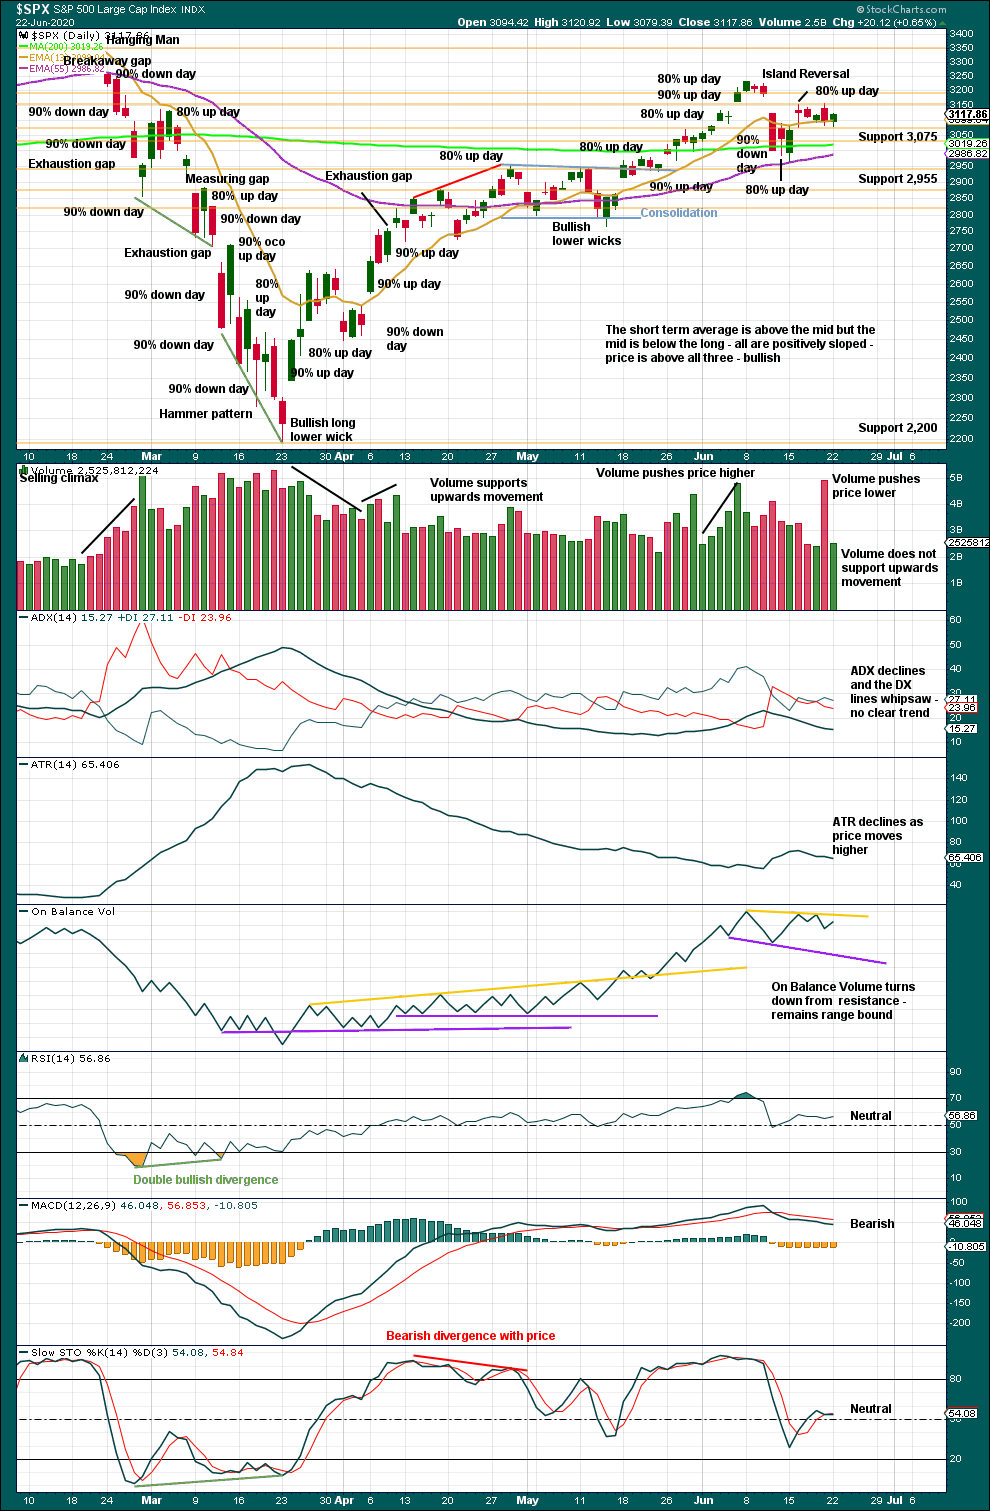
The breakaway gap of 24th February has its upper edge at 3,328.45. A bearish analysis remains reasonable while this gap remains open. If this gap is closed, then a more bullish analysis that would expect new all time highs would increase in probability.
Towards the high of 8th of June were a 90% and an 80% up day. Those have now been followed by a very strong 90% down day (98.4% of volume was down and 99.6% of points were down) within three sessions. This represents a 180° reversal in sentiment from bullish to bearish, supporting the view of a sustainable high in place.
The island reversal is comprised of an exhaustion gap created on June 5th and now a possible breakaway gap created on June 11th. This breakaway gap may be used as resistance at 3,181.49, as breakaway gaps should not be closed while the resulting trend unfolds.
Resistance at the island reversal holds. Price remains range bound. The short-term volume profile is bearish.
BREADTH – AD LINE
WEEKLY CHART
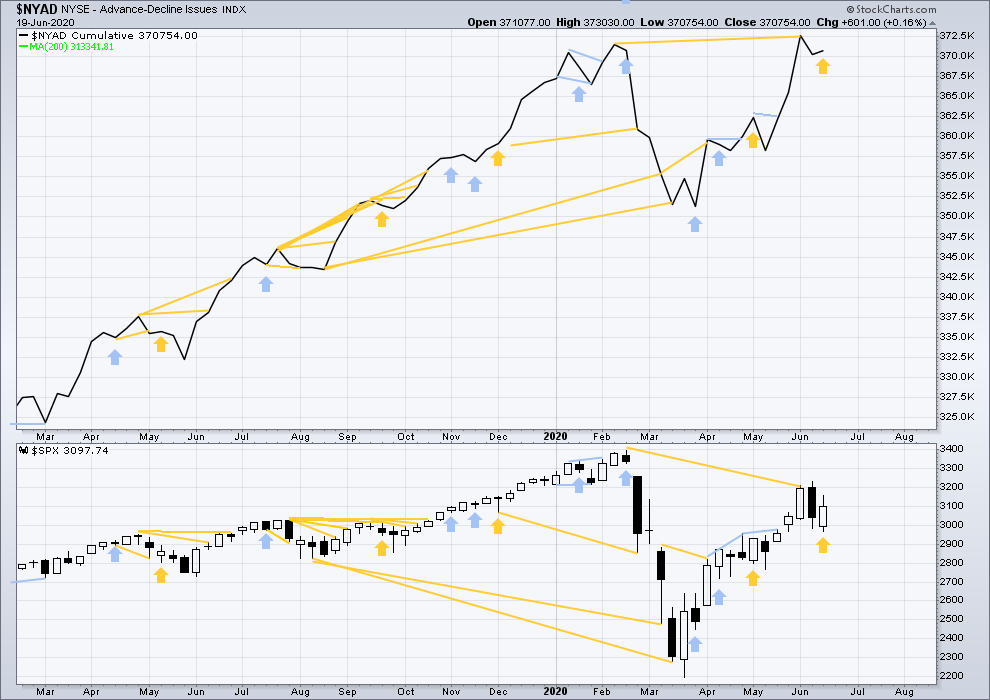
Click chart to enlarge. Chart courtesy of StockCharts.com. So that colour blind members are included, bearish signals will be noted with blue and bullish signals with yellow.
Breadth should be read as a leading indicator.
Bullish divergence noted four weeks ago remains.
Last week price has moved lower, but the AD line has moved higher. This divergence is bullish but weak.
Large caps all time high: 3,393.52 on 19th February 2020.
Mid caps all time high: 2,109.43 on 20th February 2020.
Small caps all time high: 1,100.58 on 27th August 2018.
Of all large, mid and small caps, it is small caps that are furthest off their all time highs and large caps that are closest. This rise is led by large caps, which is normally a feature of an aged bull market and not a new bull market.
DAILY CHART
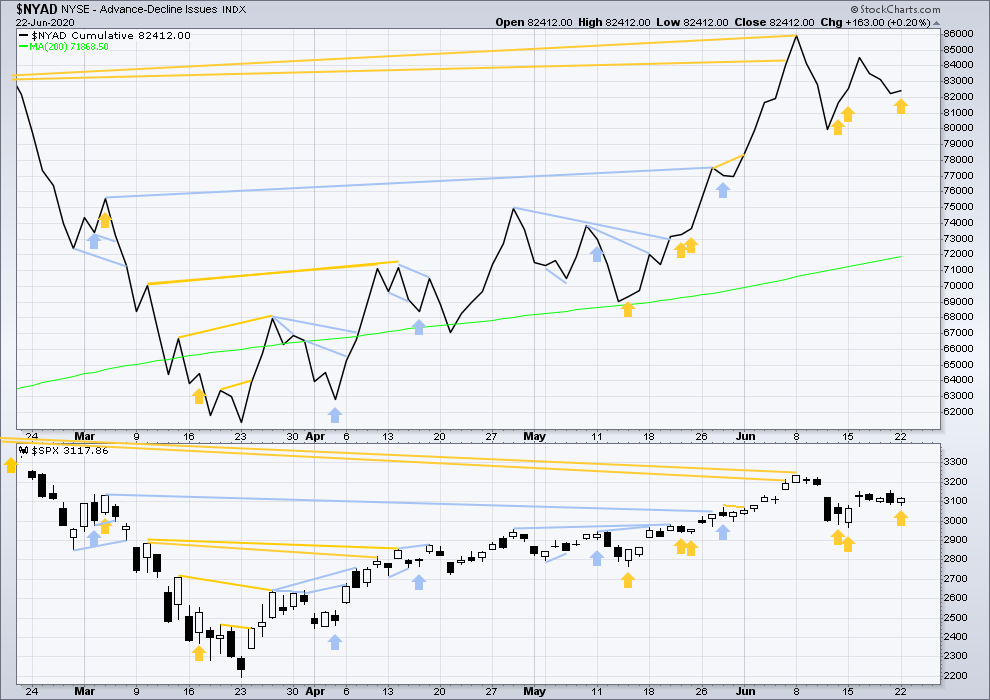
Click chart to enlarge. Chart courtesy of StockCharts.com. So that colour blind members are included, bearish signals will be noted with blue and bullish signals with yellow.
Although the NYSE AD line has made new all time highs, Lowry’s OCO AD line did not. Bullish divergence may still support a bullish wave count.
Today price has moved overall lower with a slightly lower low and a lower high, but the candlestick has closed green. The AD line has moved slightly higher. This divergence is bullish, but it is weak and short term.
VOLATILITY – INVERTED VIX CHART
WEEKLY CHART
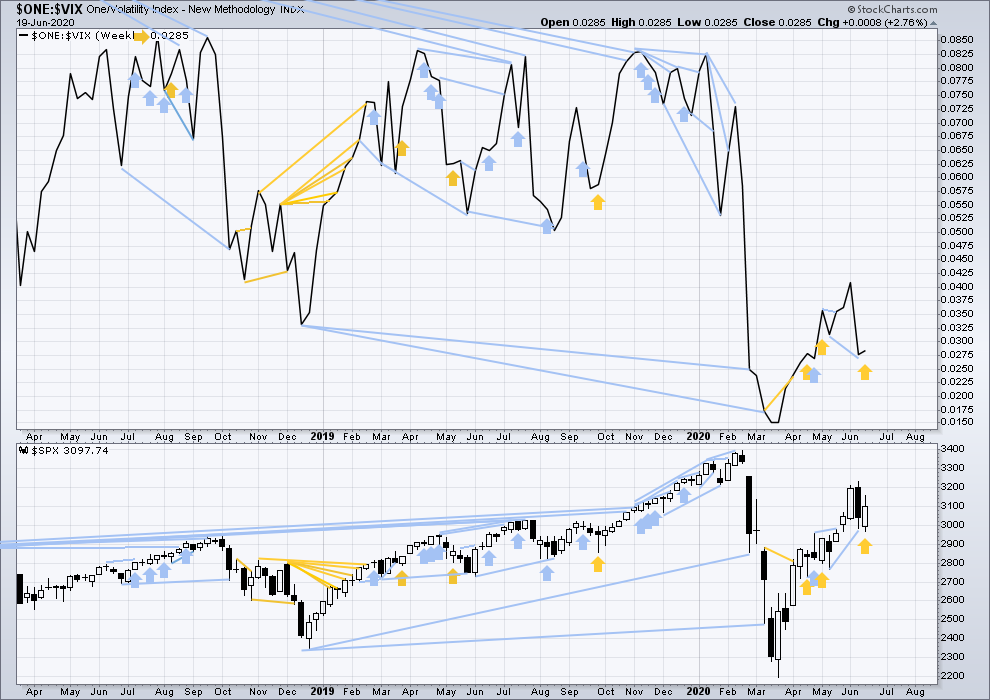
Click chart to enlarge. Chart courtesy of StockCharts.com. So that colour blind members are included, bearish signals will be noted with blue and bullish signals with yellow.
Last week price has moved lower, but inverted VIX has moved slightly higher. This divergence is bullish, but it is weak.
DAILY CHART
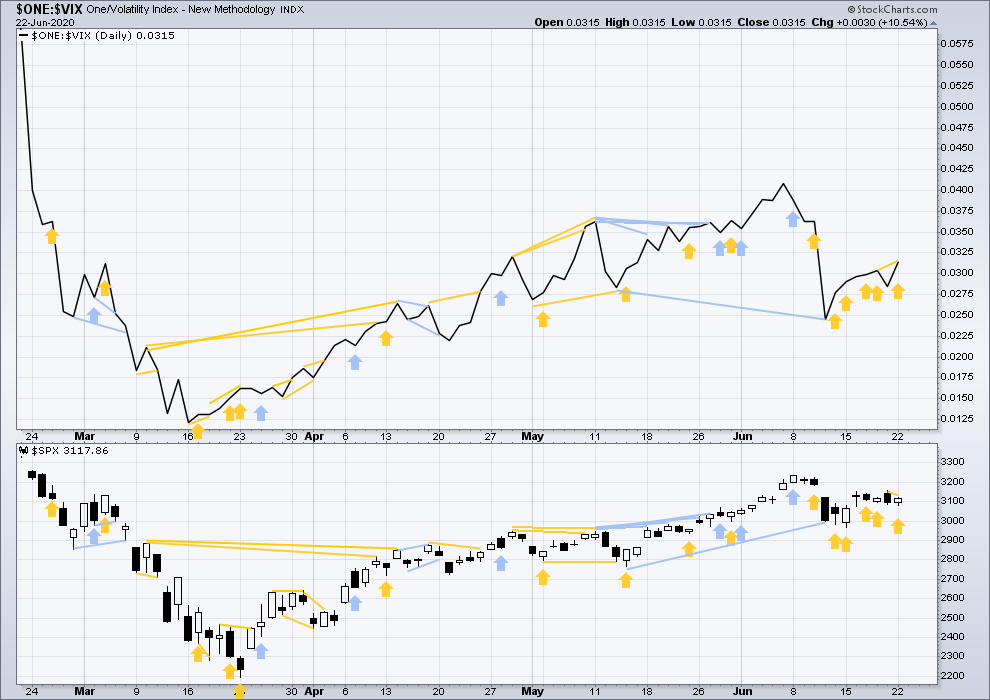
Click chart to enlarge. Chart courtesy of StockCharts.com. So that colour blind members are included, bearish signals will be noted with blue and bullish signals with yellow.
VIX has made a new swing low below the prior swing low of March 13th / 14th, but price has not. This divergence is bearish and supports either the main or first alternate Elliott wave counts.
Today price has moved slightly lower, but inverted VIX has moved higher to make a new short-term swing high above the prior high 2-3 sessions ago. This divergence is bullish, but it is weak and short term.
DOW THEORY
Dow Theory has confirmed a bear market with the following lows made on a closing basis:
DJIA: 21,712.53 – a close below this point has been made on the March 12, 2020.
DJT: 8,636.79 – a close below this point has been made on March 9, 2020.
Adding in the S&P and Nasdaq for an extended Dow Theory, a bear market has now been confirmed:
S&P500: 2,346.58 – a close below this point has now been made on March 20, 2020.
Nasdaq: 7,292.22 – a close below this point was made on the March 12, 2020.
At this time, to shift Dow Theory from viewing a bear market to confirmation of a new bull market would require new highs made on a closing basis:
DJIA – 29,568.57
DJT – 11,623.58
Adding in the S&P and Nasdaq for an extended Dow Theory:
S&P500 – 3,393.52
Nasdaq – 9,838.37 – closed above on June 8, 2020.
Published @ 07:28 p.m. ET
—
Careful risk management protects your trading account(s).
Follow my two Golden Rules:
1. Always trade with stops.
2. Risk only 1-5% of equity on any one trade.
—
New updates to this analysis are in bold.