For the very short term, a small bounce within this consolidation was expected as most likely to begin on Monday. This is exactly what has happened.
Summary: A pullback or consolidation is underway. It may continue now through to the end of this week and possibly a little longer. Support is expected to be about 3,153; but if this expectation is wrong, it may be too low.
Three large pullbacks or consolidations (fourth waves) during the next 1-2 years are expected: for minor wave 4 (underway), then intermediate (4), and then primary 4.
The biggest picture, Grand Super Cycle analysis, is here.
Last monthly charts analysis is here with video here.
ELLIOTT WAVE COUNTS
FIRST WAVE COUNT
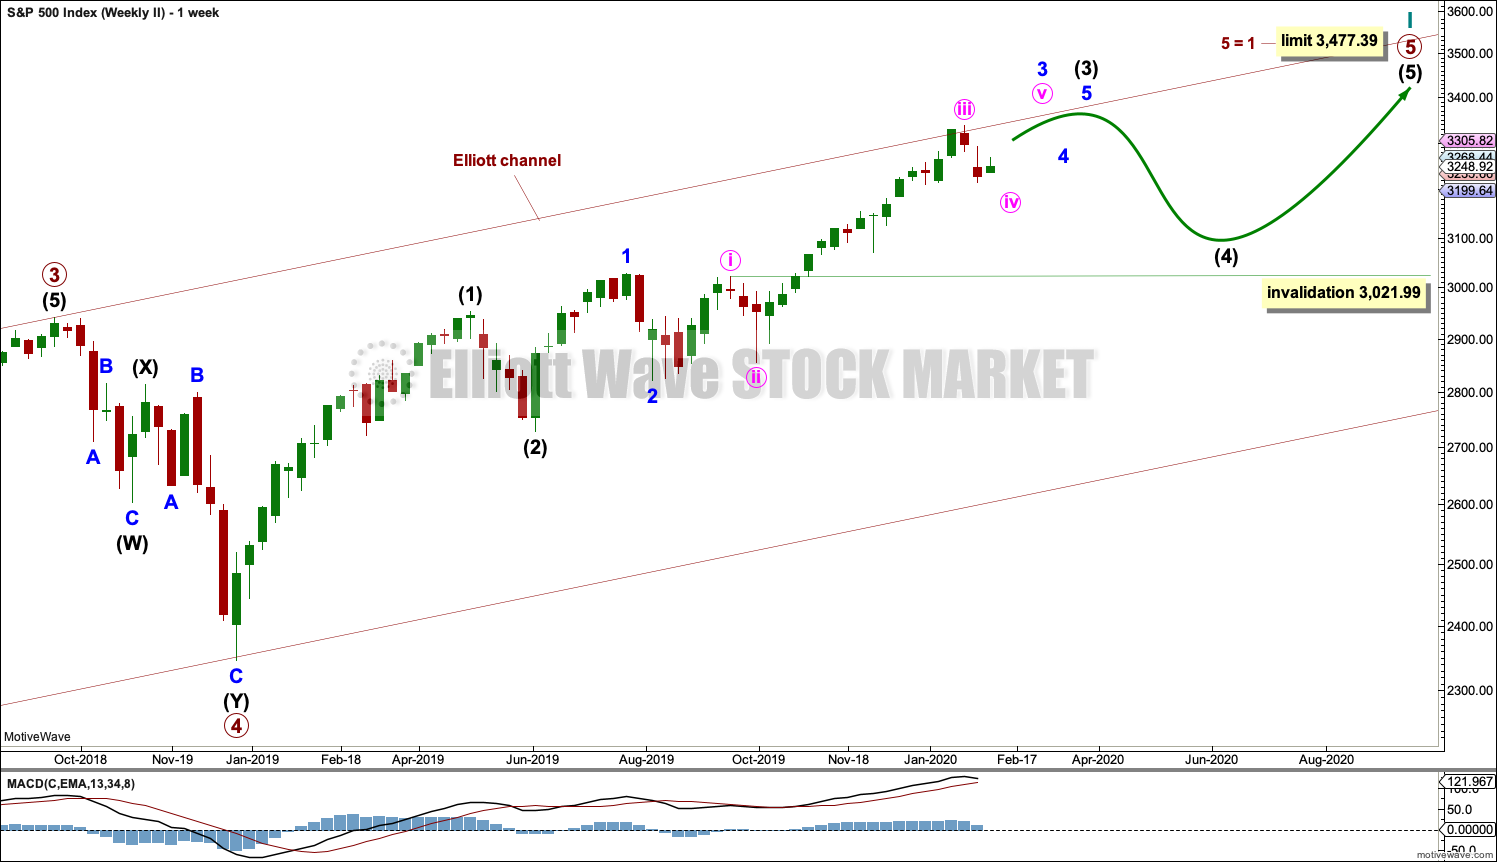
WEEKLY CHART
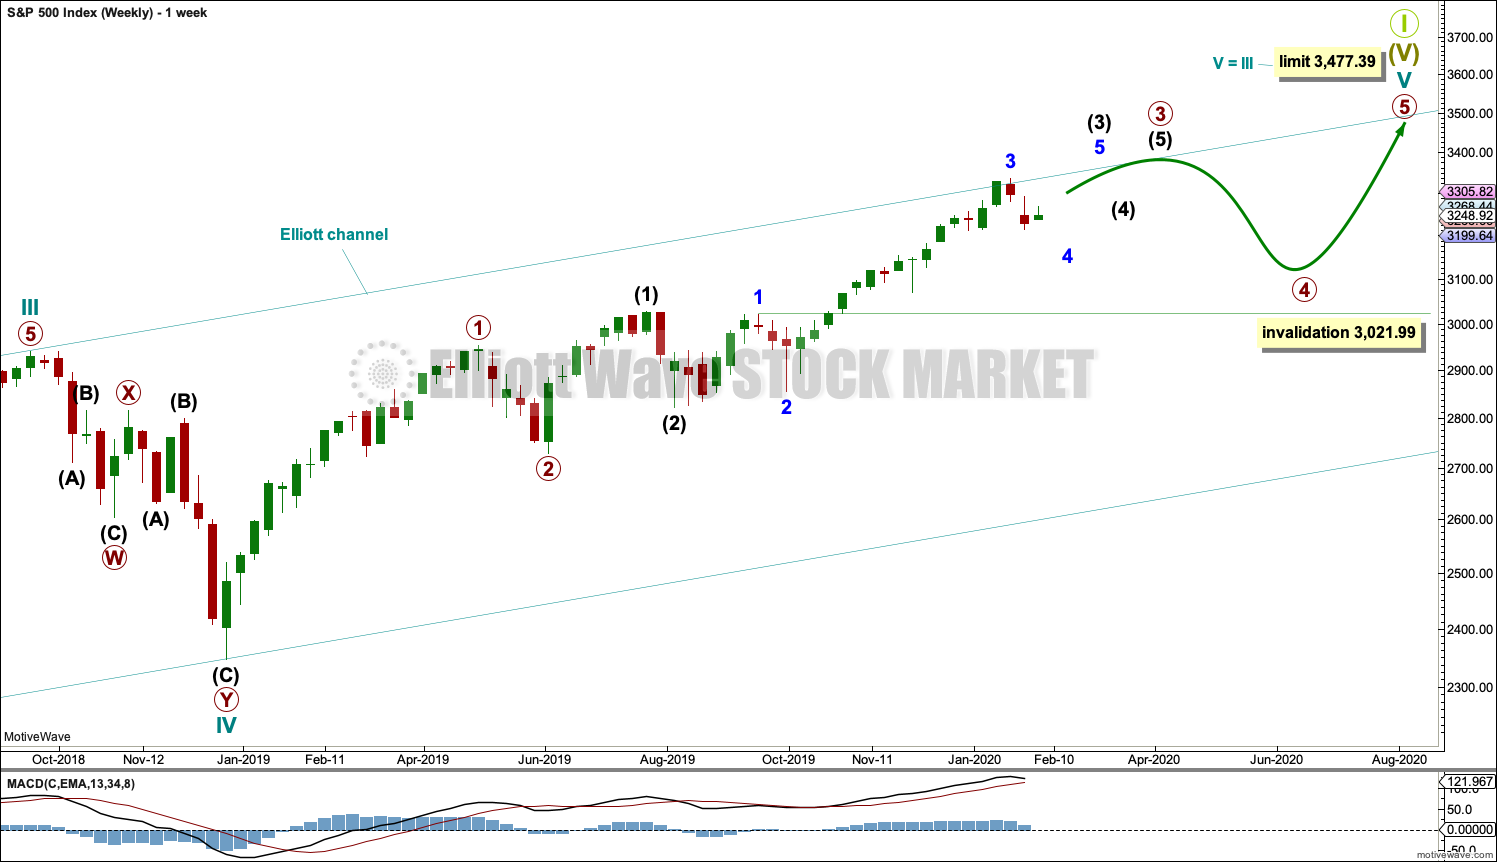
Cycle wave V may subdivide either as an impulse or an ending diagonal. Impulses are much more common, and it is clear at this stage that cycle wave V is an impulse and not a diagonal.
At this stage, cycle wave V may take another one to two or so years to complete.
A channel is drawn about the impulse of Super Cycle wave (V) using Elliott’s first technique. Draw this channel first from the high of 2,079.46 on the 5th of December 2014 to the high of 2,940.91 on the 21st of September 2018, then place a parallel copy on the low at 1,810.10 on the 11th of February 2016. Cycle wave IV found support about the lower edge.
Within Super Cycle wave (V), cycle wave III may not be the shortest actionary wave. Because cycle wave III is shorter than cycle wave I, this limits cycle wave V to no longer than equality in length with cycle wave III at 3,477.39. A new high by any amount at any time frame above this point would invalidate this main wave count in favour of one of the two alternate wave counts in the monthly chart analysis which are much more bullish.
The daily chart below will focus on movement from the end of minor wave 1 within intermediate wave (3).
Within cycle wave V, primary waves 1 and 2 may be complete. Within primary wave 3, intermediate waves (1) and (2) may be complete. Within intermediate wave (3), minor wave 4 may not move into minor wave 1 price territory below 3,021.99.
Within cycle wave V, the corrections of primary wave 2, intermediate wave (2) and minor wave 2 all show up clearly on the weekly chart. For cycle wave V to have the right look, the corresponding corrections of minor wave 4, intermediate wave (4) and primary wave 4 should also show up on the weekly chart. Three more large multi-week corrections are needed as cycle wave V continues higher, and for this wave count the whole structure must complete at or before 3,477.39.
DAILY CHART
All of primary wave 3, intermediate wave (3) and minor wave 3 may only subdivide as impulses.
Minor wave 3 now looks complete.
Minor wave 2 was a sharp deep pullback, so minor wave 4 may be expected to be a very shallow sideways consolidation to exhibit alternation. Minor wave 2 lasted 2 weeks. Minor wave 4 may be about the same duration, or it may be a longer lasting consolidation. Minor wave 4 may end within the price territory of the fourth wave of one lesser degree; minute wave iv has its range from 3,154.26 to 3,070.49. However, this target zone at this stage looks to be too low.
Minor wave 4 may not move into minor wave 1 price territory below 3,021.99.
When minor wave 4 may be complete, then a target will again be calculated for intermediate wave (3).
When intermediate waves (3) and (4) may be complete, then a target will again be calculated for primary wave 3.
Draw an Elliott channel about intermediate wave (3): draw the first trend line from the end of minor wave 1 to the end of minor wave 3, then place a parallel copy on the end of minor wave 2. Minor wave 4 may find support at the lower edge of this channel if it is long lasting or deep enough. It is possible that minor wave 4 may breach the lower edge of the channel as fourth waves are not always contained within a channel drawn using this technique. If minor wave 4 breaches the channel, then it shall need to be redrawn using Elliott’s second technique.
Price has recently reached just above the upper edge of the wide teal channel copied over from monthly and weekly charts. A reaction downwards here increases the technical significance of this trend line.
Minor wave 4 may subdivide as any corrective structure, most likely a flat, triangle or combination. Within all of a flat, triangle or combination, there should be an upwards wave which may be fairly deep. That may unfold next week. If that expectation is wrong, then minute wave a may continue lower first.
HOURLY CHART
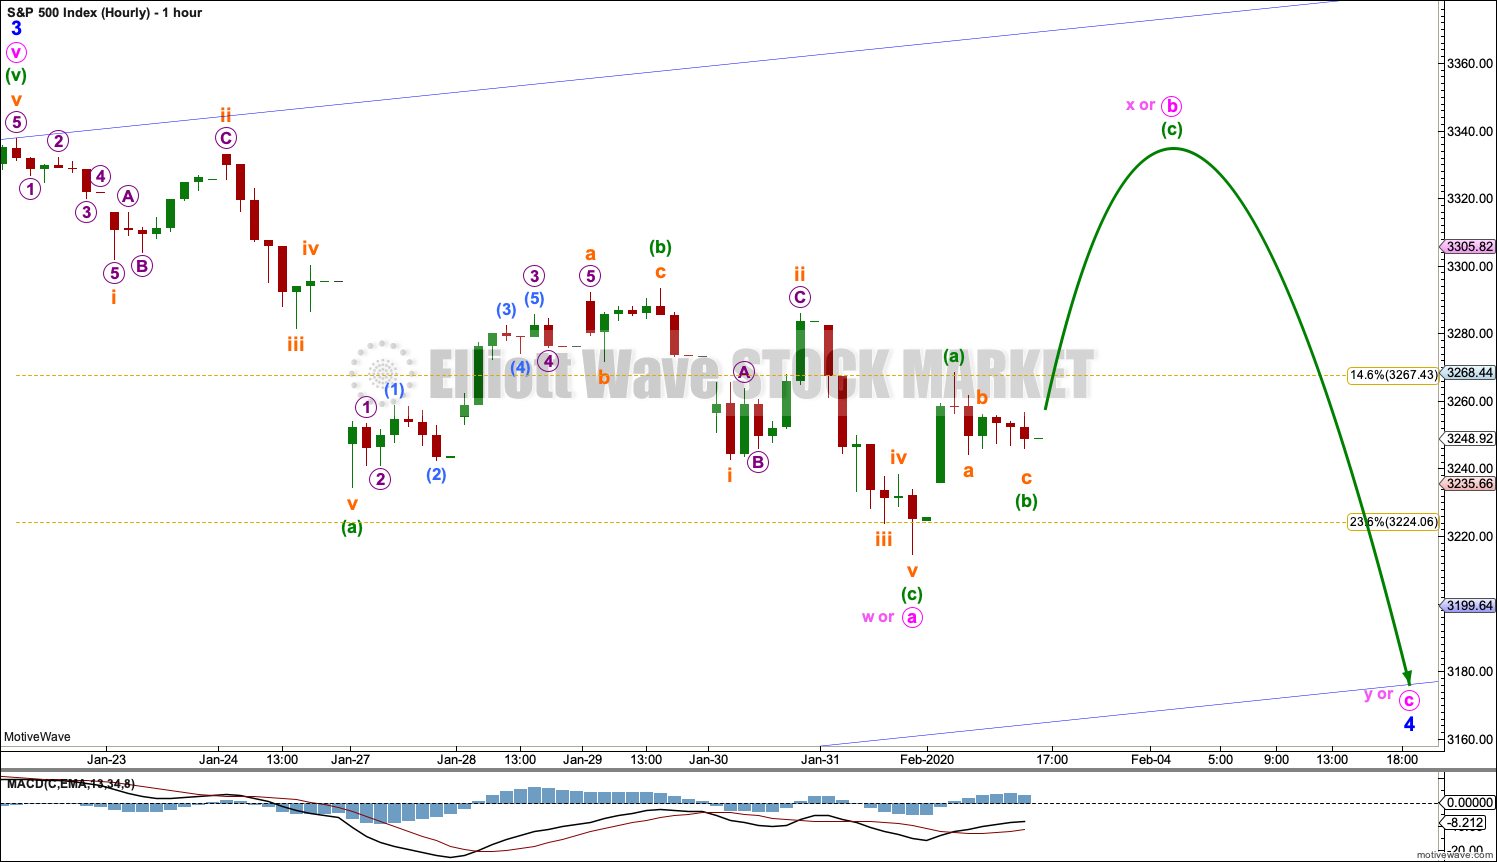
A zigzag downwards may now be complete. This is labelled minute wave a or w.
If the zigzag downwards is complete, then a three wave structure upwards may have begun. This would be labelled minute wave b or x. If minor wave 4 unfolds as a flat correction, then within it minute wave b must retrace a minimum 0.9 length of minute wave a at 3,325.46, and it may make a new all time high as in an expanded flat. If minor wave 4 unfolds as a combination or triangle, then there is no minimum upwards requirement for minute wave x or b and either may make a new all time high.
B waves are the most difficult of all the Elliott waves to analyse. They exhibit the greatest variety in structure and price behaviour. Minute wave b may be a quick sharp bounce, or it may be a complicated time consuming sideways consolidation.
Minor wave 4 may end within the price territory of the fourth wave of one lesser degree. Minute wave iv has its range from 3,154.26 to 3,070.49. Within this range is the 0.382 Fibonacci ratio of minor wave 3 at 3,153.72. If this target range is wrong, then it may be too low.
SECOND WAVE COUNT
WEEKLY CHART
This second wave count sees all subdivisions from the end of the March 2009 low in almost the same way, with the sole difference being the degree of labelling.
If the degree of labelling for the entirety of this bull market is all moved down one degree, then only a first wave at cycle degree may be nearing an end.
When cycle wave I is complete, then cycle wave II should meet the technical definition of a bear market as it should retrace more than 20% of cycle wave I, but it may end about either the 0.382 or 0.618 Fibonacci Ratios of cycle wave I. Cycle wave II may end close to the low of primary wave II within cycle wave I, which is at 1,810.10. It is also possible that cycle wave II could be fairly shallow and only barely meet the definition of a bear market.
The impulse is still viewed as nearing an end; a fifth wave is still seen as needing to complete higher. This wave count labels it primary wave 5. Primary wave 5 may still need another year to two or so to complete, depending upon how time consuming the corrections within it may be.
Primary wave 5 may be subdividing as an impulse, in the same way that cycle wave V is seen for the first weekly chart.
TECHNICAL ANALYSIS
WEEKLY CHART
Click chart to enlarge. Chart courtesy of StockCharts.com.
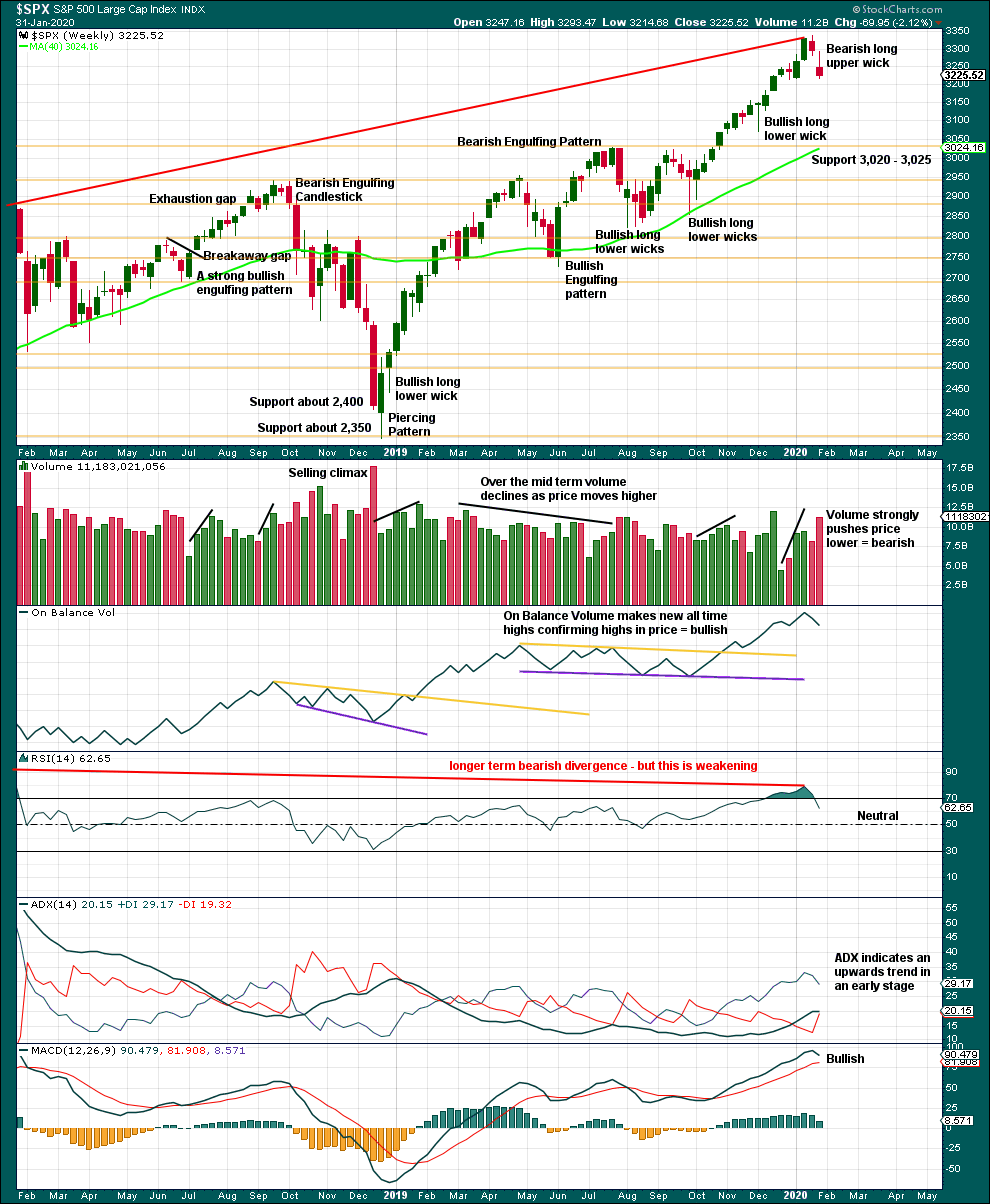
It is very clear that the S&P is in an upwards trend and the bull market is continuing. Price does not move in straight lines; there will be pullbacks and consolidations along the way.
This chart is overall bullish. There are no signs of weakness in upwards movement.
A pullback or consolidation has begun. This is relieving extreme conditions. Look for strong support below about 3,020 to 3,025.
DAILY CHART
Click chart to enlarge. Chart courtesy of StockCharts.com.
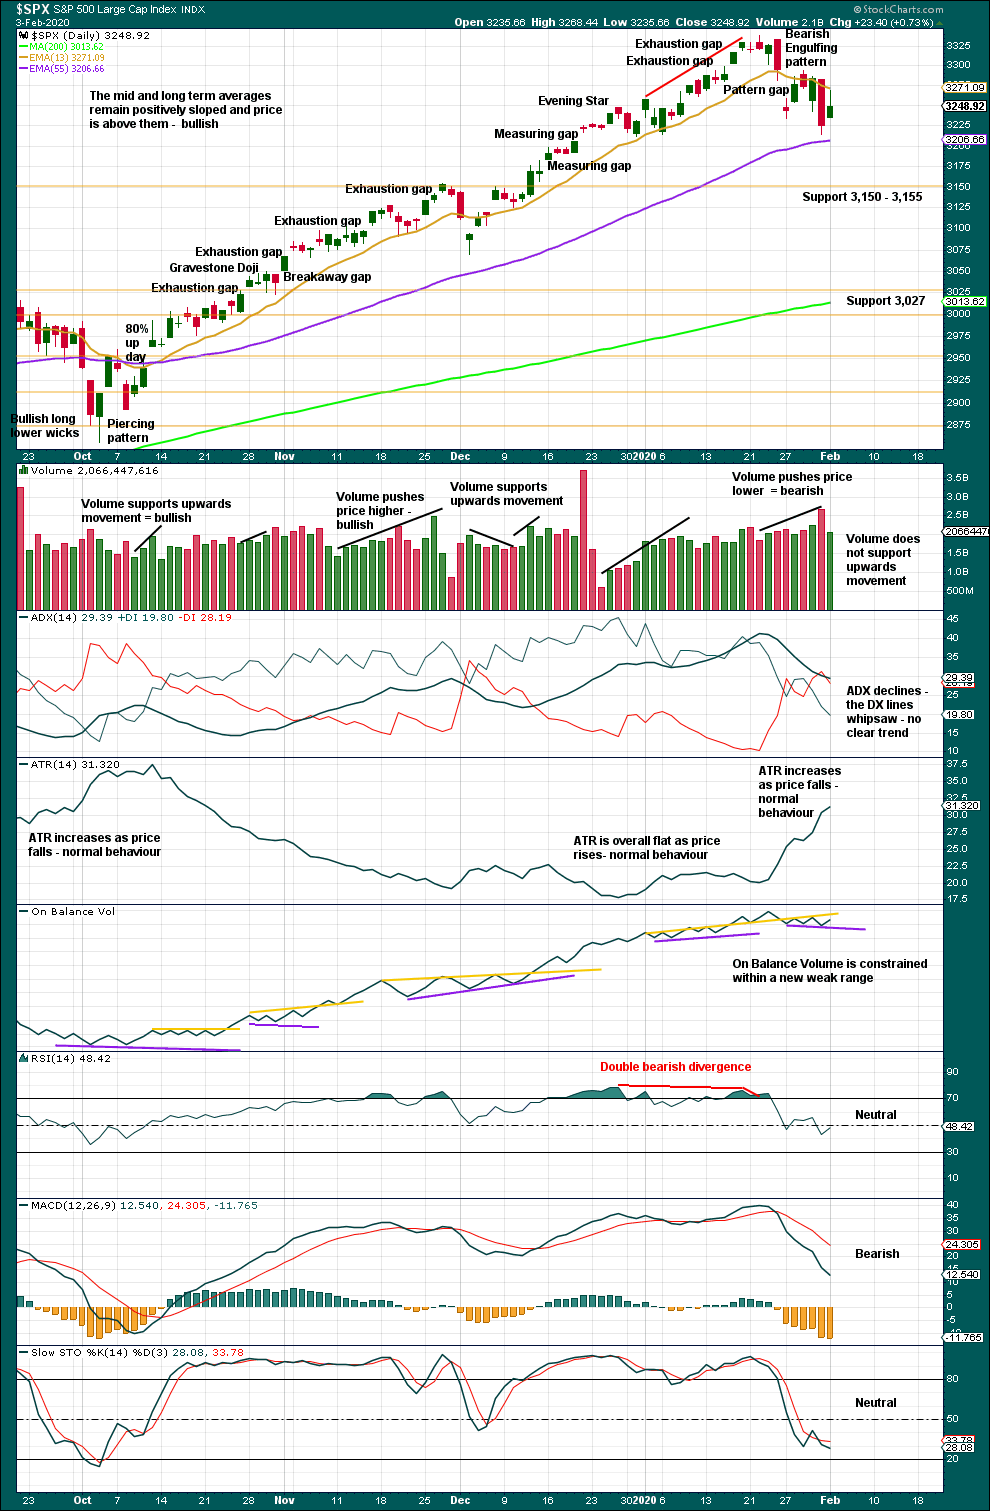
The larger trend, particularly at the monthly time frame, remains up. Expect pullbacks and consolidations to be more short term in nature although they can last a few weeks.
In a bull market which may continue for months or years, pullbacks and consolidations may present opportunities for buying when price is at or near support.
Price is not yet at support and Stochastics is not yet oversold. Next support is at 3,150 to 3,155.
Sustainable lows may be identified by a 180° reversal of sentiment in a 90% down day followed by one or more of the following things:
– Either a 90% up day or two back to back 80% up days within 3 sessions of the 90% down day.
– RSI may reach oversold and then exhibit bullish divergence.
– A strong bullish candlestick pattern with support from volume.
In the absence of bullish reversal signs, expect the pullback or consolidation to continue.
Today a small range inside day lacks support from volume. This may be either a small bounce within an ongoing sharp pullback, or the start of an upwards swing within an ongoing sideways consolidation. It is not strong enough by a wide margin to indicate a sustainable low in place.
BREADTH – AD LINE
WEEKLY CHART
Click chart to enlarge. Chart courtesy of StockCharts.com. So that colour blind members are included, bearish signals
will be noted with blue and bullish signals with yellow.
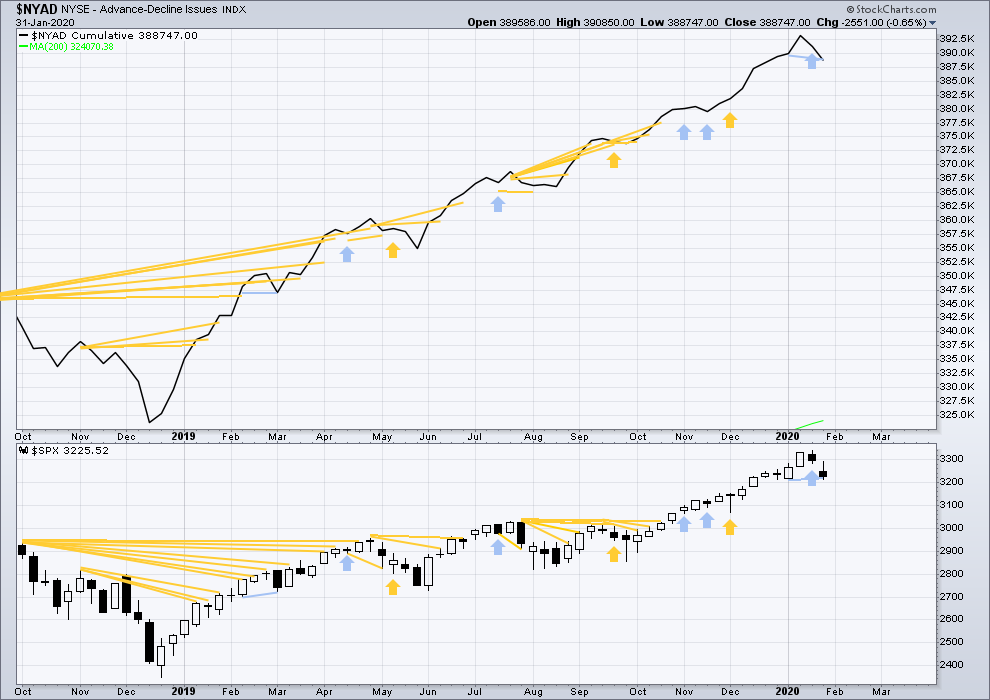
Bear markets from the Great Depression and onwards have been preceded by an average minimum of 4 months divergence between price and the AD line with only two exceptions in 1946 and 1976. With the AD line making new all time highs last week, the end of this bull market and the start of a new bear market is very likely a minimum of 4 months away, which is mid May 2020.
In all bear markets in the last 90 years there is some positive correlation (0.6022) between the length of bearish divergence and the depth of the following bear market. No to little divergence is correlated with more shallow bear markets. Longer divergence is correlated with deeper bear markets.
If a bear market does develop here, it comes after no bearish divergence. It would therefore more likely be shallow.
Last week both price and the AD line have moved lower. Downwards movement has support from declining market breadth. The AD line has made a slight new low below the short-term low three weeks prior, but price has not but only by 0.04 points. This divergence is bearish, but it is very weak. The important point to note is that it is not bullish.
Large caps all time high: 3,337.77 on 22nd January 2020.
Mid caps all time high: 2,106.30 on 17th January 2020.
Small caps all time high: 1,100.58 on 27th August 2018.
For the short term, there is a little weakness now in only large caps making most recent new all time highs.
DAILY CHART
Click chart to enlarge. Chart courtesy of StockCharts.com. So that colour blind members are included, bearish signals
will be noted with blue and bullish signals with yellow.
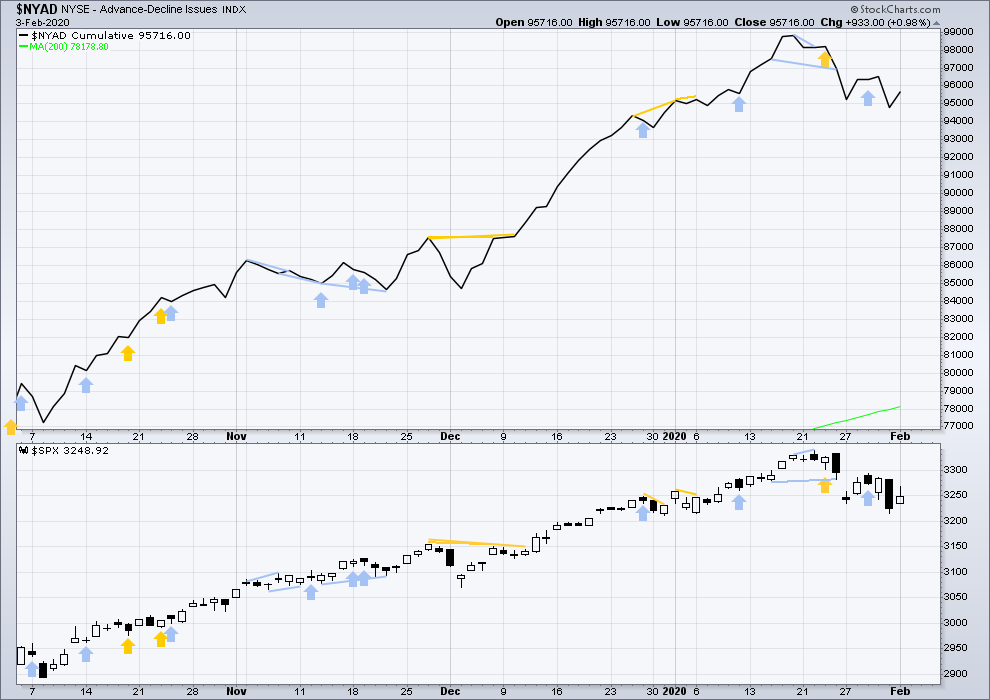
Breadth should be read as a leading indicator.
Upwards movement for Monday has a corresponding rise in the AD line. There is no new divergence.
VOLATILITY – INVERTED VIX CHART
WEEKLY CHART
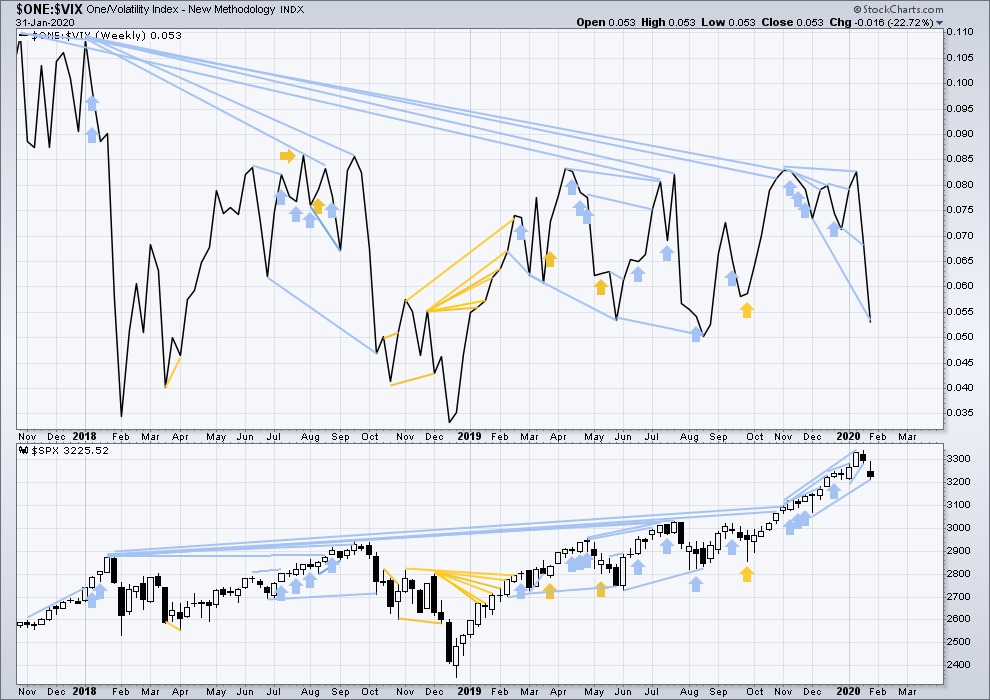
Click chart to enlarge. Chart courtesy of StockCharts.com. So that colour blind members are included, bearish signals
will be noted with blue and bullish signals with yellow.
The all time high for inverted VIX was on 30th October 2017. There is now over two years of bearish divergence between price and inverted VIX.
The rise in price is not coming with a normal corresponding decline in VIX; VIX remains elevated. This long-term divergence is bearish and may yet develop further as the bull market matures.
This divergence may be an early warning, a part of the process of a top developing that may take years. It may is clearly not useful in timing a trend change from bull to a fully fledged bear market.
Last week both price and inverted VIX have moved lower. Inverted VIX is falling faster than price. It has made a new mid-term low below the prior low 8 weeks ago, but price has not. This divergence is bearish.
DAILY CHART
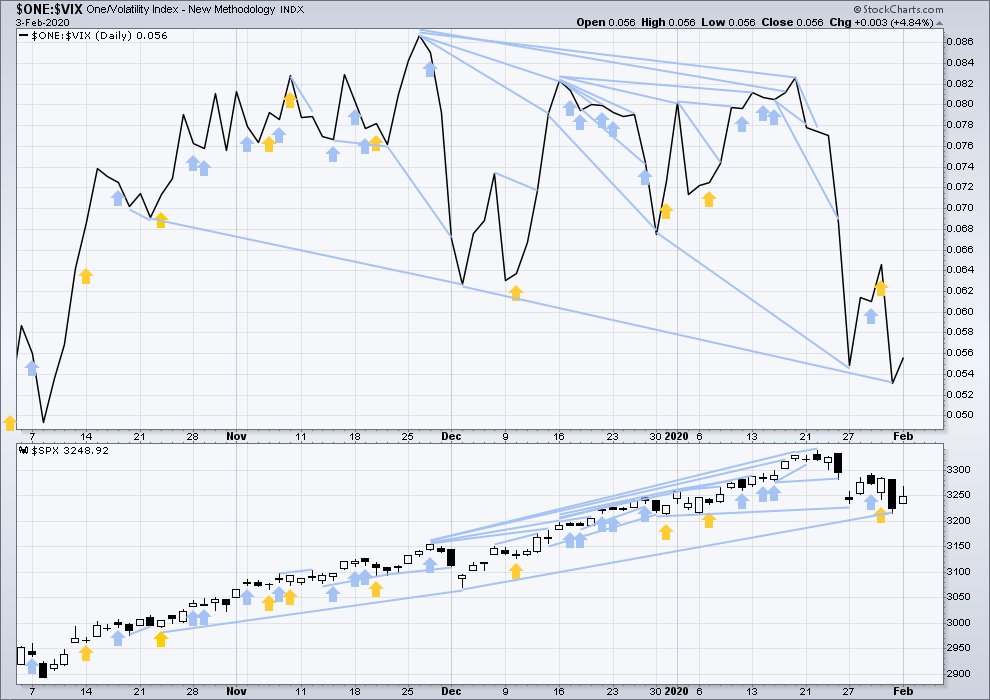
Click chart to enlarge. Chart courtesy of StockCharts.com. So that colour blind members are included, bearish signals
will be noted with blue and bullish signals with yellow.
Upwards movement for Monday comes with a corresponding rise in inverted VIX. There is no new short-term divergence.
DOW THEORY
Dow Theory confirmed a bear market in December 2018. This does not necessarily mean a bear market at Grand Super Cycle degree though; Dow Theory makes no comment on Elliott wave counts. On the 25th of August 2015 Dow Theory also confirmed a bear market. The Elliott wave count sees that as part of cycle wave II. After Dow Theory confirmation of a bear market in August 2015, price went on to make new all time highs and the bull market continued.
DJIA: 23,344.52 – a close on the 19th of December at 23,284.97 confirms a bear market.
DJT: 9,806.79 – price has closed below this point on the 13th of December.
S&P500: 2,532.69 – a close on the 19th of December at 2,506.96 provides support to a bear market conclusion.
Nasdaq: 6,630.67 – a close on the 19th of December at 6,618.86 provides support to a bear market conclusion.
With all the indices having moved higher following a Dow Theory bear market confirmation, Dow Theory would confirm a bull market if the following highs are made:
DJIA: 26,951.81 – a close above this point has been made on the 3rd of July 2019.
DJT: 11,623.58 – to date DJT has failed to confirm an ongoing bull market.
S&P500: 2,940.91 – a close above this point was made on the 29th of April 2019.
Nasdaq: 8,133.30 – a close above this point was made on the 26th of April 2019.
Published @ 06:34 p.m. EST.
—
Careful risk management protects your trading account(s).
Follow my two Golden Rules:
1. Always trade with stops.
2. Risk only 1-5% of equity on any one trade.
—
New updates to this analysis are in bold.


DJIA at gap resistance. Do we get a rejection, or a head-fake higher to shake out the cubbies…?!
Posted before I saw Lara’s update…now we know…! 😀
Hello everybody!
Another update for you from Christchurch airport.
Minute (c) may need only a final fifth wave up to complete it tomorrow.
Thank you, Dame Lara…!
You guys on the site are soooo lucky to have such timely updates….use ’em why doncha?! 🙂
Heading back to the posse to see what Bryan and the crew’s got cooking.
Best of trading success everybody!!!
Watch NQ. If we get a turn today, it will likely happen there first….
TSLA is a BEAST!!!!!
What makes Silver a great trade is that it tends to lag other PMs after they have signaled what is ahead, letting you get in at a more favorable price point…the metal is coiling for a move higher….
Great R/R ratio on triple Q 220 puts expiring Friday Feb 14…current bid a measly 0.25…imagine that…! 🙂
It’s 30 minutes later, QQQ has only gone up in the interim, and 220 Feb 14 puts are at .77 to .79. per my thinkorswim quotes.
Feb 7 220 puts are on the other hand .21 to .22. So I suspect you were off a week there.
Yep! I knew that was too good to be true!
Mr. Market has not been giving us the luxury of VIX intra-day gaps to signal the start of C or third waves down. He has been cleverly deferring the big moves to the over-night session, making it tough to hop on board unless you trade ES. While I expect that theme to continue, the expected intensity of the next move down could see a change of pace in this regard, if you know what I mean…
Instead of adding to Friday’s position for 2.00 now bid, adding next Mondays contracts with second tranche for 2.25 per contract…
In hind-sight, NDX did signal the new ATH by not following the other indices to lower lows last Friday, as some of us noted…
So far as upside risk, an expanded flat “could” notch new index highs.
The first clue that this might be the pattern would be a move of VIX back below 15.00…(with a CLOSE above 3300.00).
p.s.
3300.00 Hi Oh…!!!!
These C waves are real head-spinners!
Keep in mind that they are also bull traps, so plan accordingly…!
BTW, they also tend to head straight up with little or no pull-back so it is hard to find a good entry once they break out of the gate….
Massive bull put spread deployed yesterday doing quite nicely.
Will start scaling out of short puts as we approach the close today….
Spec trade on a few SPY 329 puts expiring tomorrow for a buck apiece…..tiny trade..
Good morning.
More upwards movement required to complete the structure of minute b.
So far minute b may be a zigzag as labelled, but this is a B wave. It may also morph into any EW corrective structure and be more time consuming.
I’m super early today because I have an early flight back home. I’ve been on a final visit to my son in Invercargill, back home today to Coromandel.
If upwards movement can reach 3,325.46 then minor 4 may be a flat. If it can’t reach that point we may eliminate a flat. That leaves still a combination or triangle.
Yes , Oh Great Chart-Master…! 😀
Ooops…! Should that be Chart-Mistress??!!
Howzabout Chart-Meister…?!
SPX approaching the 3300 big roundie which just happens to be right where the 61.8% lies. As obvious a spot for a turn today as you can get. Lessee….
Okay, I shorted a little, Friday 330 puts, I don’t want to be the wallflower at this party…also sold a big SPY long with intention to buy it back (probably via UPRO) at a much lower price in a few days.
and exited b.e….”the force is strong with this market”
Just bought the same dude…!
Paid 2.30 for SPY 330 contracts 1/4 full load…
I will be adding at bid of 2.00….
Scaling in on counter-trend moves a good approach…
Oh, I may try again…but it’s still pushin’ up at the moment. Next high potential turn zone for me is 76-78% retrace level at 3315-18. Maybe not until tomorrow.
We know it is likely a terminal wave…don’t let the MMs push you around! 🙂
I don’t know that at all. It is only more probable, not certain by any means, and I have had my head handed to me too many times taking shorts against a strong market “expecting a turn”, only to have to exit later for large losses. I don’t do that anymore. Judicious entry on turns off high probability resistance levels, tight stops and discipline is my game re: shorts now. Each to their own. Enjoy the heat.
Haha! You know what they say about heat and the kitchen…!
I do have high confidence in the lady’s counts…. 🙂
Opening buy stop on UVXY 12 strike calls expiring this Friday for stop price of 1.00 even…
Ok not gonna lie, don’t understand …. bought TSLA puts yesterday for 3.00 and they just sold for 5.00. And the stock price is waaaaay up?
Yeh…I looked at the option chains yesterday and a lot of the puts were printing green. They are starting to build in premium into put options as they know what’s coming…the spread on put options are soon going to become prohibitive…
Use your option pricer: vol up, repo up
Be careful on the way down, it will be a totally symmetrical effect (vol down, repo strongly down as squeeze will be over) and you will not realize delta * spot variation, far from it…
Don’t say you are being arbitraged when this occurs. These are well understood technical effects.
Sounds to me like you subscribe to the “Efficient Market” theory…. 🙂
I find option traders & market makers to be fairly efficient, and I usually respect the price posted.
I may have a view on the parameters of a price, and trade options as a play on the Greeks, but trading options as a play on their mispricing has a losing bias, as LTCM traders remember fondly I’m sure.
Is this what you mean by “Efficient Theory”? My point is the price is always right and your trade only expresses a view on the factors of the price. In the case of TSLA, spot and vol are factors, but repo is very important as well.
That is quite interesting. My mission in making option trades is to find “mis-priced” options! 🙂
that’s insane…and awfully fortuitous!! well played…sort of!!!
I guess Musk gets his multi-billion $$$ bonus. Or does he? We’ll see where price is in a few weeks…
I’m not going to touch it. Call me chicken, but I don’t get close to wild animals…I’m here to make $, not gamble, and with that pricing, far too easy to be “right” and still lose!
NDX is up to a new ATH. RUT up 1.5% and EEM up 2.7%. All while gold is down over 1% and oil is bouncing up again off it’s lower support. Japanese yet future down strongly. Huge “risk on” day.
“Just” a B/X wave? I guess that’s canon, and probably right…SPX hasn’t yet retraced over 61.8% of it’s swing down yet for example. We’ll see!
While traders are chasing this gap higher, let’s get positioned for what’s coming next. No need to guess about an entry, as we will let Mr. Market tell us when to pull the trigger.
Opening buy stop order on tomorrow’s 325 strike puts with stop at 1.00 good for the day. If not filled today will move order to Friday’s contracts after looking at delta for best strikes…
The bull flag looked a bit funky owing to its duration but target was around 3300.00
325 puts for tomorrow currently bid at 2.53. A bid below 2.00 accompanied by any reversal signal would be a beautiful thing. Also looking at Friday expiration…
Now .40
Oops! I was looking at the wrong date…!
A LOT cheaper than I thought….
Rung the register on 325 calls for 3.75, eyeing 327 for tomorrow but waiting for a good entry…
Looks like a massive COIL developing on five hour time frame…hmmmnnn….!
You know what to do…! 🙂
Anybody watching the data feed on investing.com?
Wassup with those funky prints???!!!
Sold my ES contracts and backing up the truck to dump Vernes hot cakes and the open…
Holding in the money near dated calls makes market makers nervous if you are holding a lot of contracts. The crooks are so accustomed to stealing from retail investors by offering less than intrinsic value at expiration as they know most traders will not force them to go out and actually deliver the shares…you get my drift…
Lara provided a beautiful road map, as usual!
TSLA up another $99 premarket…unreal as it is now close to $1,000… Time to act?
I answered your question on January 30, 2020 at 9:14 am, with TSLA at $620, and I give you the same answer today, with TSLA at $1000.
There are a number of not very smart trades out there, the short TSLA is definitely one of them.
Excellent foresight! I need to get some of that …. licking my wounds
Understand the smart trading but looking at valuation (unless some one is pumping to squeeze shorts) you got to wonder why? But watching to pull the trigger as it will drop faster than it has gone up.
We all know how parabolic moves end…they return to their origin…no exceptions. TSLA is going to make a few smart traders millionaires…! 🙂
I know what you are thinking…”But how to time it???!!!” Right?
Easy, trace out the parabola on the right time frame and look for a break below the curve. It is extremely foolish to short a parabolic move before that happens. Once in a while price will clamber back inside the parabola but ultimately, a return to the origin is certain….
Hi Verne, interesting. Could you please provide an example with some pictures? I’m not sure I completely understand “tracing” parabola on the right time frame method. I’m sure you are not referring to Bollinger bands. And what time frame would you use to find and not miss that break? It’s interesting to learn this concept. Thank you
I am terrible at posting charts. For some reason the site always gives me an error message when I try to post a chart. Most charting platforms will automatically draw a parabolic curve for you around the price action, in either log of arithmetic scale. Should not be too hard. Just pull up a chart of TSLA and give it a try! 🙂
Investor imagination on TSLA is unreal and points to valuations much richer than AAPL and likes
Look at the graph of Volkswagen (VWA) between 2005 and 2009.
The pic on 28 October 2008 corresponds to the short squeeze when VWA became the priciest stock in the world.
What happened? VWA quickly lost about 35%, and then did about nothing until August 2009 when it lost 55% in 1 month.
The parabolic rise of Q3-2008 was only retrace in October 2009. It took 1 year, and the smart trade was the short in August 2009, not the short of the parabola.
When the squeeze unravels on TSLA, there will be plenty of time to place a good trade. Now is probably not the time.
Good data Arnaud, thanks. I see VWA also did a crazy spike in early 2018 from 10 to over 50 to 10 again!
If you bought the 324 or 325 SPY calls yesterday don’t mess around…sell ALL at the open and roll 1/4 of profits into 327 strike calls for this Wednesday. Manage new position by exit on a double or ES move back below 3280. A bit of a delay, but another beautiful triangle break… i love ’em!!!
Agreed and thank you
Peter S I have really enjoyed hanging around with you and the gang this past week. I just love to see traders jumping on real time trades and knocking down some sweet profits. I don’t think I have seen anyone doing it since the days when Olga and I was having riotus fun trading together on the site. Most welcome my friend…!
/RTY breaking the channel line to the upside.
Lots of possibilities from here.
That was a good overnight session!
Sweet! 🙂
#1
##2