Downwards movement was expected for Friday, which is exactly what has happened.
The pullback or consolidation continues as expected.
Summary: A pullback or consolidation is underway. It may continue now through to the end of next week and possibly a little longer. Support is expected to be about 3,153; but if this expectation is wrong, it may be too low.
Three large pullbacks or consolidations (fourth waves) during the next 1-2 years are expected: for minor wave 4 (underway), then intermediate (4), and then primary 4.
The biggest picture, Grand Super Cycle analysis, is here.
Last monthly charts analysis is here with video here.
ELLIOTT WAVE COUNTS
FIRST WAVE COUNT
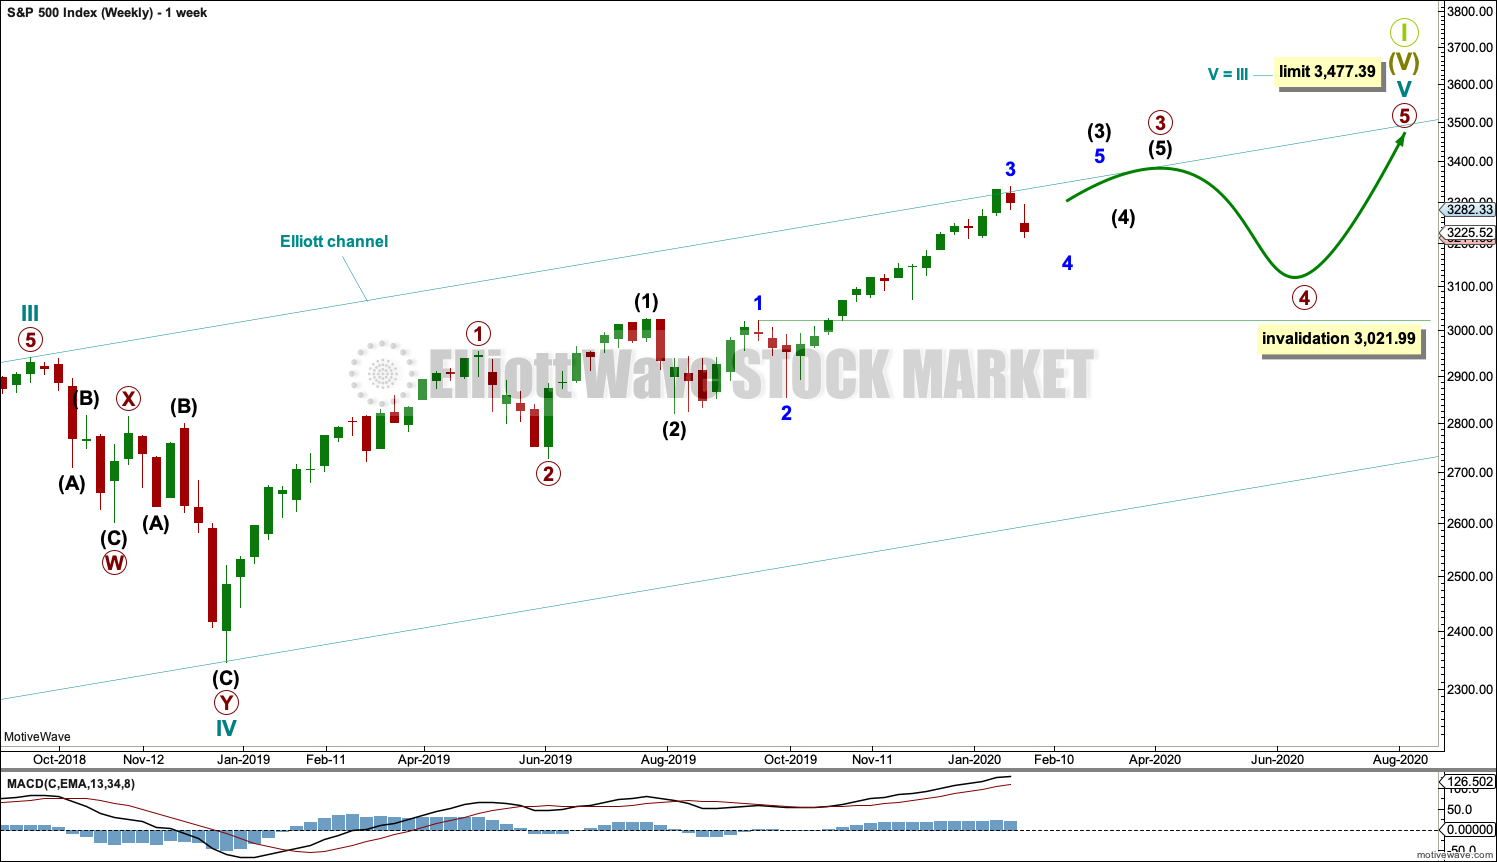
WEEKLY CHART
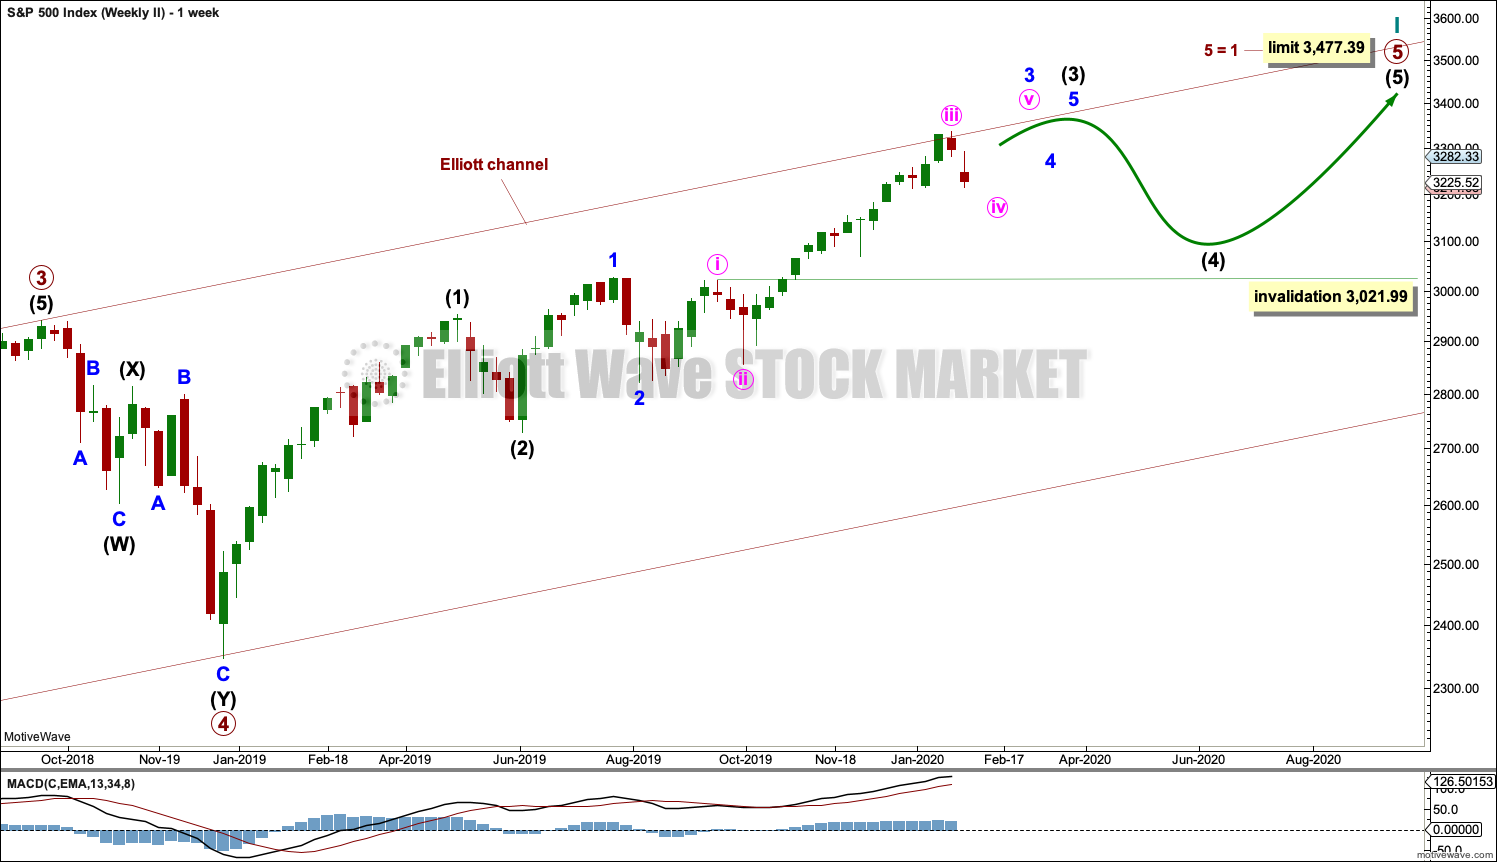
Cycle wave V may subdivide either as an impulse or an ending diagonal. Impulses are much more common, and it is clear at this stage that cycle wave V is an impulse and not a diagonal.
At this stage, cycle wave V may take another one to two or so years to complete.
A channel is drawn about the impulse of Super Cycle wave (V) using Elliott’s first technique. Draw this channel first from the high of 2,079.46 on the 5th of December 2014 to the high of 2,940.91 on the 21st of September 2018, then place a parallel copy on the low at 1,810.10 on the 11th of February 2016. Cycle wave IV found support about the lower edge.
Within Super Cycle wave (V), cycle wave III may not be the shortest actionary wave. Because cycle wave III is shorter than cycle wave I, this limits cycle wave V to no longer than equality in length with cycle wave III at 3,477.39. A new high by any amount at any time frame above this point would invalidate this main wave count in favour of one of the two alternate wave counts in the monthly chart analysis which are much more bullish.
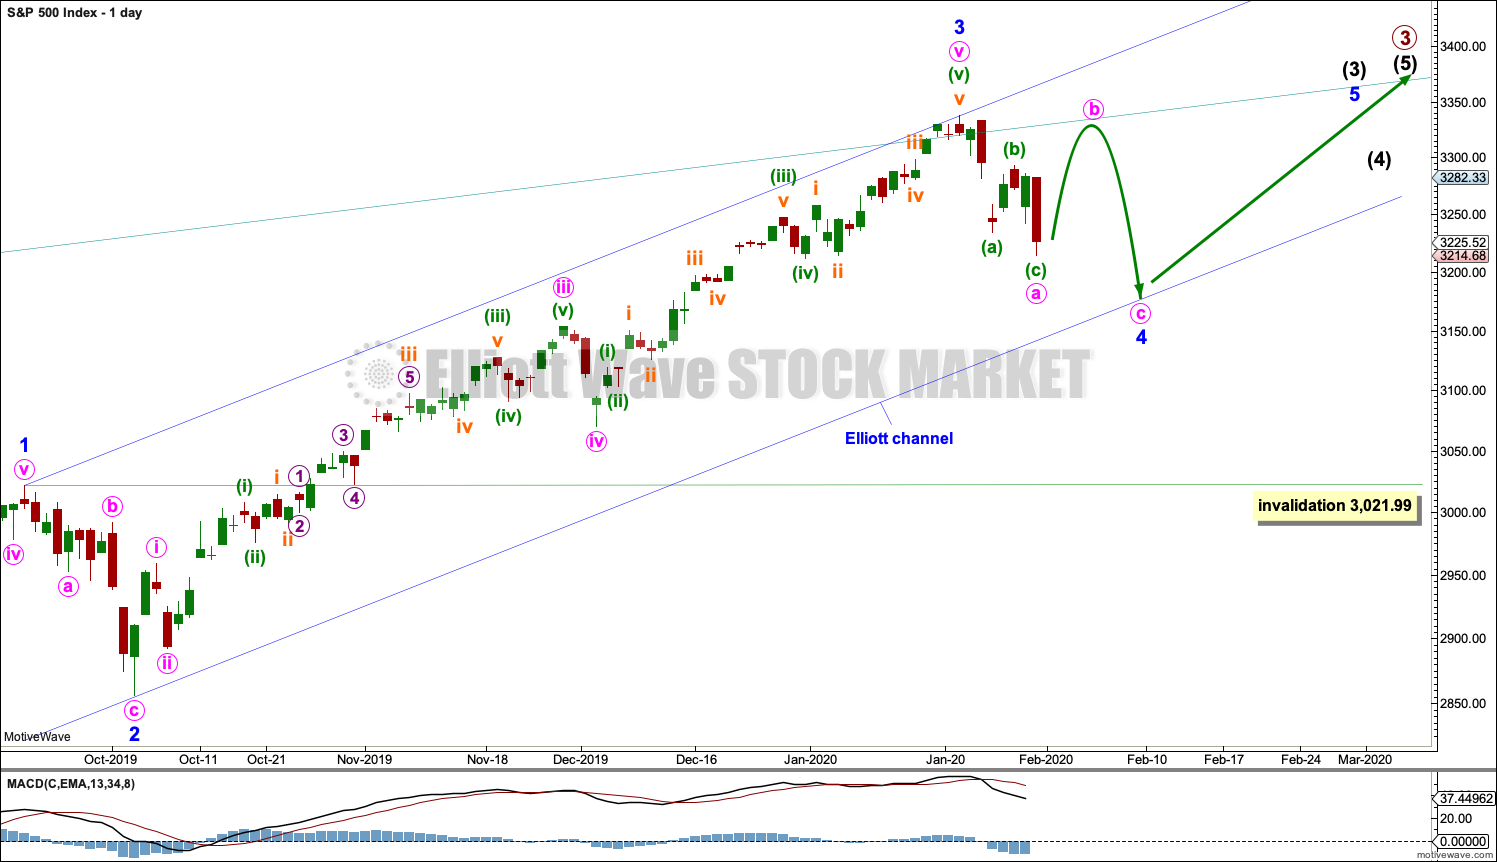
The daily chart below will focus on movement from the end of minor wave 1 within intermediate wave (3).
Within cycle wave V, primary waves 1 and 2 may be complete. Within primary wave 3, intermediate waves (1) and (2) may be complete. Within intermediate wave (3), minor wave 4 may not move into minor wave 1 price territory below 3,021.99.
Within cycle wave V, the corrections of primary wave 2, intermediate wave (2) and minor wave 2 all show up clearly on the weekly chart. For cycle wave V to have the right look, the corresponding corrections of minor wave 4, intermediate wave (4) and primary wave 4 should also show up on the weekly chart. Three more large multi-week corrections are needed as cycle wave V continues higher, and for this wave count the whole structure must complete at or before 3,477.39.
DAILY CHART
All of primary wave 3, intermediate wave (3) and minor wave 3 may only subdivide as impulses.
Minor wave 3 now looks complete.
Minor wave 2 was a sharp deep pullback, so minor wave 4 may be expected to be a very shallow sideways consolidation to exhibit alternation. Minor wave 2 lasted 2 weeks. Minor wave 4 may be about the same duration, or it may be a longer lasting consolidation. Minor wave 4 may end within the price territory of the fourth wave of one lesser degree; minute wave iv has its range from 3,154.26 to 3,070.49. However, this target zone at this stage looks to be too low.
Minor wave 4 may not move into minor wave 1 price territory below 3,021.99.
When minor wave 4 may be complete, then a target will again be calculated for intermediate wave (3).
When intermediate waves (3) and (4) may be complete, then a target will again be calculated for primary wave 3.
Draw an Elliott channel about intermediate wave (3): draw the first trend line from the end of minor wave 1 to the end of minor wave 3, then place a parallel copy on the end of minor wave 2. Minor wave 4 may find support at the lower edge of this channel if it is long lasting or deep enough. It is possible that minor wave 4 may breach the lower edge of the channel as fourth waves are not always contained within a channel drawn using this technique. If minor wave 4 breaches the channel, then it shall need to be redrawn using Elliott’s second technique.
Price has recently reached just above the upper edge of the wide teal channel copied over from monthly and weekly charts. A reaction downwards here increases the technical significance of this trend line.
Minor wave 4 may subdivide as any corrective structure, most likely a flat, triangle or combination. Within all of a flat, triangle or combination, there should be an upwards wave which may be fairly deep. That may unfold next week. If that expectation is wrong, then minute wave a may continue lower first.
HOURLY CHART
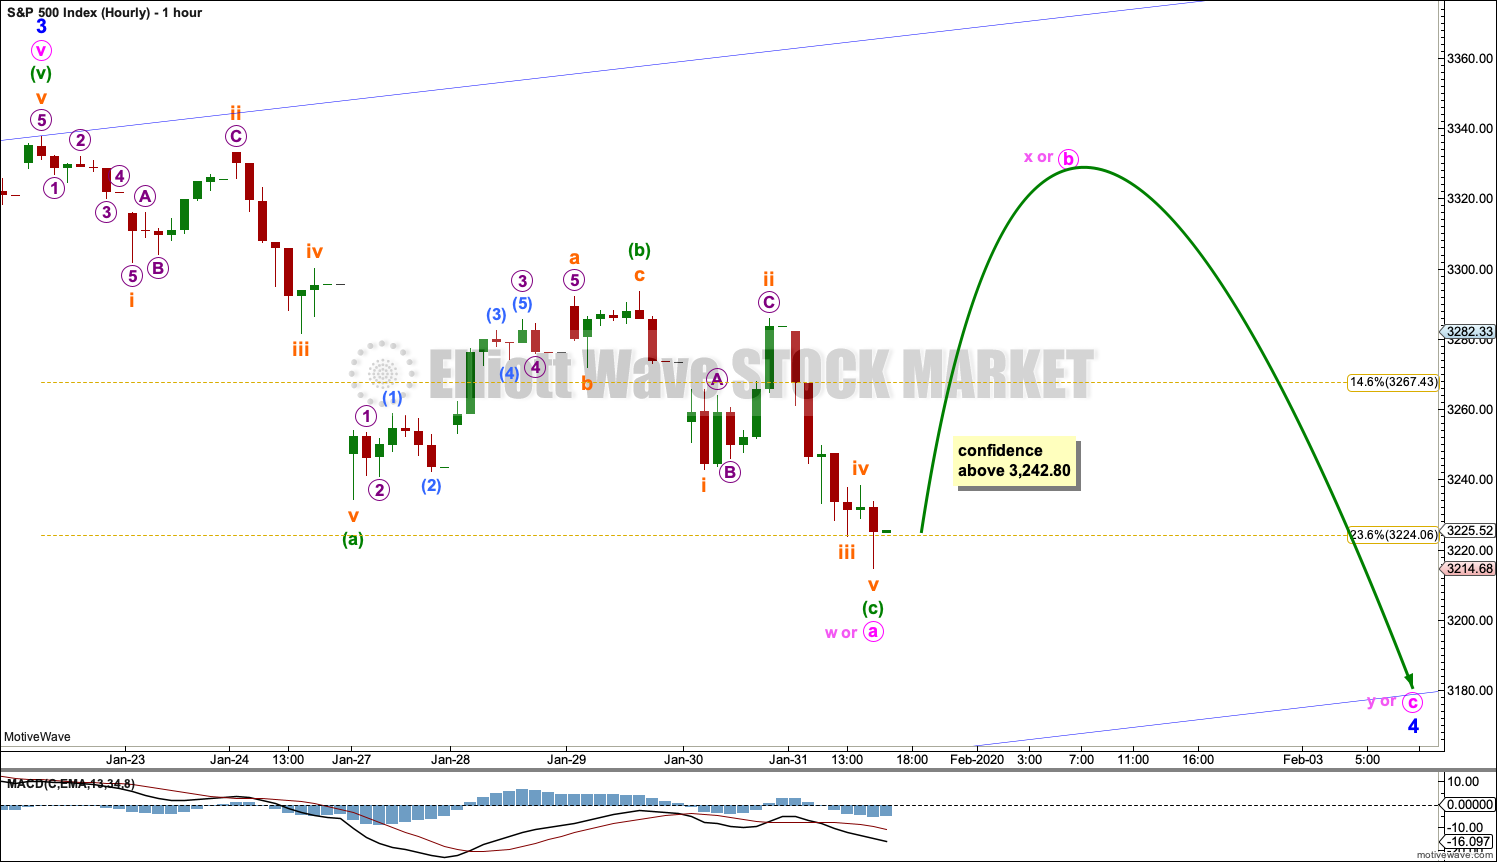
A zigzag downwards may now be complete, but at this time it is also possible that minute wave a may extend lower.
If the zigzag downwards is complete, then a three wave structure upwards may begin next week. This would be labelled minute wave b or x. If minor wave 4 unfolds as a flat correction, then within it minute wave b must retrace a minimum 0.9 length of minute wave a at 3,325.46, and it may make a new all time high as in an expanded flat. If minor wave 4 unfolds as a combination or triangle, then there is no minimum upwards requirement for minute wave x or b and either may make a new all time high.
B waves are the most difficult of all the Elliott waves to analyse. They exhibit the greatest variety in structure and price behaviour. Minute wave b may be a quick sharp bounce, or it may be a complicated time consuming sideways consolidation.
Minor wave 4 may end within the price territory of the fourth wave of one lesser degree. Minute wave iv has its range from 3,154.26 to 3,070.49. Within this range is the 0.382 Fibonacci ratio of minor wave 3 at 3,153.72. If this target range is wrong, then it may be too low.
ALTERNATE HOURLY CHART
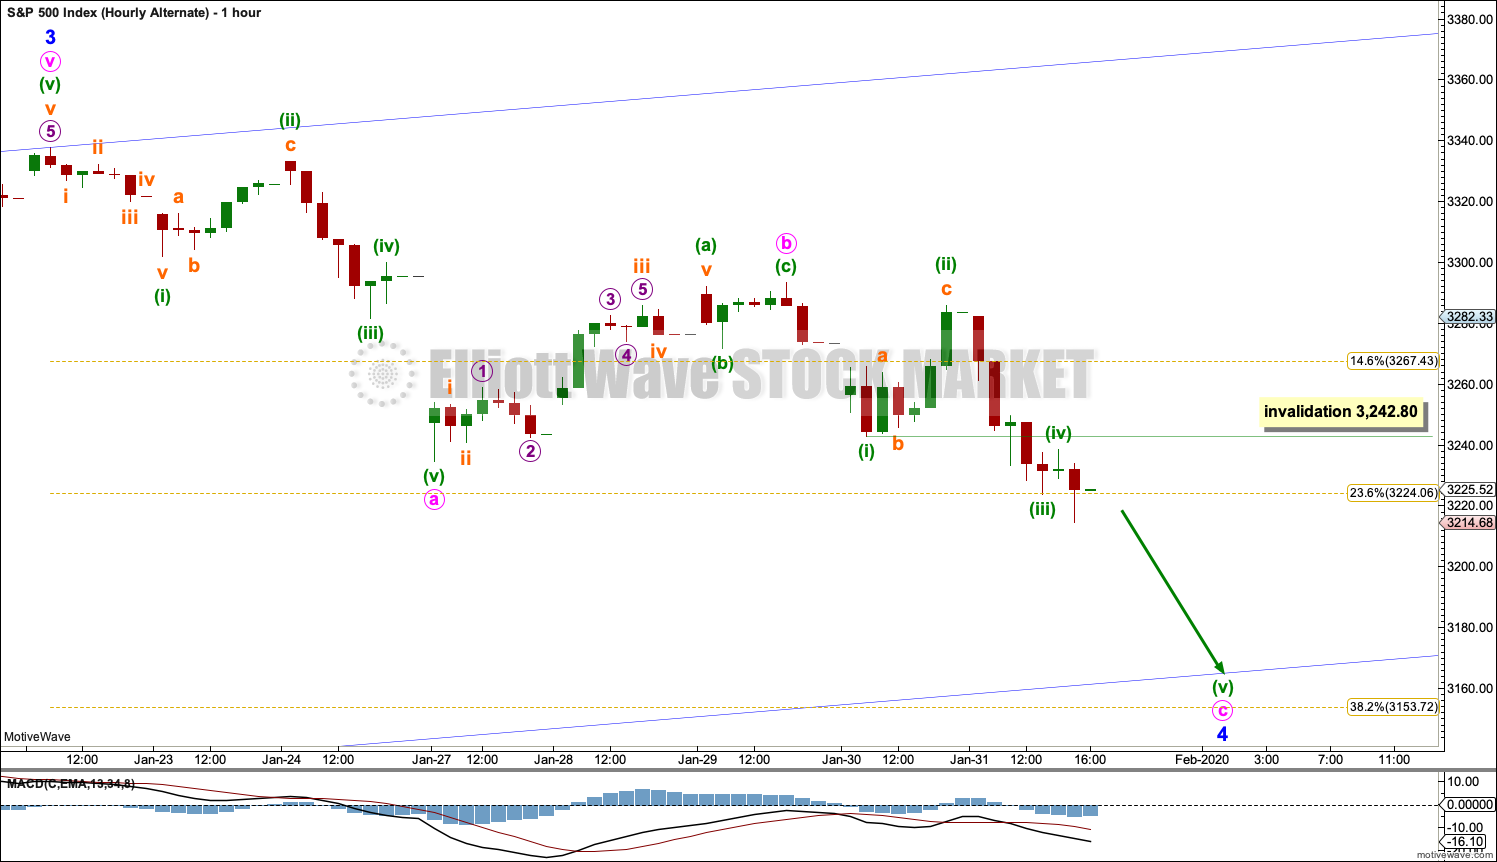
It is also possible that minor wave 4 may unfold as a zigzag and not exhibit structural alternation with the zigzag of minor wave 2. Alternation is a guideline and not a rule, and it is not always met. When alternation in structure is not met, then typically both the second and fourth waves subdivide as zigzags. Zigzags are by a wide margin the most common corrective structure.
If minor wave 4 is a zigzag, then within it minute waves a and b may both be complete. Minute wave c may be an incomplete impulse. Within minute wave c, minuette wave (iv) may not move into minuette wave (i) price territory above 3,242.80.
SECOND WAVE COUNT
WEEKLY CHART
This second wave count sees all subdivisions from the end of the March 2009 low in almost the same way, with the sole difference being the degree of labelling.
If the degree of labelling for the entirety of this bull market is all moved down one degree, then only a first wave at cycle degree may be nearing an end.
When cycle wave I is complete, then cycle wave II should meet the technical definition of a bear market as it should retrace more than 20% of cycle wave I, but it may end about either the 0.382 or 0.618 Fibonacci Ratios of cycle wave I. Cycle wave II may end close to the low of primary wave II within cycle wave I, which is at 1,810.10. It is also possible that cycle wave II could be fairly shallow and only barely meet the definition of a bear market.
The impulse is still viewed as nearing an end; a fifth wave is still seen as needing to complete higher. This wave count labels it primary wave 5. Primary wave 5 may still need another year to two or so to complete, depending upon how time consuming the corrections within it may be.
Primary wave 5 may be subdividing as an impulse, in the same way that cycle wave V is seen for the first weekly chart.
TECHNICAL ANALYSIS
MONTHLY CHART
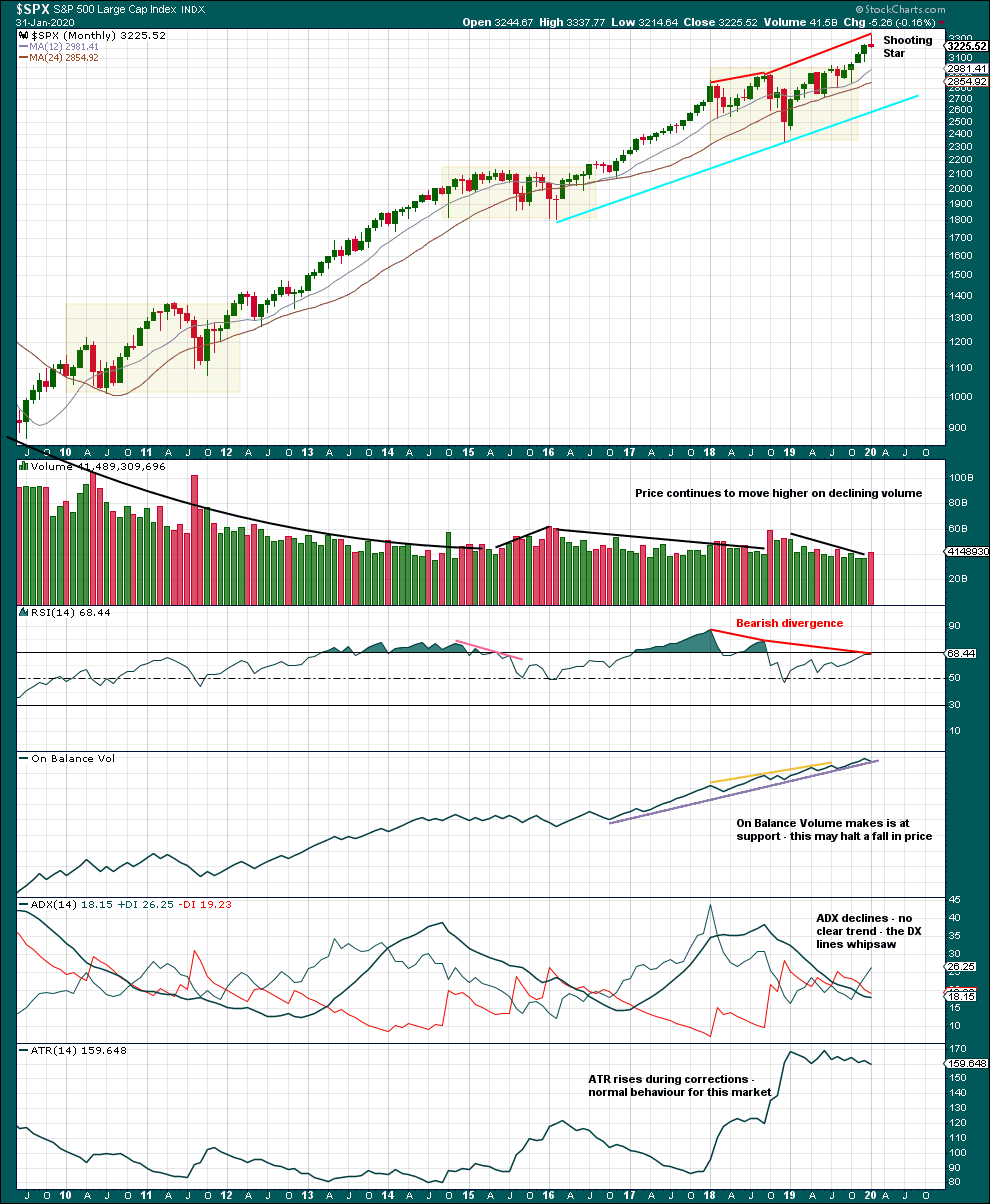
Click chart to enlarge. Chart courtesy of StockCharts.com.
Now that January 2020 is complete, this monthly candlestick may be analysed.
The Shooting Star pattern is a bearish reversal pattern when it occurs in the context of an upwards trend, as this one does. This suggests a normal curve down to back test support at prior resistance may have begun.
WEEKLY CHART
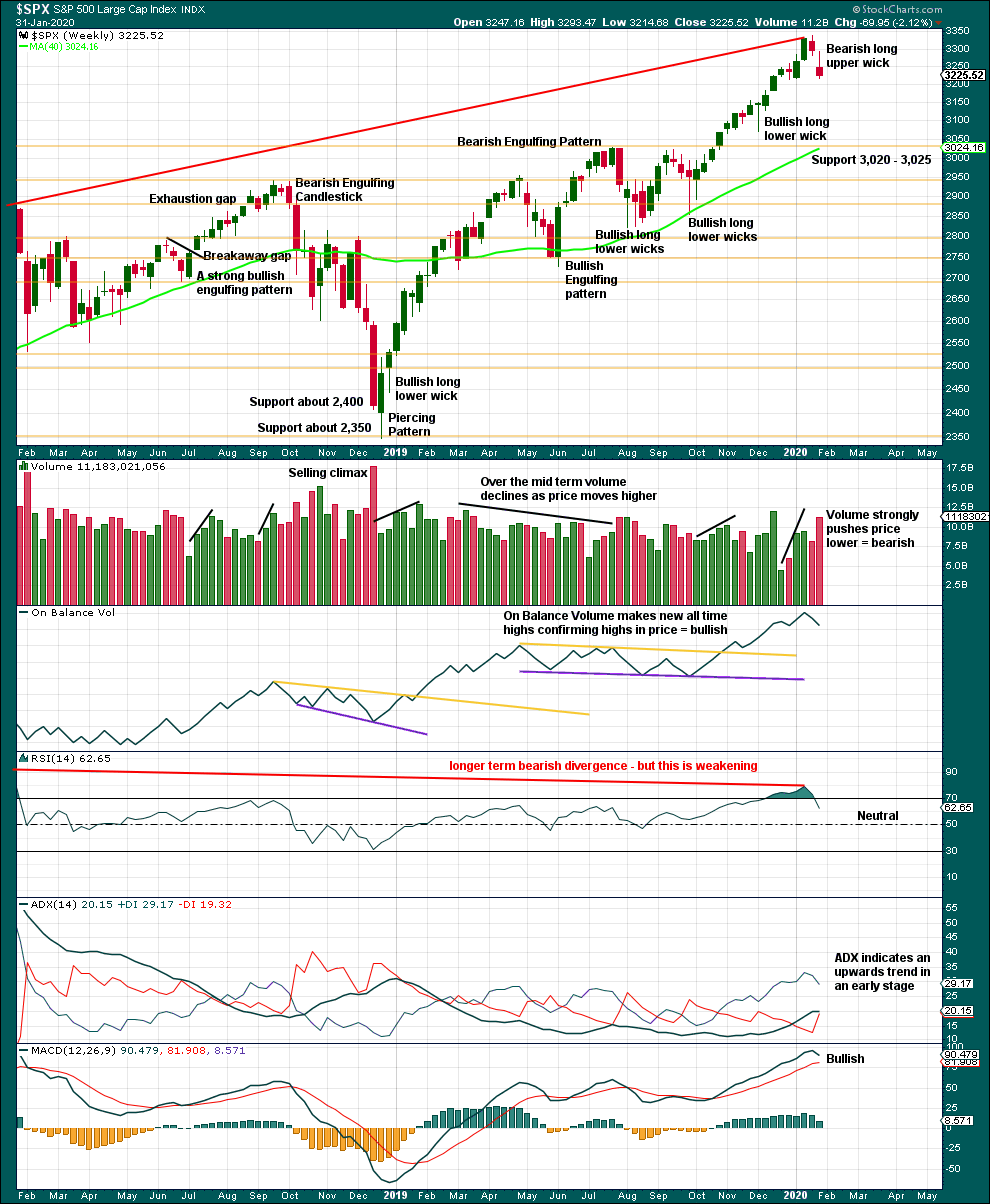
Click chart to enlarge. Chart courtesy of StockCharts.com.
It is very clear that the S&P is in an upwards trend and the bull market is continuing. Price does not move in straight lines; there will be pullbacks and consolidations along the way.
This chart is overall bullish. There are no signs of weakness in upwards movement.
A pullback or consolidation has begun. This is relieving extreme conditions. Look for strong support below about 3,020 to 3,025.
DAILY CHART
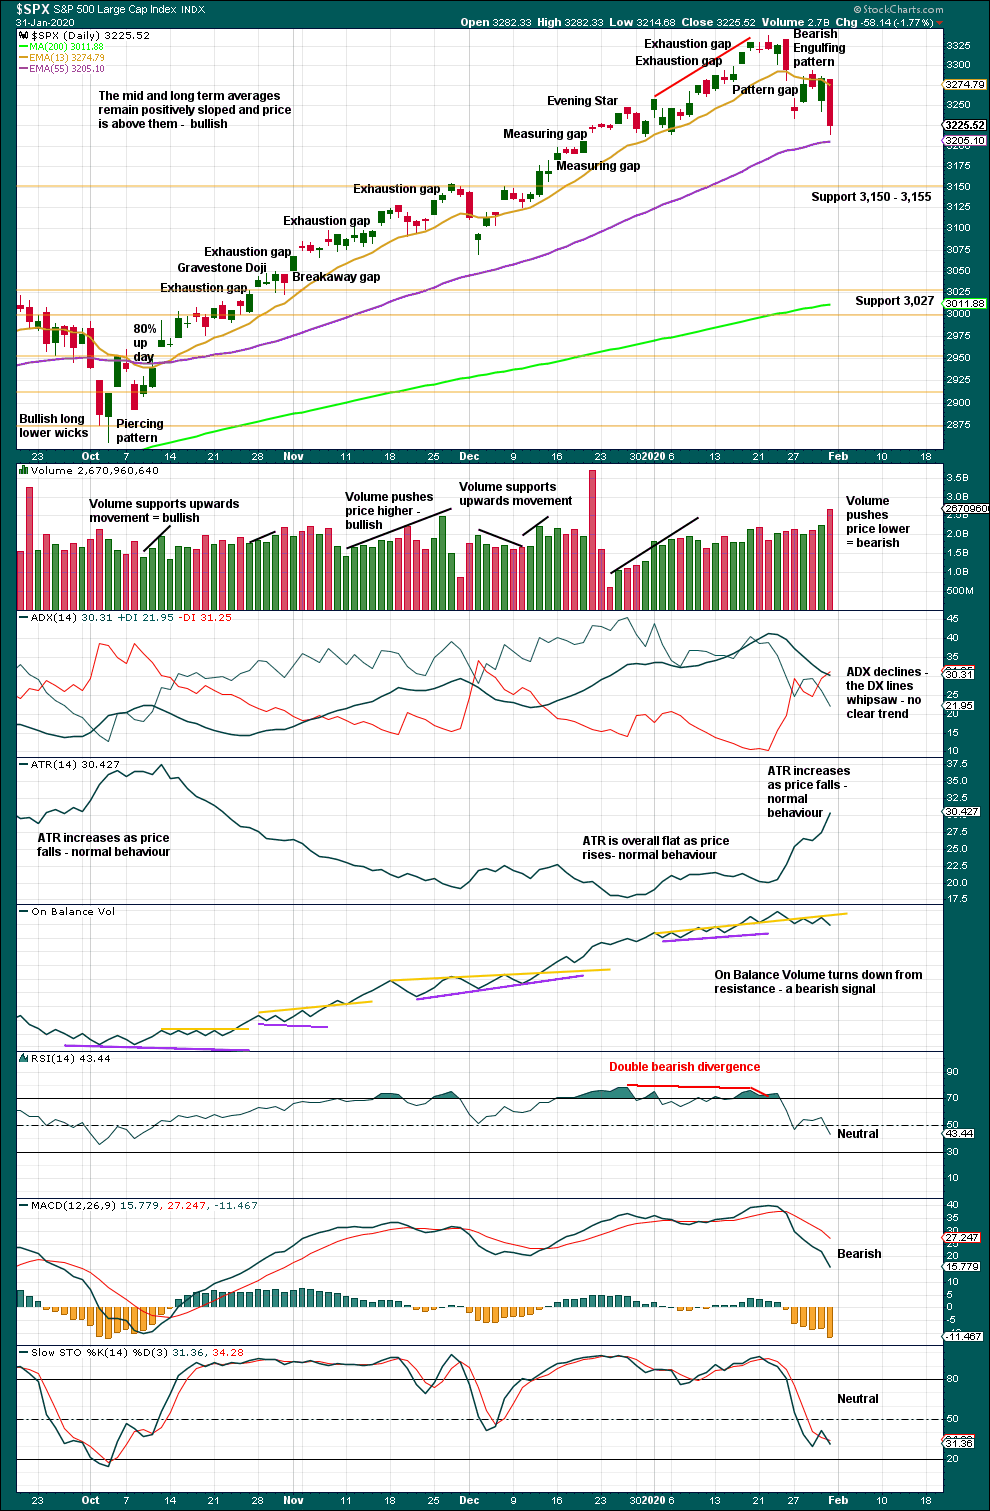
Click chart to enlarge. Chart courtesy of StockCharts.com.
The larger trend, particularly at the monthly time frame, remains up. Expect pullbacks and consolidations to be more short term in nature although they can last a few weeks.
In a bull market which may continue for months or years, pullbacks and consolidations may present opportunities for buying when price is at or near support.
Price is not yet at support and Stochastics is not yet oversold. Next support is at 3,150 to 3,155.
Sustainable lows may be identified by a 180° reversal of sentiment in a 90% down day followed by one or more of the following things:
– Either a 90% up day or two back to back 80% up days within 3 sessions of the 90% down day.
– RSI may reach oversold and then exhibit bullish divergence.
– A strong bullish candlestick pattern with support from volume.
In the absence of bullish reversal signs, expect the pullback or consolidation to continue.
BREADTH – AD LINE
WEEKLY CHART
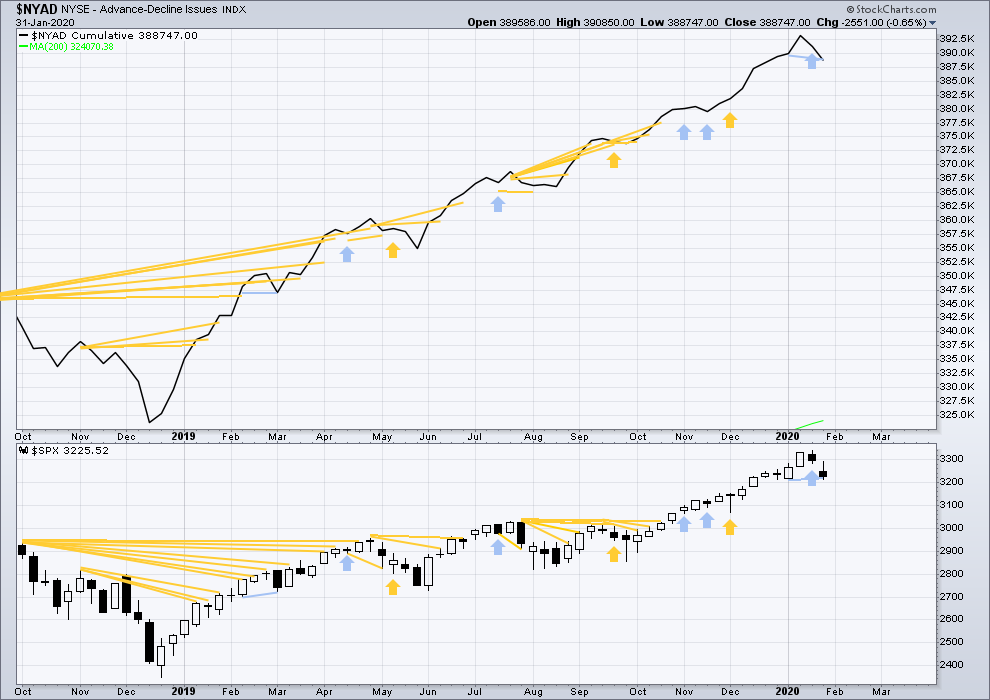
Click chart to enlarge. Chart courtesy of StockCharts.com. So that colour blind members are included, bearish signals
will be noted with blue and bullish signals with yellow.
Bear markets from the Great Depression and onwards have been preceded by an average minimum of 4 months divergence between price and the AD line with only two exceptions in 1946 and 1976. With the AD line making new all time highs last week, the end of this bull market and the start of a new bear market is very likely a minimum of 4 months away, which is mid May 2020.
In all bear markets in the last 90 years there is some positive correlation (0.6022) between the length of bearish divergence and the depth of the following bear market. No to little divergence is correlated with more shallow bear markets. Longer divergence is correlated with deeper bear markets.
If a bear market does develop here, it comes after no bearish divergence. It would therefore more likely be shallow.
This week both price and the AD line have moved lower. Downwards movement has support from declining market breadth. The AD line has made a slight new low below the short-term low three weeks prior, but price has not but only by 0.04 points. This divergence is bearish, but it is very weak. The important point to note is that it is not bullish.
Large caps all time high: 3,337.77 on 22nd January 2020.
Mid caps all time high: 2,106.30 on 17th January 2020.
Small caps all time high: 1,100.58 on 27th August 2018.
For the short term, there is a little weakness now in only large caps making most recent new all time highs.
DAILY CHART
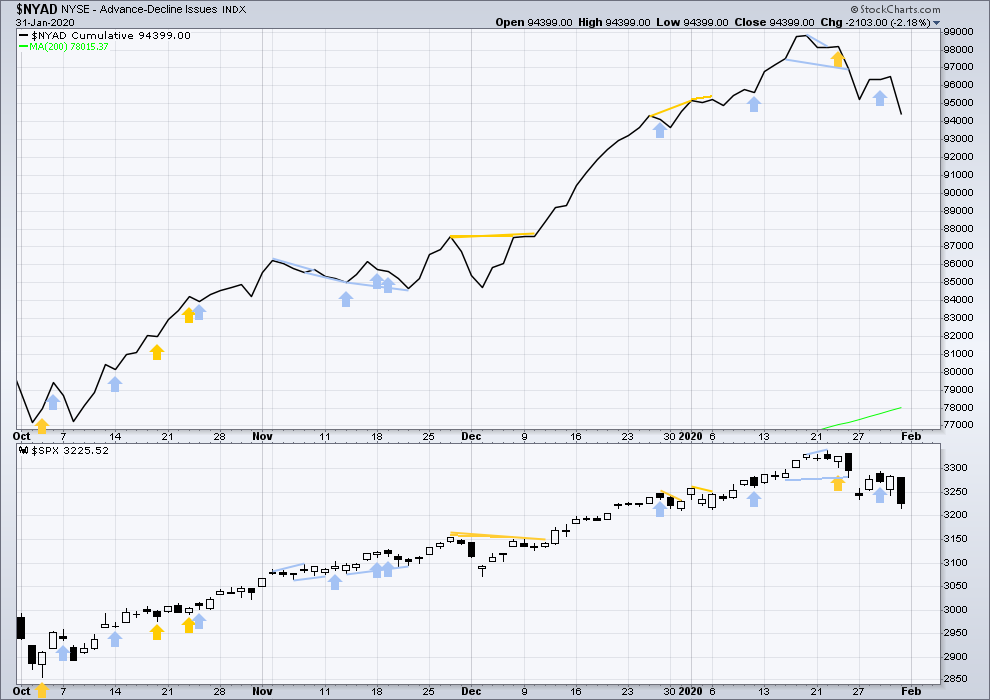
Click chart to enlarge. Chart courtesy of StockCharts.com. So that colour blind members are included, bearish signals
will be noted with blue and bullish signals with yellow.
Breadth should be read as a leading indicator.
To end the week both price and the AD line have moved lower. There is no new short-term divergence. Falling price has support from declining market breadth, which is bearish.
VOLATILITY – INVERTED VIX CHART
WEEKLY CHART
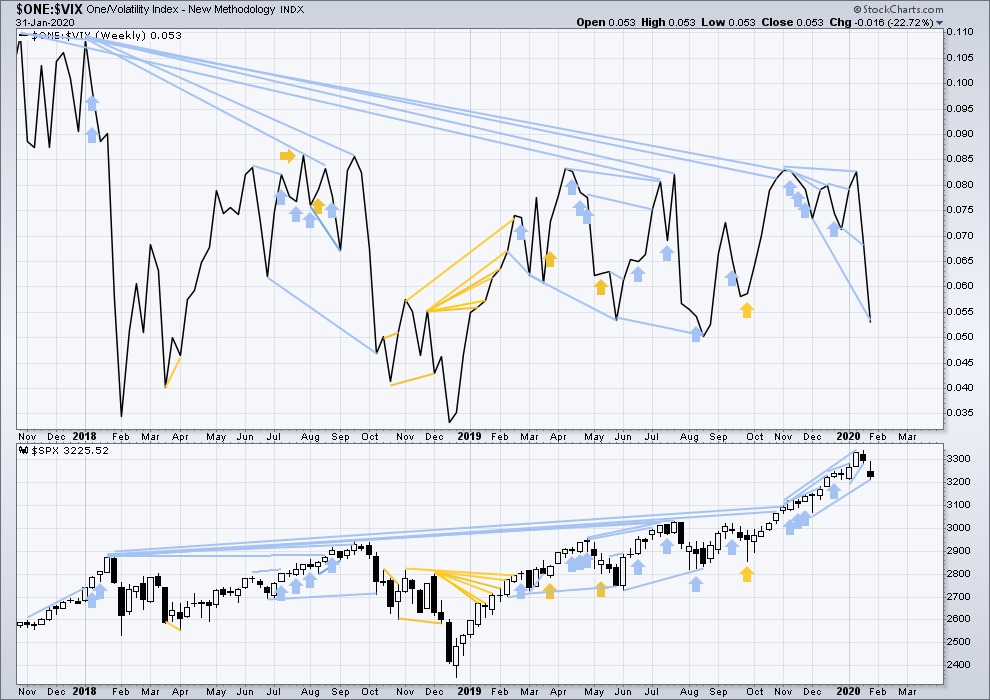
Click chart to enlarge. Chart courtesy of StockCharts.com. So that colour blind members are included, bearish signals
will be noted with blue and bullish signals with yellow.
The all time high for inverted VIX was on 30th October 2017. There is now over two years of bearish divergence between price and inverted VIX.
The rise in price is not coming with a normal corresponding decline in VIX; VIX remains elevated. This long-term divergence is bearish and may yet develop further as the bull market matures.
This divergence may be an early warning, a part of the process of a top developing that may take years. It may is clearly not useful in timing a trend change from bull to a fully fledged bear market.
This week both price and inverted VIX have moved lower. Inverted VIX is falling faster than price. It has made a new mid-term low below the prior low 8 weeks ago, but price has not. This divergence is bearish.
DAILY CHART
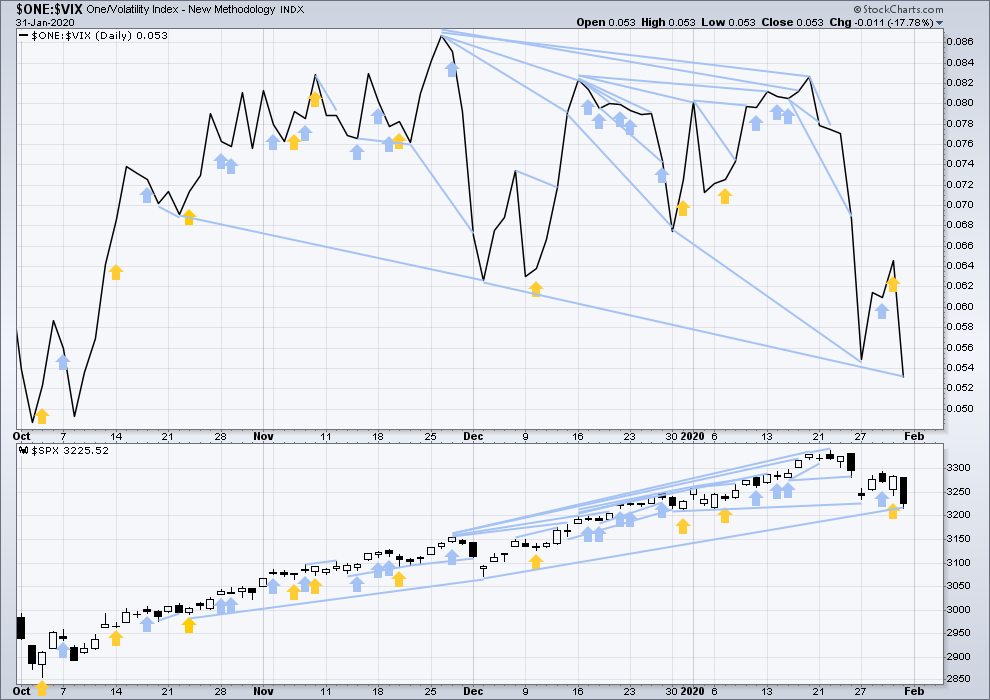
Click chart to enlarge. Chart courtesy of StockCharts.com. So that colour blind members are included, bearish signals
will be noted with blue and bullish signals with yellow.
Both price and inverted VIX have moved strongly lower. Inverted VIX has made a strong new low below the prior low of the 23rd of October, but price has not. This divergence is bearish.
DOW THEORY
Dow Theory confirmed a bear market in December 2018. This does not necessarily mean a bear market at Grand Super Cycle degree though; Dow Theory makes no comment on Elliott wave counts. On the 25th of August 2015 Dow Theory also confirmed a bear market. The Elliott wave count sees that as part of cycle wave II. After Dow Theory confirmation of a bear market in August 2015, price went on to make new all time highs and the bull market continued.
DJIA: 23,344.52 – a close on the 19th of December at 23,284.97 confirms a bear market.
DJT: 9,806.79 – price has closed below this point on the 13th of December.
S&P500: 2,532.69 – a close on the 19th of December at 2,506.96 provides support to a bear market conclusion.
Nasdaq: 6,630.67 – a close on the 19th of December at 6,618.86 provides support to a bear market conclusion.
With all the indices having moved higher following a Dow Theory bear market confirmation, Dow Theory would confirm a bull market if the following highs are made:
DJIA: 26,951.81 – a close above this point has been made on the 3rd of July 2019.
DJT: 11,623.58 – to date DJT has failed to confirm an ongoing bull market.
S&P500: 2,940.91 – a close above this point was made on the 29th of April 2019.
Nasdaq: 8,133.30 – a close above this point was made on the 26th of April 2019.
Published @ 12:52 a.m. EST on February 1, 2020.
—
Careful risk management protects your trading account(s).
Follow my two Golden Rules:
1. Always trade with stops.
2. Risk only 1-5% of equity on any one trade.
—
New updates to this analysis are in bold.

Back tomorrow for one more day in the trenches…have a great evening all!
Looks like we needed a sub-min C down….
That was quick…!
Here we go…!
Scrapping 324 strike order, buying 325 calls for 1.59 instead, one half full position.
Buy stop order for second half on 1.75 bid….
Opening order to buy SPY 324 calls for this Wednesday for 2.00 or better. Should get a fill with a bit more downward movement, as current bid 2.15….
Looking like a b wave triangle…expecting upward break for a C wave to finish correction per Lara’s update. It should be another sharp, swift thrust.
Opening massive “stink bid” for Wed SPY 325 strike puts for 1.75 or better……
You think C wave will start before Wed? Is that why you are buying Wed 325 puts?
If minuette C does not start today will change to Friday options…I also expect to not be filled until the C up reaches upside targets for those contracts so Mr. Market will tell me if I need to go out to farther expiration….looks like a contracting B wave triangle almost done…
Great news to hear anti-viral HIV drugs apparently being used to effectively treat coronavirus. Let’s hope they can get this swiftly contained…!
Buying back short 324 strike calls expiring today for 0.60….waiting to see if a re-deploy of 323 strikes worth the risk/reward….will sell 10 contracts if we move below 324 with conviction….namely, a fat red candle….
Hourly chart updated:
How high this bounce may begin to indicate which structure minor 4 may be. If it meets the 90% requirement for a flat then all possibilities remain open, if it does not then a combination or triangle remain open.
Seems like with this count the minor 4 will run a bit on the long side in time relative to the minor 2. I’m wondering…is it possible this is a zig-zag of the form 5 wave a (as marked above), complete 3 wave b (as marked above)…and now an ENDING DIAGONAL c down???
The time length of 4th waves relative to 2nd waves varies. Sometimes, perhaps even frequently, the 4th wave is more complex and longer lasting than the counterpart 2nd wave. Triangles would be a good example. Their purpose is not necessarily to retrace price movement. Rather, they often slow things down a bit after a strong 3rd wave.
Minor 2 was about 9 or 10 days. Minor 4 is in its 7th, I think. Another 5 or even 10 days might not give us a ‘poor or improper’ look. JMHO.
Agreed.
That all said, we are in the heart of a major secular bull market, as I do believe someone said “surprises will be to the upside”. So just trying to think about what might the next “surprise”!! The action since the b wave has been strongly overlapped and looking rather ending diagonal-ish to me, and in such a model has already completed a, b, c, and d. All it would take is an ending e down I believe. But that still could be just a first higher order “3” of a larger correction, as well. Corrections are always mixed up affairs…until they are done!
Surprised you think so as we have not had a full week as yet. If the current triangle completes this or next session the C wave could complete by Wednesday methinks….
No, I don’t “think so”. I speculate about alternatives, pretty much always.
Here’s yet another alternative that I think has some potential, for example.
Got it!
TSLA long tail candle….. doubled up my short, last try for the day
Noted
I’ve got 25 contracts left of SPY 326 calls and going to roll the dice ( I don’t recommend it) by selling 324 strikes expiring today just for giggles…. (house money anyway!) 324 srtikes are going for a buck. Now watch the wily MMs jack price up past 3260…lol!
Bull flag no longer has a good look. I think we are seeing something else.
Is Mr. Market going to throw an annoying (for most) triangle at us…?!
Lol!
Every time you say something is unlikely what does Mr. Market do?
Looks like we will test that gap after all…figures! 🙂
They might fill that gap several days later when they come back in minute wave c down after finishing minute b. My guess
Opening 312.50 x 313 bull vertical put spread expiring Feb 14 for 0.20.
Plan is to exit short leg at break even…
Looks like a bull flag with upside target just over 3300 for SPX, which should satisfy re-tracement level for a flat correction
The correction story in RUT. The black line angling up off the low is a projection of the largest up swing through the corrective down swing (“bullish symmetry”). I’m looking for both a channel break and that level to be busted, so above 1644 and I think the long side is activated. However, price didn’t quite make it to the target zone of the prior correction on one lower degree, so maybe there’s more downside remaining, consistent with an expectation that SPX isn’t finished correcting either.
Though getting above the bomb of Fibonacci resistance and prior pivot resistance at/just above 1650 will be a much higher probability buy trigger; that resistance has high potential to turn RUT back down for at least a bit, and maybe more, despite a channel break.
great follow up to your chart below
If we in a small fourth we will make a new high which I think will complete an “A” up of a larger corrective move. Depth of retrace could tell us what pattern likely to be unfolding….
Another safe entry trigger for the short side is today’s open gap. I have a sneaking suspicion that they are not going to fill it during the cash session….
Do you mean anywhere below today’s open at 3235 would be a safe short bet?
While unlikely, gap could provide support on any move back to test it. I like to see a gap firmly filled on a closing basis….
Selling another 1/4 for 0.50….
Chuckle!
Looks like I moved the market just a tad. Bid just jumped to 0.33 on fill…..
Unloaded half for quick scalp…
If we are in a flat, SPY 326 calls expiring today horribly mis-priced.
Have the market makers lost their minds??!
Of course there’s no guarantee they will actually fill you @ 0.20
TSLA now hitting $670ish target…hmmm decision time…
I’m gonna short against this last hourly candle….. good luck !
You just might be bit early…but hang in there…! 🙂
p.s. The C down is going to be sharp so we should see a VIX gap higher on the turn….
are you talking TSLA here?
TSLA’s upward momentum and price is INSANE. Up ANOTHER 14% TODAY????
Lol!!!! 746…and climbing!!! Extreme speculative mania.
We haven’t seen anything quite like this since what, AOL back in 2000? Talk about a blow off top that just doesn’t stop blowing.
If we are going to get a flat for minor four, we have to retrace at least 90% of A down.
I think this means we see price move past 3250 shortly after the open….
How would you play it if this correction becomes a triangle that lasts a few weeks? I grabbed a few ES contracts Friday with a stop at the low…
You would pretty much have to day trade it. I love trading triangles as more often than not you know what direction they will break and you can take a bigger than usual position on a high probability trade. A contracting triangle is probably the easiest to track. A running or barrier triangle can be quite tricky to trade profitably, unless you are extremely nimble and execute small scalping trades. If it looks to be developing into a triangle I will probably just load up on spreads to harvest premium and wait for the break….
Just broke 3242.80 – I guess we are in the main count
Deepest of condolences to Kevin and Rod!
Niners needed more “Wampum” hehe!
Unreal to leave receivers open when machines is trying to make 3rd down and 15 yards. Well, I am sure they will be back again (49ers) in next few years.
Well, 49’rs went from almost worst to 2nd best in one year! A bad Q4, otherwise a well played game, but Q4 is no time to have a bad quarter against KC!!! Next year we get #6…
I am happy for Andy Reid. He was the best NFL coach without a Superbowl win. Now he has cemented his legacy. I thought the 49rs would win. But my heart was with Andy Reid. The 49rs were out coached in the 2nd half. The Chiefs went to a 4-4 defense and were able to contain the 49r’s running attack. This was the deciding move that won the game.
Maybe. Maybe the 49er’s should have kept running anyway. It was sure working in the 3rd quarter!! Oh well, can’t re-run the experiment. Yes, nice that Reid got a SB victory. And sad that the 49’ers miracle season came up a $ short.
Has anyone taken a look at Nasdaq vs SPX and DJIA recent divergence?
I was curious about under-performance of Triple Q trades last week and took a closer look at the charts, and voila! NDX did indeed fail to put in a new low on Friday.
RUT futures with overnight data (/RTY). Watching for the channel break.
Now this is excellent data! Thank you Kevin.
As a physician I have many “updates” and “guidelines” available to me…
1) the HIV and Chinese spy connections are currently unsubstantiated
2) yes, get the flu shot
3) where’s Ari?
4) I really enjoyed the half time show, and won my prop bets: J lo showed “butt cleavage” and they both “twerked” …. hips don’t lie !
I have contacted a few PIs to try and get some original micrographs and with permission will share. Unsubstantiated and disproven are not the same thing so keeping an open mind on this one…
Looks like first wave down complete per Lara’s main count. Playing corrective bounce with SPY 325 strike calls for Wed Feb 5 for 2.00 or less when cash session opens.
If bid higher will trade 326 strikes. Option contracts should double so will roll HALF position to 327 strikes on 100% gain.
Will also deploy Friday expiration 302 x 302.50 vertical bull put credit spread to reposition during corrective wave up. Lock & Load!
Thank you Verne
Another interesting take on coronavirus from Dr Lyons-Weiler, hot off the press…!
https://principia-scientific.org/on-the-origins-of-the-2019-ncov-virus-wuhan-china/
Friday turned to be a “bad day to be absent” re: missed opportunity. But once in a awhile other commitments come up. Drat! Here’s to a solid bottom of the minor 4 upcoming and a great chance to get significantly long again.
Oh and did I mention…GO 49rs!!! I’m hoping Mr. Mahomes gets some up close and personal introduction to Mr. Bosa and friends…
Welcome back Cotter. And of course, GO 49rs!! I got bad news last week as FOX and DISH (my current satellite TV provider) have a dispute going on. As a result, the local FOX channel is off the air and I will not be able to watch the Superbowl. If I miss it, it will be the first time since inception. I have watched every Superbowl including #’s 1 & 2 when they were called World Championships.
I hope my ‘fix’ works. I have downloaded the FOX Sports App and been given ‘permission’ by DISH to watch the Superbowl on that channel. No recording, ff , rewind or pause, though. I wait with anxiety.
But, Go 49rs!
The more I read about coronavrius the more interesting it becomes. Apparently N9 masks are ineffective as one transmission mode is through the eyes!
With an 85% infection rate on exposure this is quite significant.
Please be careful if traveling to areas of infection!
Another post coming after moderation with more interesting developments…
The most common entry point for all viruses is “through the eyes”, which really means through the tear ducts. Which is why both washing hands frequently and not touching your face with your hands has high efficacy for avoiding viral infections.
I did not know that! I would gave guessed oral or air-borne…
I suppose the key point is that non- DCT modes of infection are more deadly…
The seasonal flu kills 1/4 to 1/2 MILLION people a year. Coronavirus has killed what, 500 people? This isn’t even a significant news event yet folks. There could be headlines every year saying “100,000 dead of flu!!!”, and they would be correct. Yes, the flu kills (particularly the very old and those who are particularly weak for whatever reason; age, nutrition, other illness, etc).
So far, the real coronavirus story is one of how the media hypes a minor situation to sell product. It’s an easy story to blast headline on and get eyeballs that are the basis for $$$ income.
Coronavirus is not manufactured, it’s a recent crossover from the animal kingdom that is probably a function of the live animal markets in many places in the world including China. It’s mortality rate on infection is high (2%; from what I can find, nominal seasonal flu viruses run more like 0.5%), but far lower than SARS (8%). The numbers of people it has infected aren’t all that high either. Obviously, to kill up to 500,000 people in a year, the seasonal flu must and does infect many hundreds of millions every year.
Don’t buy into the coronavirus hype. Wash your hands a lot and don’t touch your face, just like every flu/cold season. Ignore the media hype nonsense and the conspiracy theories. A flu as a bioweapon? Use your logic and think about that; it’s not controllable so it will infect your own population too, and the mortality rate is extremely low, so what are you accomplishing? It’s silly even before considering there is not a shred of evidence to support such a claim.
Coronavirus is just another flu, a bit more deadly than most but nowhere close to a few flu viruses of the past, and has infected and killed very few so far. That’s the story, and it’s hardly warrants daily headlines. But hey, FUD sells.
Exactly Kevin.
Also, face masks that you can buy from a pharmacy / drug store or hardware store will do nothing to stop a virus. Viruses are microscopic and will easily pass through those masks just like air.
They’re a waste of time and money.
A few years ago Lara posted a fascinating article about bear markets and epidemics/pandemics. It would be great to re-read if still available.
Not much is being reported about the locust swarms in Africa but this has the potential, coupled with the coronavirus running wild in China, to be a real game-changer.
I know some might be quick to dismiss the possibility of the coronavirus being some kind of bio-warfare weapon but I am keeping an open mind and not at all prepared to dub it some kind of “conspiracy theory”
Not only do we have the fact of that P4 pathogen research lab in Wuhan , there are now reports of peculiar features of the viral structure.
https://www.zerohedge.com/geopolitical/coronavirus-contains-hiv-insertions-stoking-fears-over-artificially-created-bioweapon
Zero hedge twitter account suspended ….hmmm
Hi Lara:
I was always under the impression that A and C waves had to be five wave structures!
I learned something new !
Great charting, as usual!
Why, thank you Verne 🙂
Only in a zigzag do both A and C need to be fives.
In a flat, A needs to be a three.
In a triangle all the sub-waves need to be threes.
Aha! 3,3,5, for flats, 5,3,5 for ZZs, but of course!
Even old dogs…!
After Verne helping set up some nice short trades, I am currently out of any significant positions…. thank you sir !
See y’all Monday
Also, a very interesting signal from CiovaccoCapital yesterday, check it out
😉
What do you know? #1 for the weekend once again. Goodie for me.
Blessings on everyone’s weekend.
Looks like we are setting up for exciting week or two…