A small range inside day leaves all Elliott wave counts unchanged.
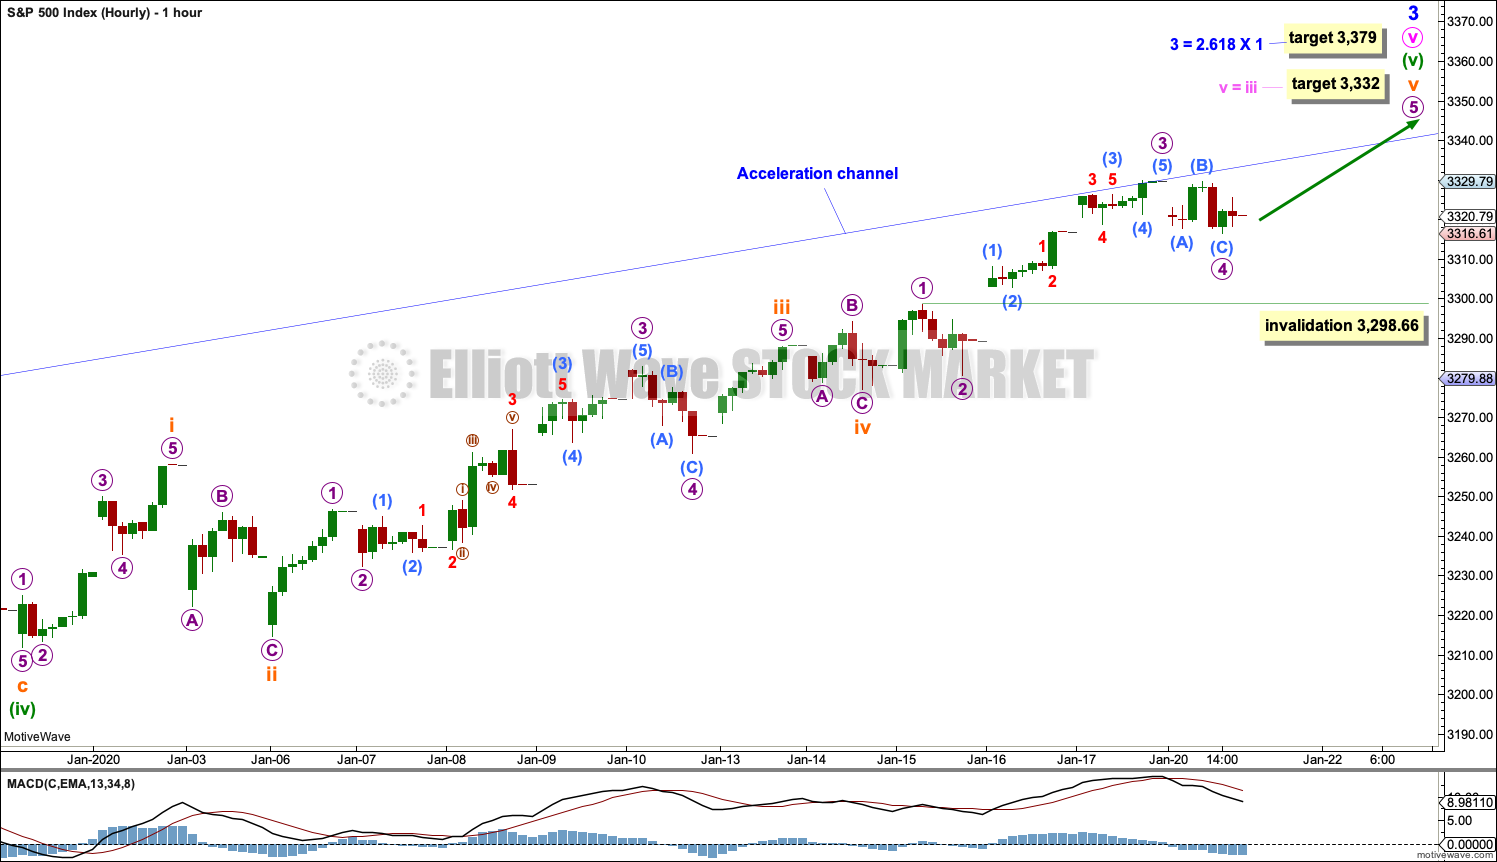
Summary: The next target is at 3,332 and thereafter 3,379.
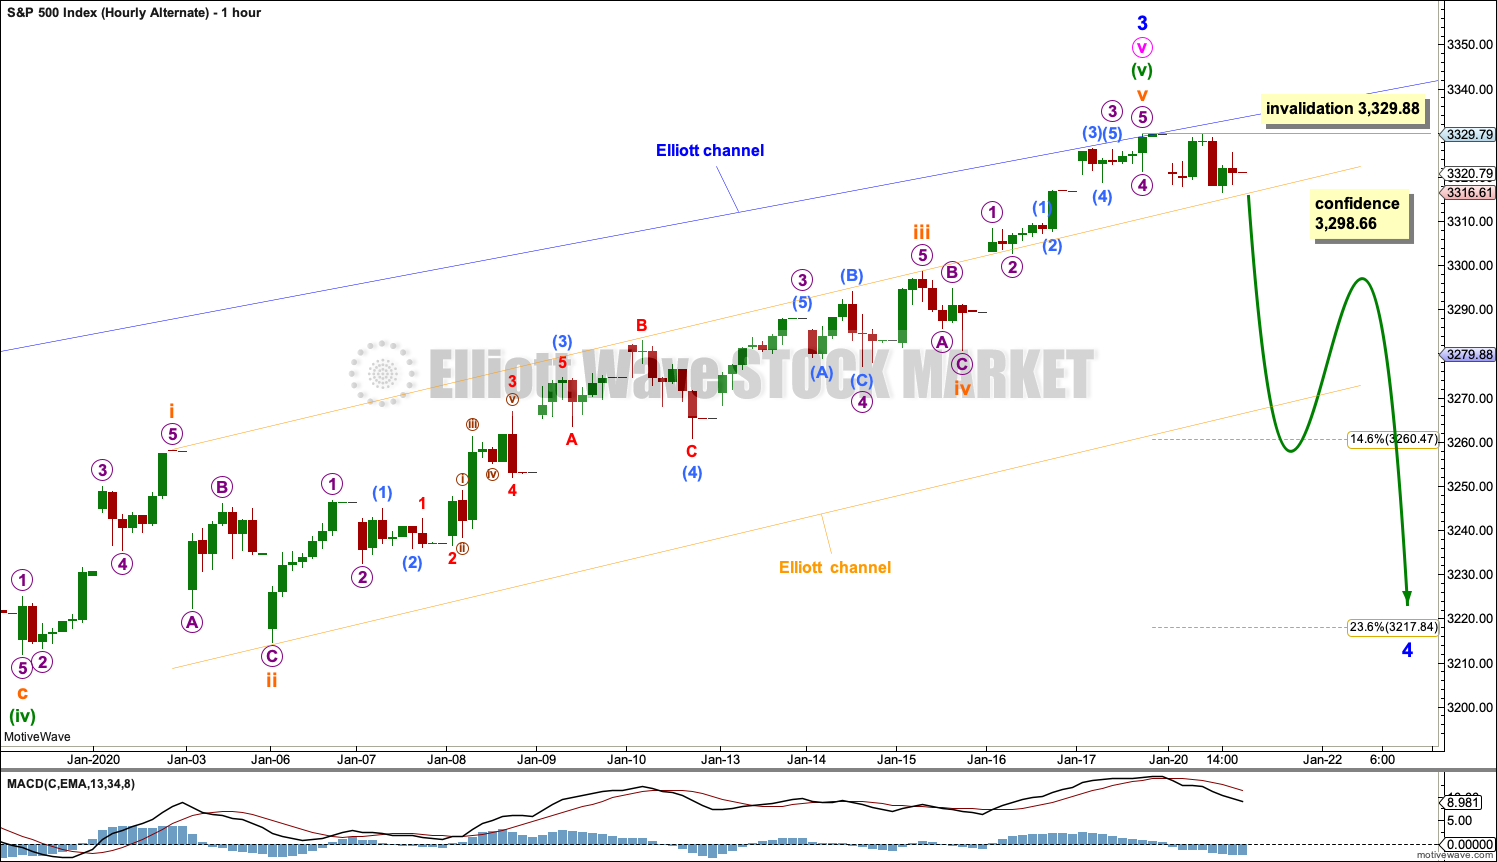
It is again possible that minor wave 3 could be over. Some confidence in this view may be had with a new low below 3,298.66 and then a breach of the narrow orange channel on the alternate hourly chart. The risk of a larger pullback or consolidation beginning here or very soon is now high.
Three large pullbacks or consolidations (fourth waves) during the next 1-2 years are expected: for minor wave 4 (coming soon, possibly just begun), then intermediate (4), and then primary 4.
The biggest picture, Grand Super Cycle analysis, is here.
Last monthly charts analysis is here with video here.
ELLIOTT WAVE COUNTS
FIRST WAVE COUNT
WEEKLY CHART
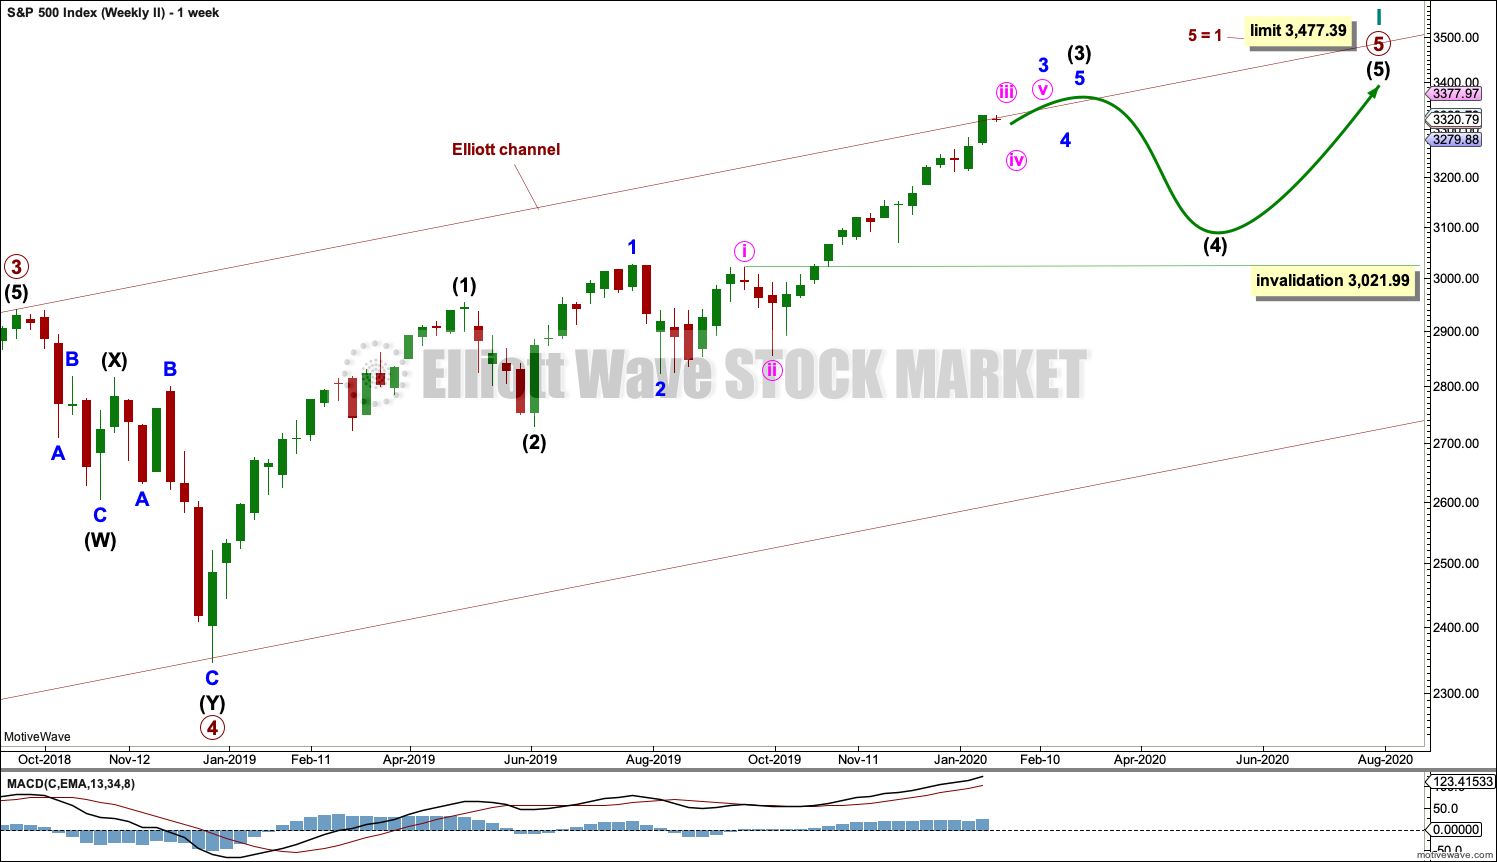
Cycle wave V may subdivide either as an impulse or an ending diagonal. Impulses are much more common, and it is clear at this stage that cycle wave V is an impulse and not a diagonal.
At this stage, cycle wave V may take another one to two or so years to complete.
A channel is drawn about the impulse of Super Cycle wave (V) using Elliott’s first technique. Draw this channel first from the high of 2,079.46 on the 5th of December 2014 to the high of 2,940.91 on the 21st of September 2018, then place a parallel copy on the low at 1,810.10 on the 11th of February 2016. Cycle wave IV found support about the lower edge.
Within Super Cycle wave (V), cycle wave III may not be the shortest actionary wave. Because cycle wave III is shorter than cycle wave I, this limits cycle wave V to no longer than equality in length with cycle wave III at 3,477.39. A new high by any amount at any time frame above this point would invalidate this main wave count in favour of one of the two alternate wave counts in the monthly chart analysis which are much more bullish.
The daily chart below will focus on movement from the end of intermediate wave (2) within primary wave 3.
Within cycle wave V, primary waves 1 and 2 may be complete. Within primary wave 3, intermediate waves (1) and (2) may be complete. Within the middle of intermediate wave (3), minor wave 4 may not move into minor wave 1 price territory below 3,021.99.
Within cycle wave V, the corrections of primary wave 2, intermediate wave (2) and minor wave 2 all show up clearly on the weekly chart. For cycle wave V to have the right look, the corresponding corrections of minor wave 4, intermediate wave (4) and primary wave 4 should also show up on the weekly chart. Three more large multi-week corrections are needed as cycle wave V continues higher, and for this wave count the whole structure must complete at or before 3,477.39.
DAILY CHART
All of primary wave 3, intermediate wave (3) and minor wave 3 may only subdivide as impulses.
Minor wave 3 has passed 1.618 the length of minor wave 1, and within it minute wave v has passed equality in length with minute wave i. The next possible target for minor wave 3 may be at 3,332 where minute wave v would reach equality in length with minute wave iii.
If price reaches up to this next target and either the structure is incomplete or price keeps rising, then a next higher target may be at 3,379 where minor wave 3 would reach 2.618 the length of minor wave 1. This would require the target for primary wave 3 to also be recalculated.
When minor waves 3 and 4 may be complete, then a target will again be calculated for intermediate wave (3).
Minor wave 2 was a sharp deep pullback, so minor wave 4 may be expected to be a very shallow sideways consolidation to exhibit alternation. Minor wave 2 lasted 2 weeks. Minor wave 4 may be about the same duration, or it may be a longer lasting consolidation. Minor wave 4 may end within the price territory of the fourth wave of one lesser degree; minute wave iv has its range from 3,154.26 to 3,070.49. However, this target zone at this stage looks to be too low.
Minor wave 4 may not move into minor wave 1 price territory below 3,021.99.
Intermediate wave (3) has now moved far enough above the end of intermediate wave (1) to allow intermediate wave (4) to unfold and remain above intermediate wave (1) price territory.
Draw an acceleration channel now about intermediate wave (3): draw the first trend line from the end of minor wave 1 to the last high, then place a parallel copy on the end of minor wave 2. Keep redrawing the channel as price makes new highs. Minor wave 4 may find support at the lower edge of this channel if it is long lasting or deep enough.
Price is now above the upper edge of the wide teal channel copied over from monthly and weekly charts. A reaction downwards soon would be a reasonable expectation, but now that price has moved above the channel it may still continue higher for some time as a blow off top forms.
HOURLY CHART
It is possible that minor wave 3 may be close to completion.
Subminuette wave v may be almost complete. Within subminuette wave v, micro wave 4 may not move into micro wave 1 price territory below 3,298.66.
ALTERNATE HOURLY CHART
If price breaks below 3,298.66, then assume minor wave 4 has arrived. At that stage, this alternate wave count would increase in probability, but would still not be a certainty.
A breach of the narrow orange channel, which is now drawn about minuette wave (v), would add reasonable confidence that minor wave 4 has arrived.
A correction to last about two weeks should begin with a five down on the hourly chart.
Within the first five down, no second wave correction may move beyond the start of its first wave above 3,329.88.
Minor wave 4 may end within the price territory of the fourth wave of one lesser degree. Minute wave iv has its range from 3,154.26 to 3,070.49. Within this range is the 0.382 Fibonacci ratio of minor wave 3 at 3,148.68. If this target range is wrong, then it may be too low.
SECOND WAVE COUNT
WEEKLY CHART
This second wave count sees all subdivisions from the end of the March 2009 low in almost the same way, with the sole difference being the degree of labelling.
If the degree of labelling for the entirety of this bull market is all moved down one degree, then only a first wave at cycle degree may be nearing an end.
When cycle wave I is complete, then cycle wave II should meet the technical definition of a bear market as it should retrace more than 20% of cycle wave I, but it may end about either the 0.382 or 0.618 Fibonacci Ratios of cycle wave I. Cycle wave II may end close to the low of primary wave II within cycle wave I, which is at 1,810.10. It is also possible that cycle wave II could be fairly shallow and only barely meet the definition of a bear market.
The impulse is still viewed as nearing an end; a fifth wave is still seen as needing to complete higher. This wave count labels it primary wave 5. Primary wave 5 may still need another year to two or so to complete, depending upon how time consuming the corrections within it may be.
Primary wave 5 may be subdividing as an impulse, in the same way that cycle wave V is seen for the first weekly chart.
TECHNICAL ANALYSIS
WEEKLY CHART
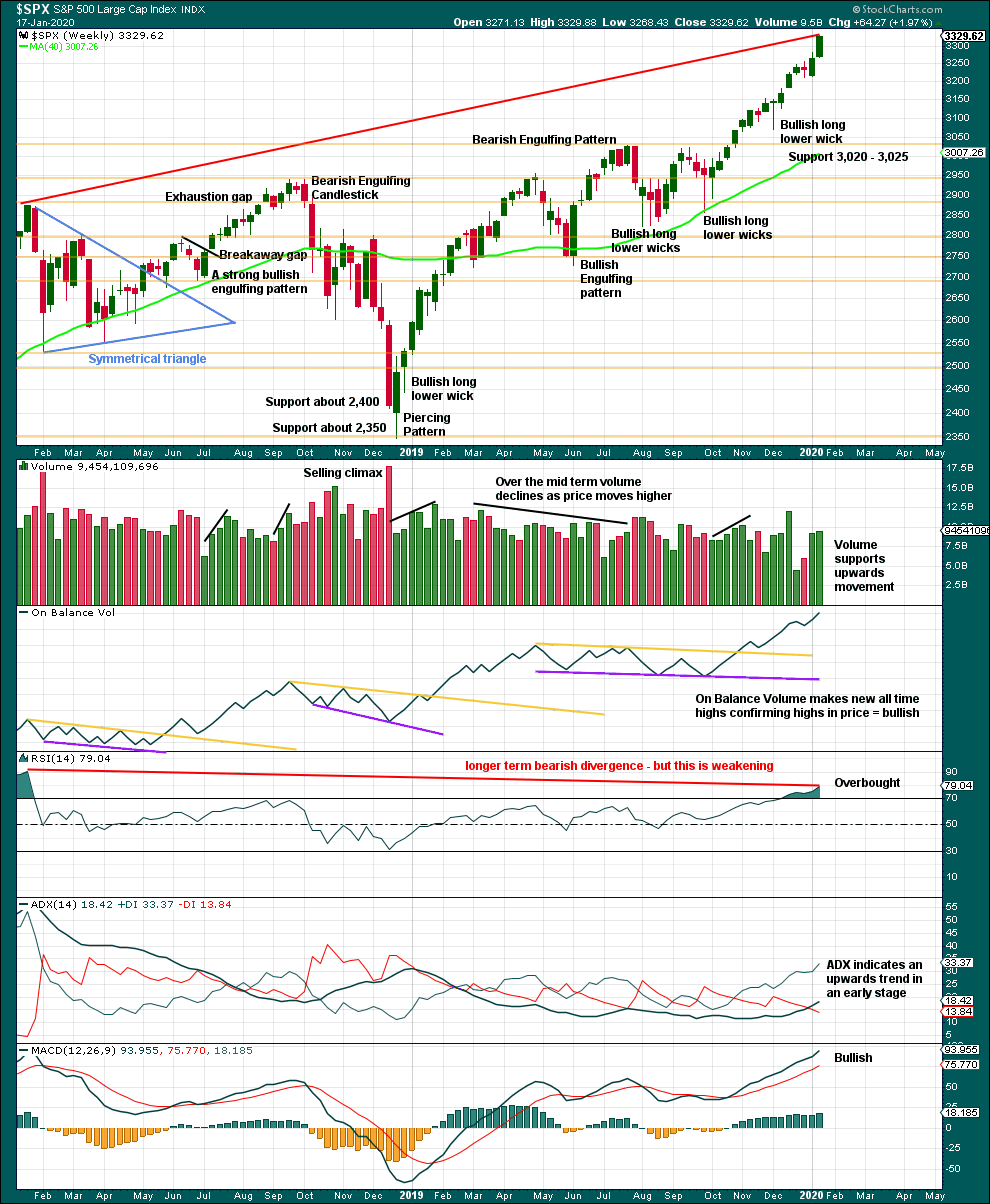
Click chart to enlarge. Chart courtesy of StockCharts.com.
It is very clear that the S&P is in an upwards trend and the bull market is continuing. Price does not move in straight lines; there will be pullbacks and consolidations along the way.
This chart is overall bullish. There are no signs of short-term weakness in upwards movement.
RSI is now overbought. That does not mean upwards movement must end here, because it can continue for several weeks while RSI reaches more extreme. RSI reaching overbought is a warning that conditions are now becoming extreme. A pullback or consolidation will follow and the longer conditions are extreme the closer this will be. However, assume the trend remains the same until proven otherwise. This warning should be heeded by careful attention to risk management.
Last week again completes a strong bullish candlestick with some support from volume. The trend remains upwards, for now.
DAILY CHART
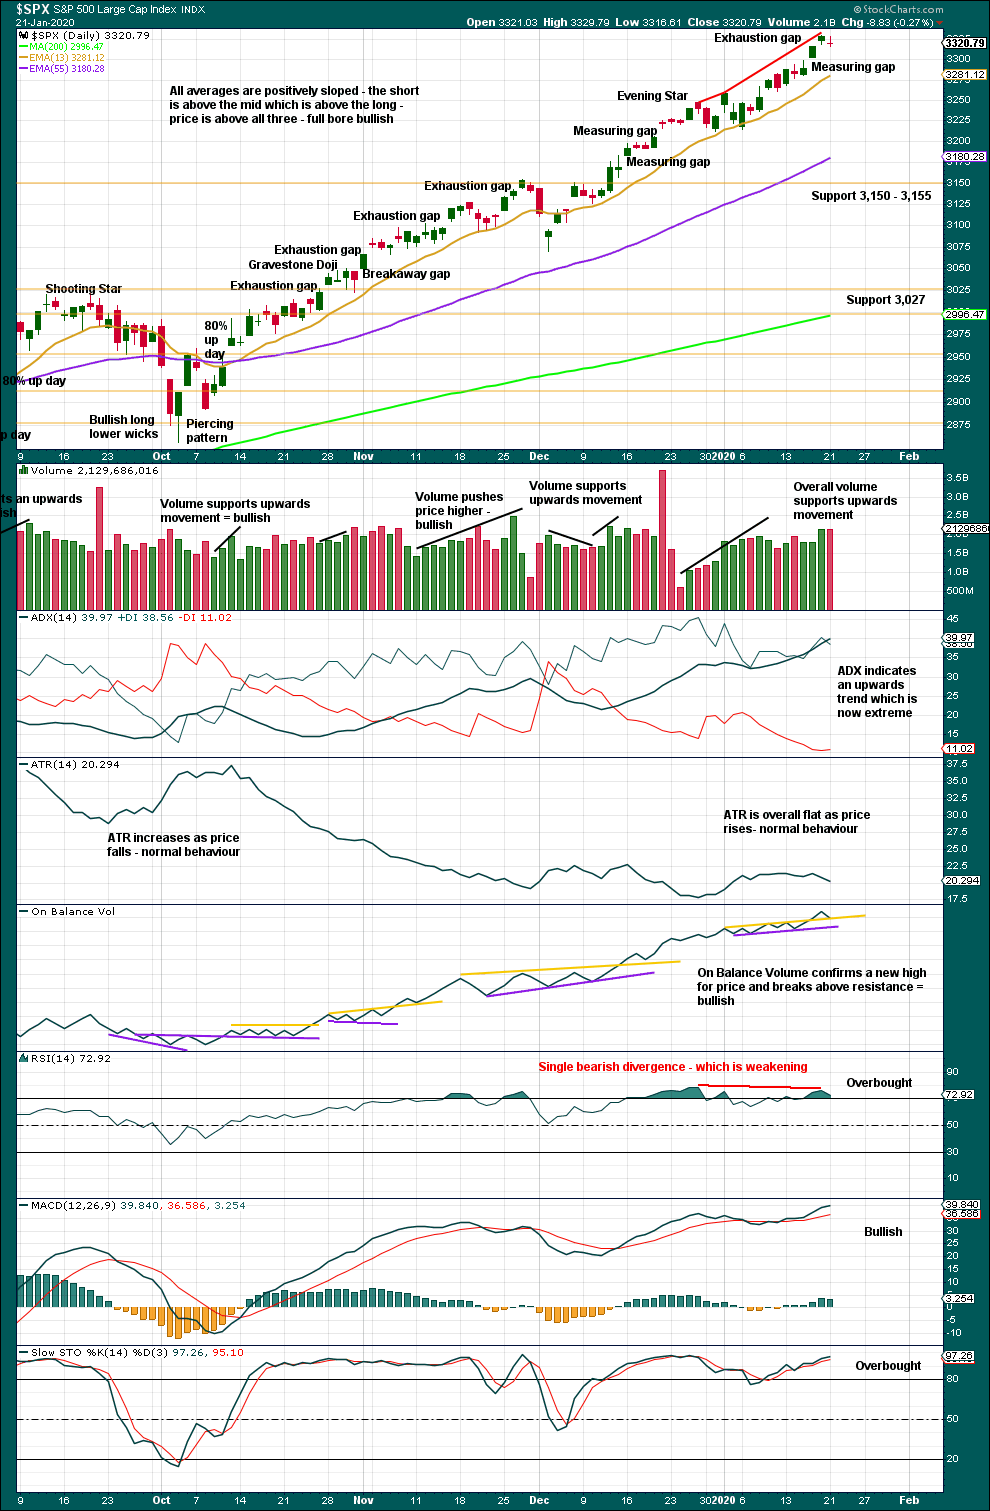
Click chart to enlarge. Chart courtesy of StockCharts.com.
There is an upwards trend in place. There will be corrections along the way.
Like the weekly chart, this chart is bullish.
RSI now exhibits only single bearish divergence where up until last week it had exhibited double bearish divergence. Divergence is weakening; it is possible that it may disappear. With the data in hand today, there is still some weakness exhibited by this divergence and while conditions are extreme this may be an indication that a pullback may arrive here or very soon.
Corrections for this market can sometimes arrive with very little warning. Extreme conditions warrant more careful attention to risk management. Upwards movement could continue yet for a reasonable distance and time, but the risk of a consolidation or pullback is increasing.
A target from the last measuring gap which remains open is at 3,386.85. However, the last gap is now closed, so it is renamed an exhaustion gap.
The warning of a larger pullback or consolidation is now louder with an exhaustion gap, bearish divergence from RSI while overbought, and now ADX reaching extreme.
BREADTH – AD LINE
WEEKLY CHART
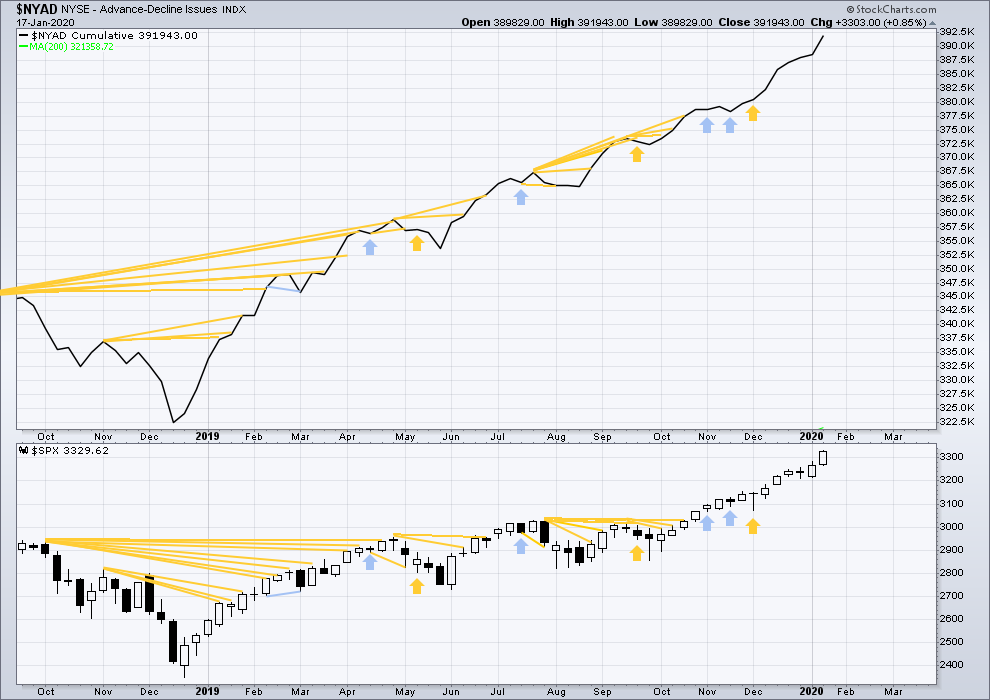
Click chart to enlarge. Chart courtesy of StockCharts.com. So that colour blind members are included, bearish signals
will be noted with blue and bullish signals with yellow.
Bear markets from the Great Depression and onwards have been preceded by an average minimum of 4 months divergence between price and the AD line with only two exceptions in 1946 and 1976. With the AD line making new all time highs this week, the end of this bull market and the start of a new bear market is very likely a minimum of 4 months away, which is mid May 2020.
In all bear markets in the last 90 years there is some positive correlation (0.6022) between the length of bearish divergence and the depth of the following bear market. No to little divergence is correlated with more shallow bear markets. Longer divergence is correlated with deeper bear markets.
If a bear market does develop here, it comes after no bearish divergence. It would therefore more likely be shallow.
Again both price and the AD line have made new all time highs. There is no divergence. Upwards movement has support from rising market breadth.
Large caps all time high: 3,329.88 on 17th January 2020.
Mid caps all time high: 2,106.30 on 17th January 2020.
Small caps all time high: 1,100.58 on 27th August 2018.
Current upwards movement is driven by large caps, which is a feature of an aged bull market.
DAILY CHART
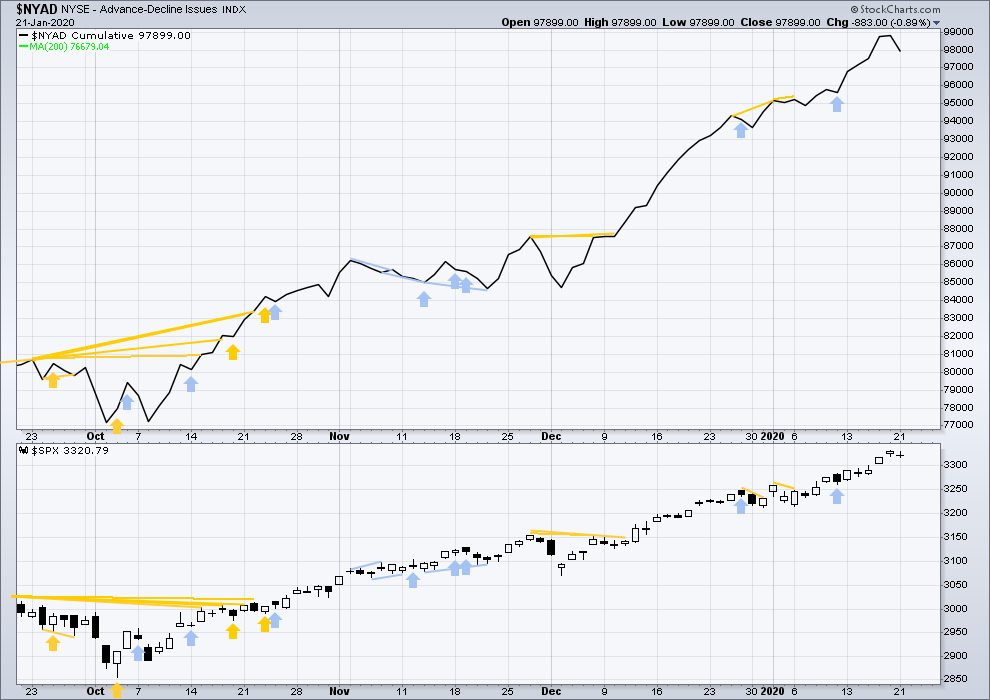
Click chart to enlarge. Chart courtesy of StockCharts.com. So that colour blind members are included, bearish signals
will be noted with blue and bullish signals with yellow.
Breadth should be read as a leading indicator.
Today both price and the AD line declined slightly. There is no new divergence.
VOLATILITY – INVERTED VIX CHART
WEEKLY CHART
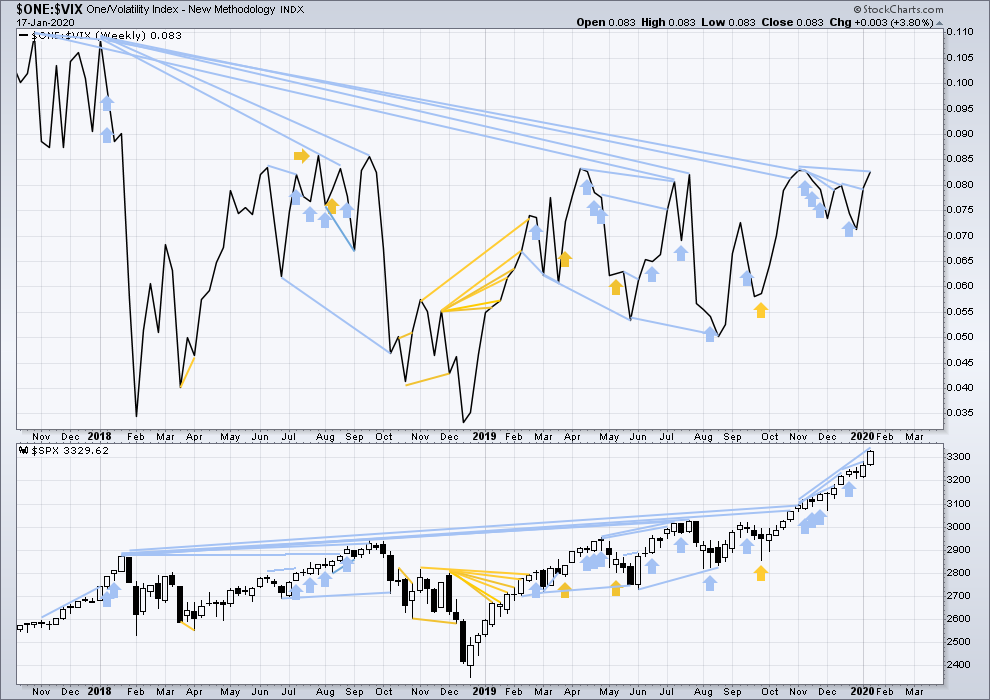
Click chart to enlarge. Chart courtesy of StockCharts.com. So that colour blind members are included, bearish signals
will be noted with blue and bullish signals with yellow.
The all time high for inverted VIX was on 30th October 2017. There is now over two years of bearish divergence between price and inverted VIX.
The rise in price is not coming with a normal corresponding decline in VIX; VIX remains elevated. This long-term divergence is bearish and may yet develop further as the bull market matures.
This divergence may be an early warning, a part of the process of a top developing that may take years. It may is clearly not useful in timing a trend change from bull to a fully fledged bear market.
Last week price and inverted VIX have both moved higher. Price is making new highs, but there remains all of short, mid and long-term bearish divergence with inverted VIX. Short-term divergence is weakened this week.
DAILY CHART
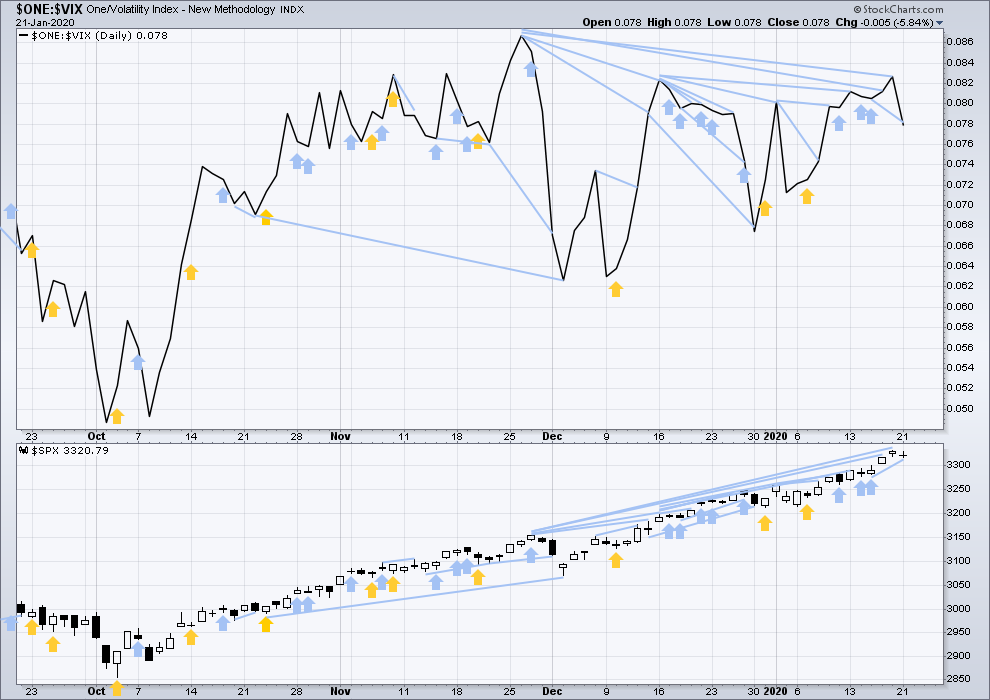
Click chart to enlarge. Chart courtesy of StockCharts.com. So that colour blind members are included, bearish signals
will be noted with blue and bullish signals with yellow.
Both price and inverted VIX have moved lower. Inverted VIX has made new short-term lows, but price has not. Volatility is increasing faster than price is declining. This divergence is bearish.
There is now a strong cluster of bearish divergence between price and VIX adding to the warning that a pullback or consolidation may develop sooner rather than later.
DOW THEORY
Dow Theory confirmed a bear market in December 2018. This does not necessarily mean a bear market at Grand Super Cycle degree though; Dow Theory makes no comment on Elliott wave counts. On the 25th of August 2015 Dow Theory also confirmed a bear market. The Elliott wave count sees that as part of cycle wave II. After Dow Theory confirmation of a bear market in August 2015, price went on to make new all time highs and the bull market continued.
DJIA: 23,344.52 – a close on the 19th of December at 23,284.97 confirms a bear market.
DJT: 9,806.79 – price has closed below this point on the 13th of December.
S&P500: 2,532.69 – a close on the 19th of December at 2,506.96 provides support to a bear market conclusion.
Nasdaq: 6,630.67 – a close on the 19th of December at 6,618.86 provides support to a bear market conclusion.
With all the indices having moved higher following a Dow Theory bear market confirmation, Dow Theory would confirm a bull market if the following highs are made:
DJIA: 26,951.81 – a close above this point has been made on the 3rd of July 2019.
DJT: 11,623.58 – to date DJT has failed to confirm an ongoing bull market.
S&P500: 2,940.91 – a close above this point was made on the 29th of April 2019.
Nasdaq: 8,133.30 – a close above this point was made on the 26th of April 2019.
Published @ 07:30 p.m. EST.
—
Careful risk management protects your trading account(s).
Follow my two Golden Rules:
1. Always trade with stops.
2. Risk only 1-5% of equity on any one trade.
—
New updates to this analysis are in bold.

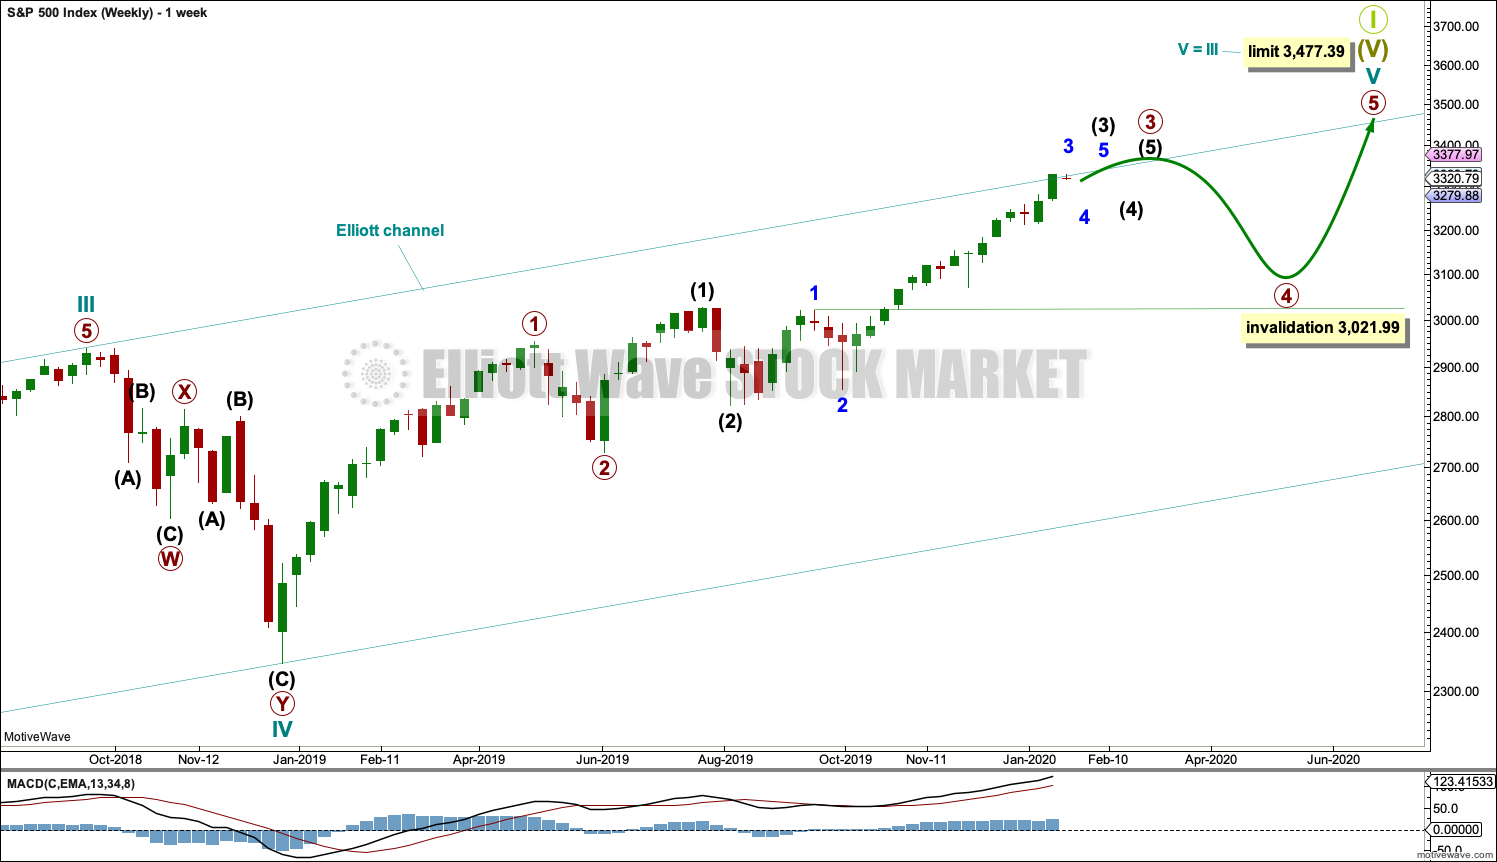
This may be the alternate today.
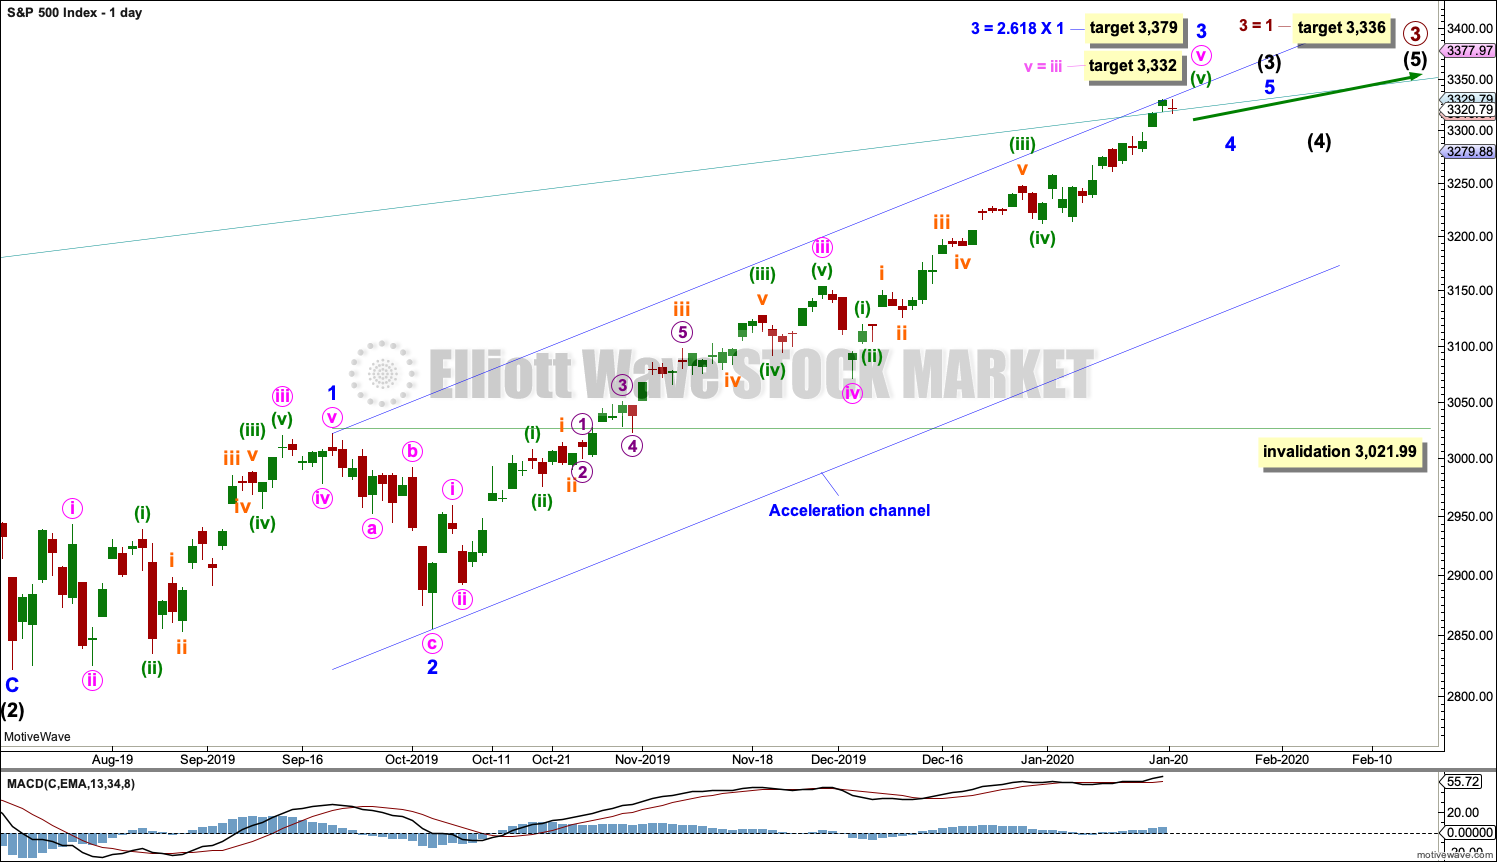
And this may be the main count. Which means the invalidation / confidence point may move up to 3,316.61.
The highest RSI value through the minor 3 is positioned in wave 5.
With the alternative count shown, it is positioned in wave 3 where it nominally belongs (but of course is not required). Something to consider.
Independent of this, we now have a minuette degree wave extending for approaching a full month. Is there a point at which the broader labeling/count needs to be reconsidered due to this?
bought TSLA puts in the AM, just sold 1/3 ….
Nice.
I will consider a short on the likely bounce up here, then initiation of some more serious selling.
I will be a buyer of RUT for a short term long trade if/when price breaks above today’s high. Excellent pullback, bottom structure at the hourly tf, and confirmation will occur with the neckline break above 1694.37.
Well that set up didn’t develop today. Price is getting close to an invalidation level of this low degree count. I notice that RUT really “likes” 50% levels, more than I see in any other average or stock. So I might also try a long on the smallest of indications of a turn off the 50% Fibo level shown just above the top of the prior i wave, with super tight stops that would indicate invalidation of the entire model.
Once again we have a nicely bullish gap up for the open. Once again (as of the past week or so) we have a McClellan Oscillator that is not correspondingly strong which, of course, is indicating weakness at hand. The McClellan Oscillator is a measurement of relative strength or weakness of market breadth. While the McClellan Oscillator gives very good indications of a market bottom, it is not as good as an indicator of tops. The sort of action we are witnessing in it over the past week can continue for some time before an actual top in price occurs.
However, along with other warning indications given by Lara, the McClellan Oscillator is flashing a cautious approach to long positions in the US stock market.
As such, I am out and sitting on hands. I managed to be long for almost all of Minute 3 and for 3/4 or Minute 5, just under 300 SPX points of Minor 3 which is now 480 SPX points long. So, I captured about 65% of Minor 3 of Intermediate 3 of Primary 3. I would have like to capture more like 75% or 85%. But one must remember, our original targets for completion of Minor 3 were well below 3300. In fact the original target for Intermediate 3 was 3302.
Well that is part of my reflection upon my most recent trade. I recommend all traders take the opportunity to perform such reflections from time to time including a psychological or emotional assessment, since emotions can influence trading.
Have a great day everyone.
Along with emotions…recency bias. Even the top hedge fund managers fell prey to that as price moved out of it’s almost 2 year range, and failed to get onboard an “obvious” breakout to the upside, because they’d just gone through 2 years of very large price swings, and a fundamental backdrop of recession fear. Tudor Jones just said this set up is similar to 1999. No it is not, not even close. So I agree with Rodney: objectivity both on the emotional side and on the analytic side is one of the great challenges of this game.
Risk management.
https://youtu.be/Zv7VCccj1wE
Fear and greed 🙂
Good video. Thanks. I had considered selling only 50% of my longs and save 50% for a hopefully higher price. But alas, I did not and probably would still do the same thing given the same conditions and events etc.
Hey Hey Hey. What you know? I am #1 again. Just like the 49rs!!!!!!
One more game required to reach that status. Your confidence is appreciated by this fan!! Should be an epic game. Can the best defense slow the best offense enough? I think so. Can Jimmy G throw if needed to keep up with the pace of KC scoring? He’s done it many times already this season, but he’s a gunslinger and sometimes forces a little and gets picked off. On the other side…can KC stop the 9rs rush attack? And who knows…everyone knows they’ll run, so maybe they pass 8/10 in the first set of plays!! It’s has all the makings for a great game, with piles countering strategy and tactics. Kind of like figuring out what the heck to do to make money in this extended market!!
It should be an excellent superbowl. I would think 49ers prevail given the defense strength. Waiting for a fun matchup.