A high today at 2,936.83 is very close to the last all time high at 2,940.91.
The Elliott wave count has been expecting the last all time high at 2,940.91 to be challenged for many weeks now.
Summary: The upwards trend remains intact and there is underlying strength in this market still. The next mid-term target is at 3,010. However, some near-term caution may be warranted due to strong resistance and now a cluster of bearish signals from VIX.
The final target remains the same at 3,045. Alternate monthly wave counts allow for a target as high as 4,119.
New updates to this analysis are in bold.
The biggest picture, Grand Super Cycle analysis, is here.
Monthly charts were last published here. Video is here.
ELLIOTT WAVE COUNTS
MAIN WAVE COUNT
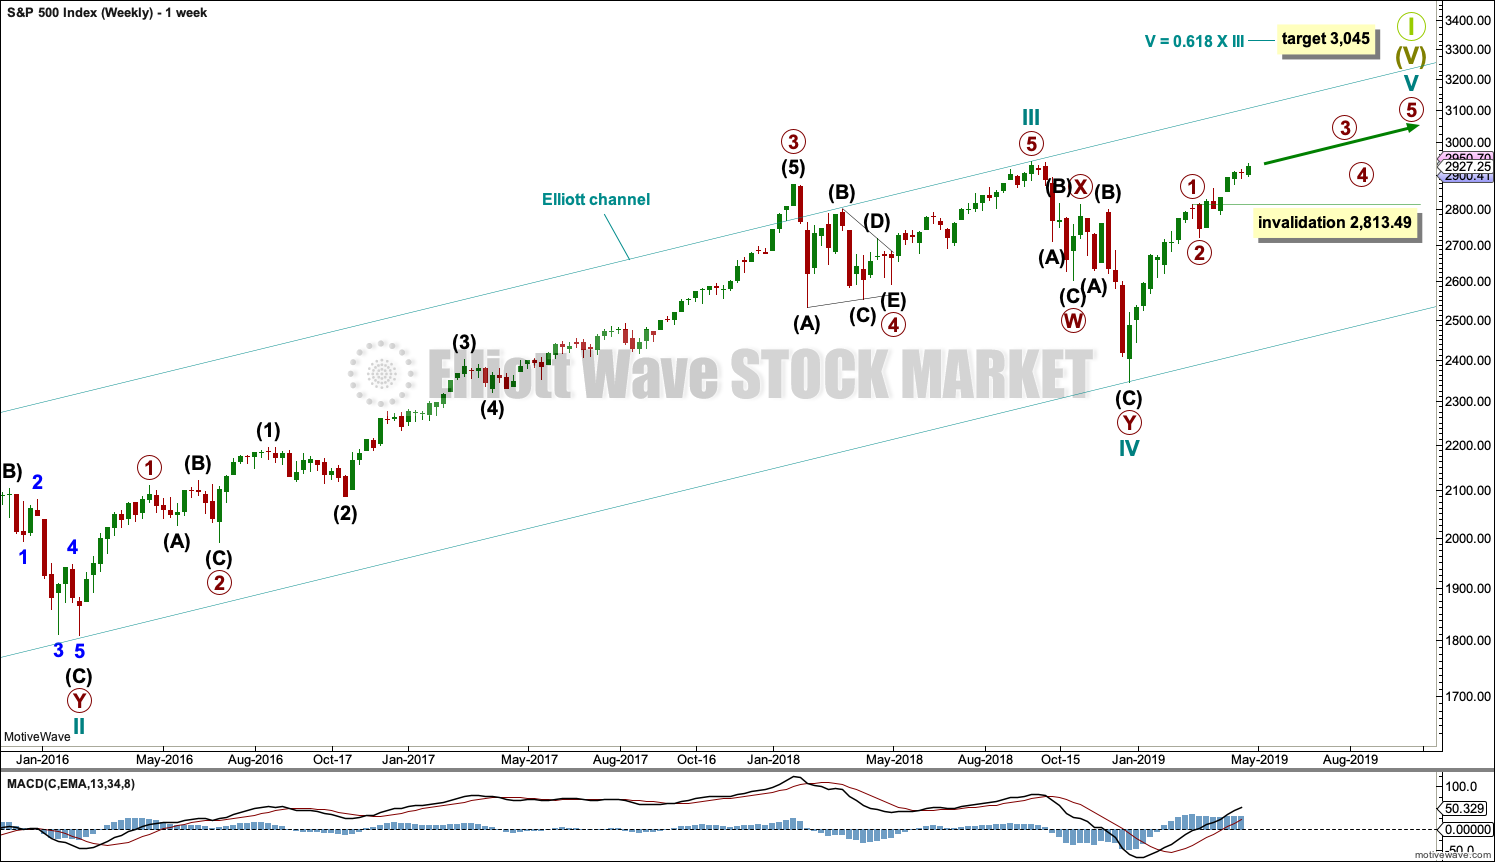
WEEKLY CHART
This weekly chart shows all of cycle waves III, IV and V so far.
Cycle wave II fits as a time consuming double combination: flat – X – zigzag. Combinations tend to be more time consuming corrective structures than zigzags. Cycle wave IV has completed as a multiple zigzag that should be expected to be more brief than cycle wave II.
Cycle wave IV may have ended at the lower edge of the Elliott channel.
Within cycle wave V, primary waves 1 and 2 may now be complete. Primary wave 3 has moved above the end of primary wave 1. When it arrives, primary wave 4 may not move into primary wave 1 price territory below 2,813.49.
Although both cycle waves II and IV are labelled W-X-Y, they are different corrective structures. There are two broad groups of Elliott wave corrective structures: the zigzag family, which are sharp corrections, and all the rest, which are sideways corrections. Multiple zigzags belong to the zigzag family and combinations belong to the sideways family. There is perfect alternation between the possible double zigzag of cycle wave IV and the combination of cycle wave II.
Although there is gross disproportion between the duration of cycle waves II and IV, the size of cycle wave IV in terms of price makes these two corrections look like they should be labelled at the same degree. Proportion is a function of either or both of price and time.
Draw the Elliott channel about Super Cycle wave (V) with the first trend line from the end of cycle wave I (at 2,079.46 on the week beginning 30th November 2014) to the high of cycle wave III, then place a parallel copy on the low of cycle wave II. Cycle wave V may find resistance about the upper edge.
It is possible that cycle wave V may end in October 2019. If it does not end there, or if the AD line makes new all time highs during or after June 2019, then the expectation for cycle wave V to end would be pushed out to March 2020 as the next possibility. Thereafter, the next possibility may be October 2020. March and October are considered as likely months for a bull market to end as in the past they have been popular. That does not mean though that this bull market may not end during any other month.
DAILY CHART
The daily chart will focus on the structure of cycle wave V.
Cycle wave V must subdivide as a five wave motive structure, either an impulse or an ending diagonal. An impulse is much more common and that will be how it is labelled. A diagonal would be considered if overlapping suggests it.
Primary wave 2 may have been a very brief and shallow expanded flat correction.
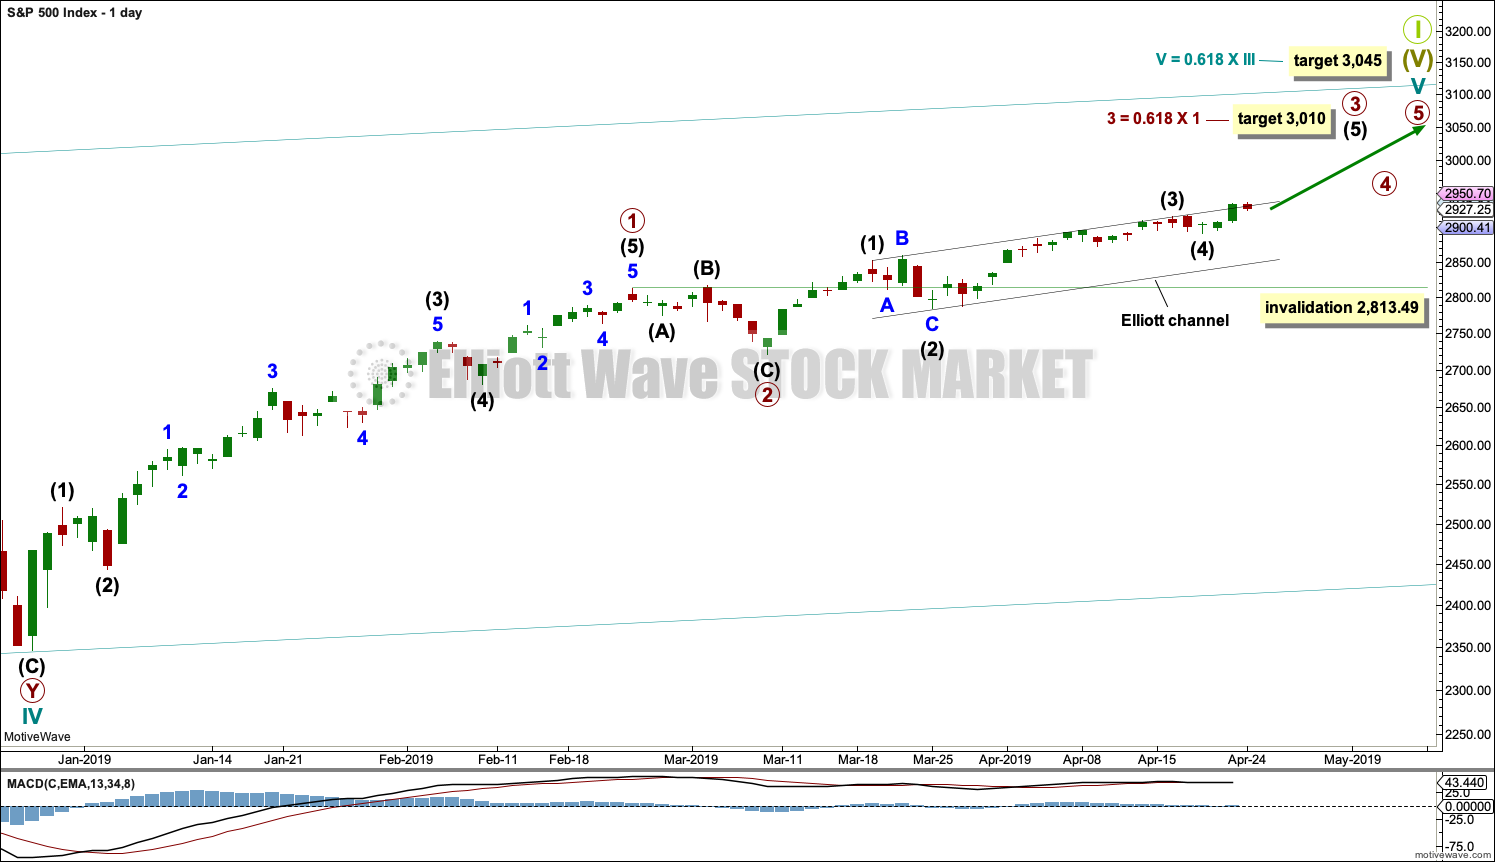
Within primary wave 3, intermediate waves (1) through to (4) may be complete. Intermediate wave (5) to end primary wave 3 may end soon or may yet continue to extend. When it is complete, then primary wave 3 may be complete.
Primary wave 4 may not move into primary wave 1 price territory below 2,813.49.
HOURLY CHART
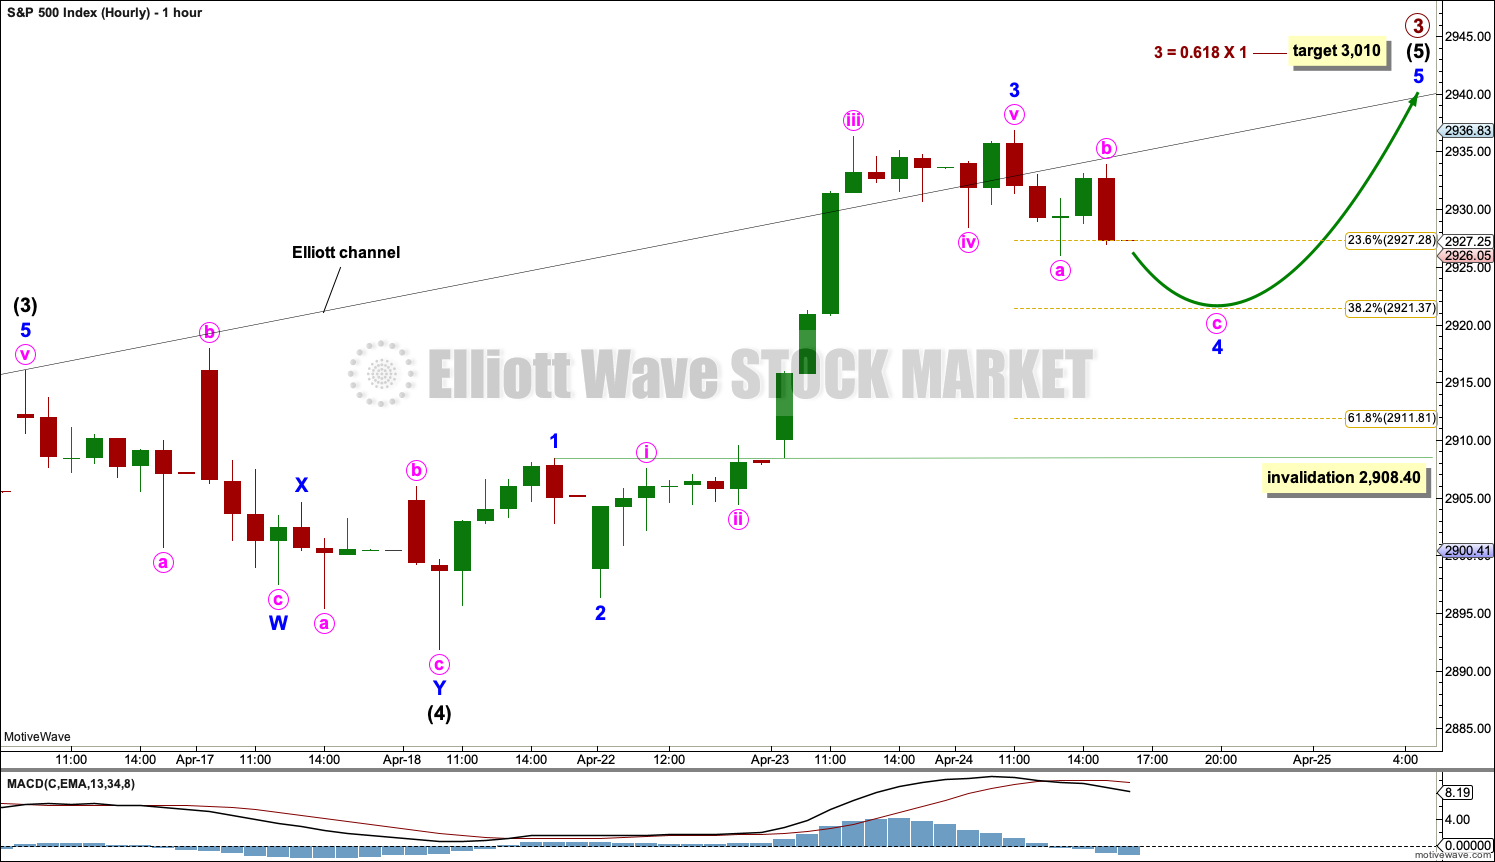
Intermediate wave (5) may be unfolding as an impulse, which is the most common structure for a fifth wave. Within the impulse, minor wave 3 may have been over at yesterday’s high, and minor wave 4 may not move into minor wave 1 price territory below 2,908.40.
It is also possible to move the degree of labelling within intermediate wave (5) all down one degree. It is possible that only minor wave 1 within intermediate wave (5) is near an end.
However, the strength of yesterday’s upwards movement that overshot the upper edge of the black Elliott channel looks very much like a third wave, so this labelling looks most likely.
When minor wave 4 is complete, then minor wave 5 should move above the end of minor wave 3 to avoid a truncation. The most common length for minor wave 5 would be equal with minor wave 1 at 16.50 points.
FIRST ALTERNATE WAVE COUNT
WEEKLY CHART
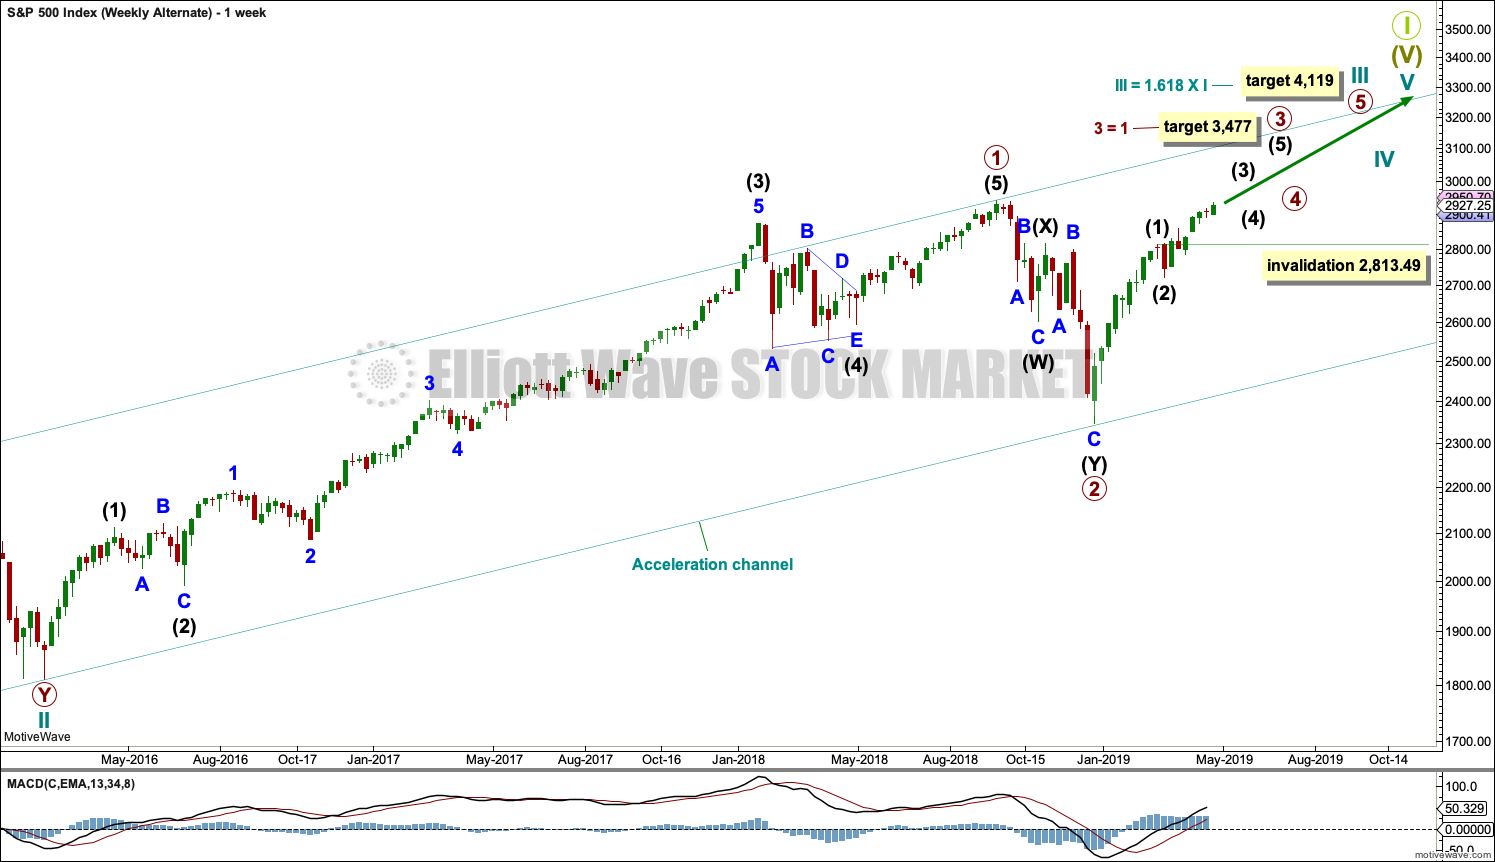
This weekly chart is identical to the main wave count up to the end of cycle wave II. Thereafter, the degree of labelling is moved down one degree.
Cycle wave III may be an incomplete impulse.
The target for cycle wave III expects it to exhibit the most common Fibonacci ratio to cycle wave I.
Within cycle wave III, only primary waves 1 and 2 may be complete.
Within primary wave 3, only intermediate waves (1) and (2) may be complete. Intermediate wave (3) has now moved beyond the end of intermediate wave (1). When it arrives, intermediate wave (4) may not move into intermediate wave (1) price territory below 2,813.49.
This wave count now expects very strong upwards movement just ahead as a third wave at three large degrees unfolds.
TECHNICAL ANALYSIS
WEEKLY CHART
Click chart to enlarge. Chart courtesy of et=”_blank”>StockCharts.com.
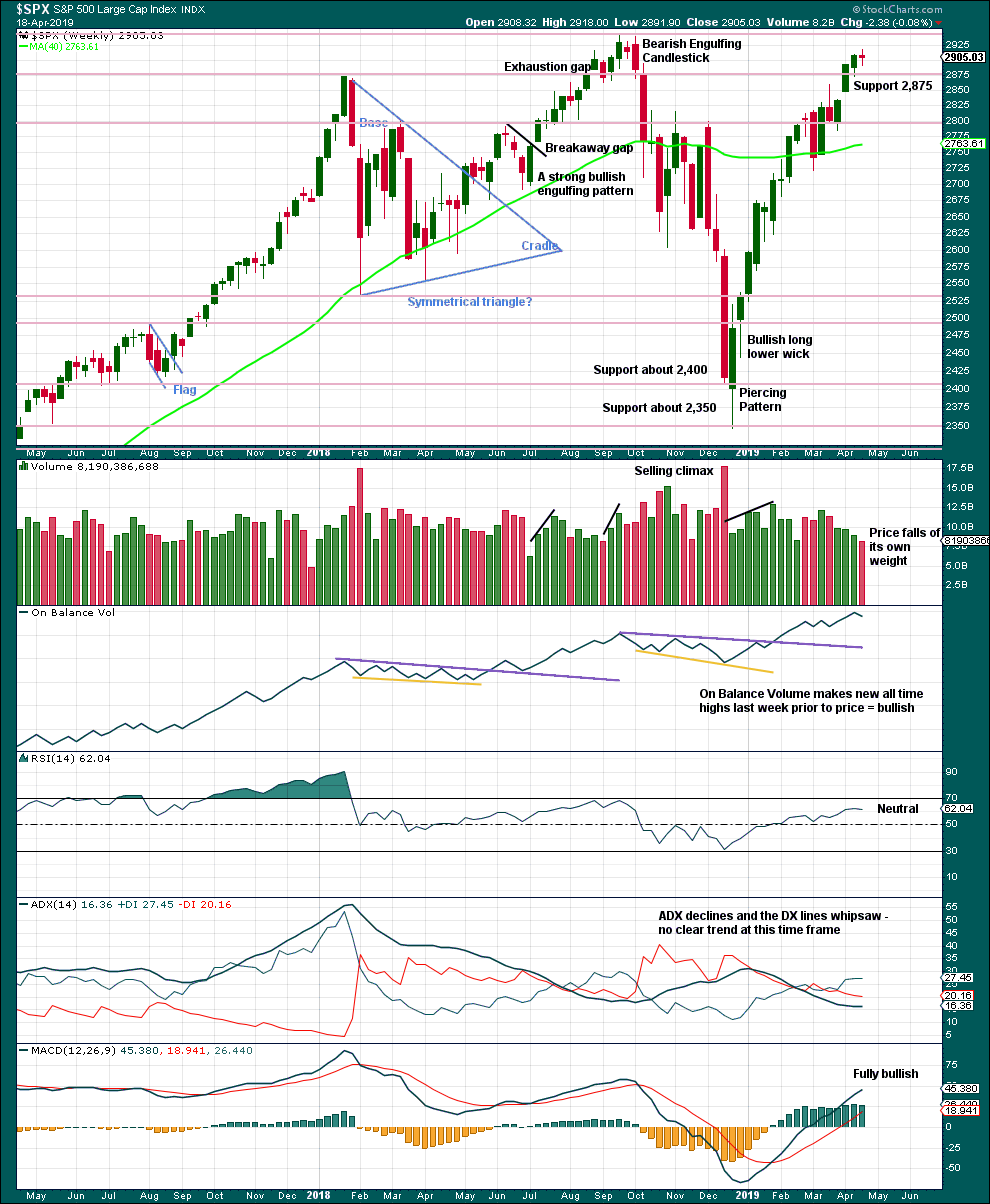
Resistance about 2,880 has been overcome. Next resistance is about the prior all time high about 2,940.
On Balance Volume makes another new all two weeks ago strongly supporting the Elliott wave count.
A decline in volume while price moves higher is not of concern given current market conditions. This has been a feature of this market for a long time and yet price continues higher.
Last week moved price higher, but the candlestick closed red and the balance of volume was downwards. With a short trading week, it would be best to look inside the week at daily volume bars to judge the short-term volume profile. Overall, this chart remains bullish and supports the Elliott wave count.
DAILY CHART
Click chart to enlarge. Chart courtesy of StockCharts.com.
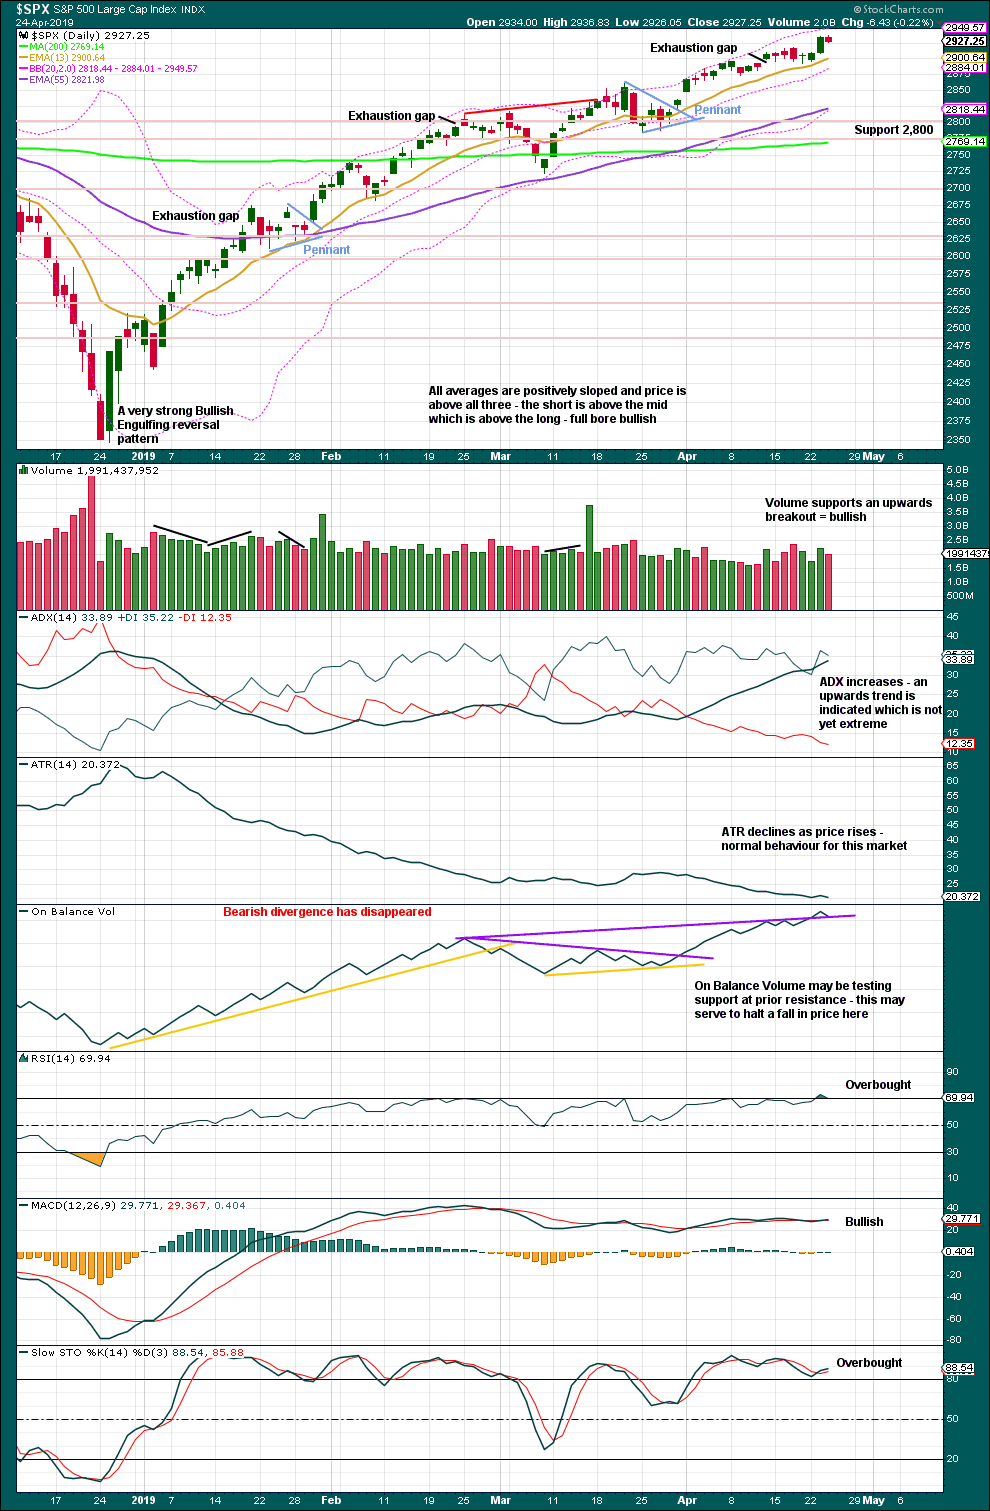
The December 2018 low is expected to remain intact. The two 90% upwards days on 26th December 2018 and 6th January 2019 indicate this upwards trend has internal strength.
Lowry’s data shows that on the 8th of April Selling Pressure has reached another new low for this bull market, and Buying Power has reached a new high for this rally. This indicates an expansion in demand and a contraction in supply, which has historically been associated with strong phases of bull markets. This strongly supports the Elliott wave count, which expects new all time highs to come this year.
While the last swing low of the 18th of April remains intact, there exists a series of higher highs and higher lows from the major low in December 2018. It would be safest to assume the upwards trend remains intact. ADX agrees.
Overall, this chart remains very bullish. The trend is not yet extreme and RSI has only just reached into overbought yesterday. There is still room for price to continue higher. Some strong resistance about the last all time high at 2,940.91 may be expected; this may be about where a more time consuming consolidation or deeper pullback may arrive.
BREADTH – AD LINE
WEEKLY CHART
Click chart to enlarge. Chart courtesy of StockCharts.com. So that colour blind members are included, bearish signals
will be noted with blue and bullish signals with yellow.
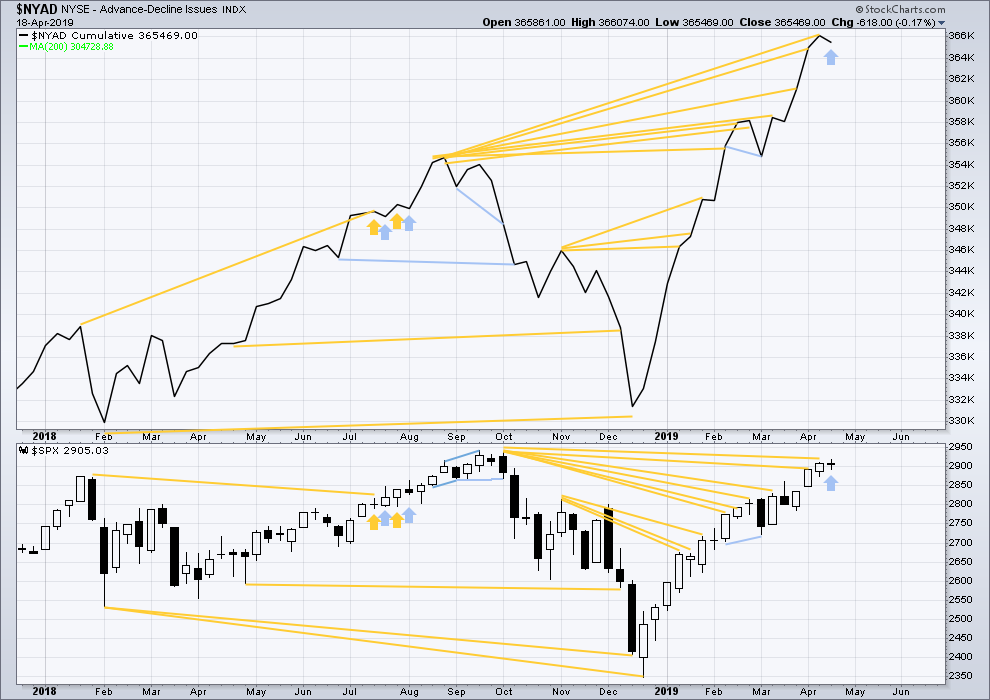
Every single bear market from the Great Depression and onwards has been preceded by a minimum of 4 months divergence between price and the AD line. With the AD line making a new all time high again in April, the end of this bull market and the start of a new bear market must be a minimum of 4 months away, which is the end of August 2019 at this time.
Last week the AD line moves lower while price moves higher. This divergence is bearish for the short term.
Mid and large caps have both made new highs above the swing high of the 25th of February, but small caps have not. However, small caps AD line has made a new all time high on the 12th of April indicating broad strength underlying this market.
DAILY CHART
Click chart to enlarge. Chart courtesy of StockCharts.com. So that colour blind members are included, bearish signals
will be noted with blue and bullish signals with yellow.
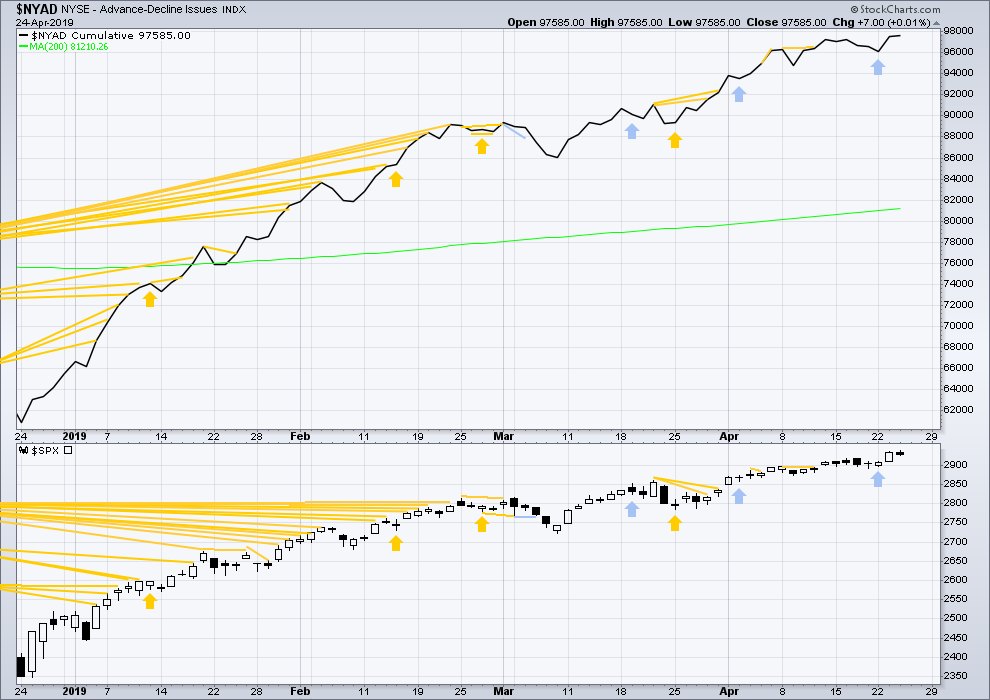
Breadth should be read as a leading indicator.
Both price and the AD line moved higher today. Upwards movement has continued support from rising market breadth.
VOLATILITY – INVERTED VIX CHART
WEEKLY CHART
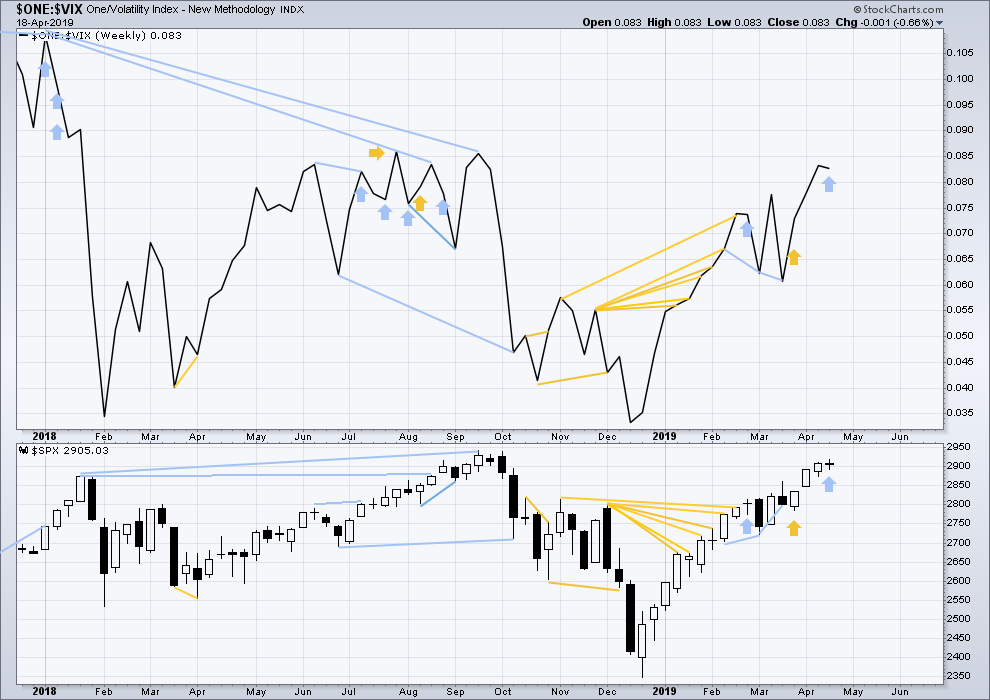
Click chart to enlarge. Chart courtesy of StockCharts.com. So that colour blind members are included, bearish signals
will be noted with blue and bullish signals with yellow.
Last week price moved higher, but inverted VIX moved lower. Upwards movement did not come with a normal corresponding decline in VIX. With VIX increasing, this divergence is bearish.
DAILY CHART
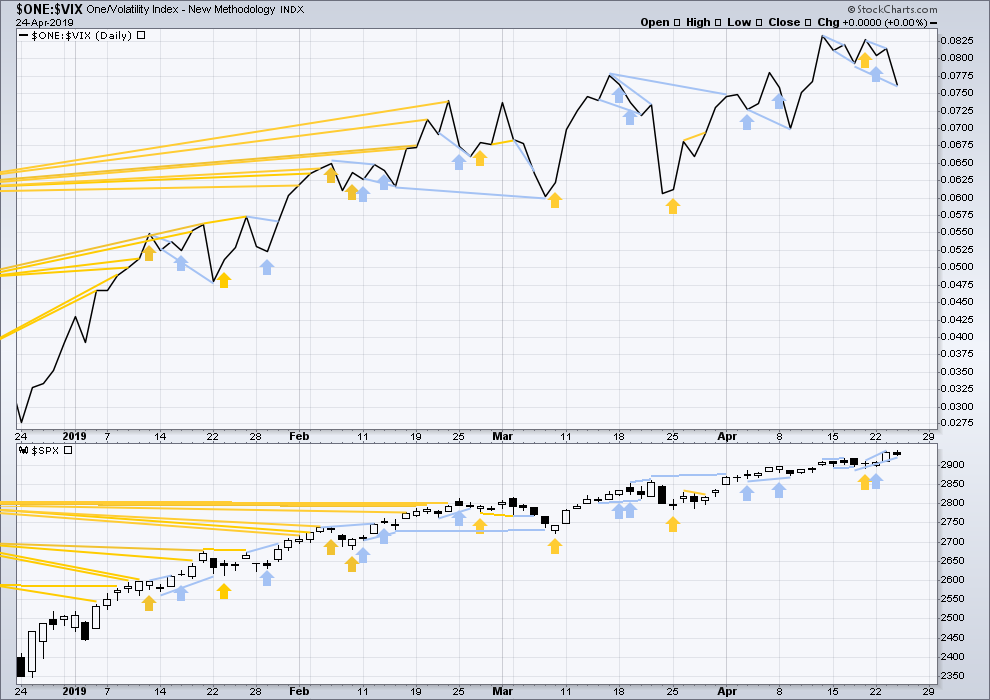
Click chart to enlarge. Chart courtesy of StockCharts.com. So that colour blind members are included, bearish signals
will be noted with blue and bullish signals with yellow.
Today price moved slightly higher, but inverted VIX has moved lower to make a new swing low below the prior low of the 17th / 18th of April. This bearish divergence is quite strong. There is now a cluster of bearish signals from inverted VIX suggesting near-term caution is warranted.
DOW THEORY
Dow Theory confirmed a bear market in December 2018. This does not necessarily mean a bear market at Grand Super Cycle degree though; Dow Theory makes no comment on Elliott wave counts. On the 25th of August 2015 Dow Theory also confirmed a bear market. The Elliott wave count sees that as part of cycle wave II. After Dow Theory confirmation of a bear market in August 2015, price went on to make new all time highs and the bull market continued.
DJIA: 23,344.52 – a close on the 19th of December at 23,284.97 confirms a bear market.
DJT: 9,806.79 – price has closed below this point on the 13th of December.
S&P500: 2,532.69 – a close on the 19th of December at 2,506.96 provides support to a bear market conclusion.
Nasdaq: 6,630.67 – a close on the 19th of December at 6,618.86 provides support to a bear market conclusion.
With all the indices moving now higher, Dow Theory would confirm a bull market if the following highs are made:
DJIA: 26,951.81
DJT: 11,623.58
S&P500: 2,940.91
Nasdaq: 8,133.30.
Published @ 08:58 p.m. EST.
—
Careful risk management protects your trading account(s).
Follow my two Golden Rules:
1. Always trade with stops.
2. Risk only 1-5% of equity on any one trade.

Thanks to Rodney and Kevin, and of course Lara. The comments below were fascinating.
🙂
I am glad to have provided Lara a little chuckle. Perhaps others as well. Somehow people have laughed at me throughout my life! If one cannot laugh at one’s self, life can prove very difficult. Besides all that, I do love to laugh. Comedy is wonderful and a remedy to many aliments.
Here is one my 7 and 4 year old granddaughters taught me recently.
What do you call a bear with no teeth?
Answer: A gummy bear.
Yesterday I completed my first iteration of a macro economic analysis for New Zealand. It also uses RRG charts and then basic chart analysis to identify stocks to buy. So far I’ve only got one, and so I’ll be continuing this process to get a few more possibilities.
Do any members want this New Zealand analysis? Let me know, I’ll email it to you.
Yes please Lara.
Thanks
Peter
Hourly chart updated:
Minor 4 may be over, minor 5 may be underway. It looks like minor 5 may be extending.
A question for all forum members.
In the past, ElliottWaveGold forum was very active, much more active than ElliottWaveStockMarket forum. That situation is now reversed with much more activity on ElliottWaveStockMarket than ElliottWaveGold.
Any ideas why?
The membership of EWG has dropped as price has moved in a big sideways range for the last 3 years. That’s a big reason probably.
Everyone’s waiting for Gold to start on a good trend again.
Meanwhile… for those who remained members I may have given them two excellent entry points right at the start of the new trend.
Yes mam. Yes you certainly did. Thank you.
Well, this morning’s open is surprising to me. It looks like we may see the Hourly Count invalidated shortly by going under 2908.40. Hmmm.
If that happens, next support is at 2987.
2887 I’m sure you meant.
This sell off feels “large” but only because volatility has been tiny. Remember after the early 2018 sell of, we used to ROUTINELY get 1.5-2.5% up days and down days? Sometimes almost back to back (well, week to week anyway). This is tepid and nominal backing/filling. So far. But as Lara warns, could be a place where a larger consolidation/retrace starts up, too.
I’m very curious where your stop (or sequence of stops) is Rodney, but if you don’t want to say I understand. I’m in at 50% or so here on the long side. My confidence in more upside is high. I’m not bailing easily here.
Wow that’s a heck of a bounce in SPX. As Lara keeps saying, “there is underlying strength in the market”.
I thought Ciovacco’s analysis last weekend was fascinating, showing how this bull market is still far below the nominal levels of bull runs over the last 20 years or so.
I’m always a little concerned with big adjacent down/up hourly bars…but that said, looks like a iv of some degree just completed here.
Well the invalidation point seems to be holding for now.
I don’t mind answering questions at all. As far as my long SPX positions, my stop is based not on a price but rather the summation of the technical indicators etc. which as you point out, Lara indicates they remain strongly bullish. When we reach the various targets, in this case 3000+, it will be time for a serious examination of the indicators again. So I do not have actual stop loss orders in place but rather I am using a mental stop loss (sort of). I don’t want to get in trouble here because one of Lara’s rules is that if one violates her risk management guidelines including using stop loss orders, one may be censured from posting or even loose subscription rights.
That being said, my long SPX positions are not leveraged. Were I to use any leveraged positions such as UPRO etc., I would in fact set actual stop loss orders.
Finally, I remain very bullish especially long term, weeks and months. I am persuaded that this bull market has a long way to go. I favor the Alternate Monthly counts. One way to look at it is that the bull market did not begin in 2009. The period of time from 2000 to 2013 was all a consolidation. The bull market actually began when we broke out of the consolidation by going over SPX 1600 in March of 2013. Thus, the bull run is only 6 years old. If the consolidation was 13 years, we can expect good things to happen for a long time ( more than 13 years). That is what C. Ciovacco has eluded to numerous times. If this is correct, we have at least another 6 or 7 years to go. Similar periods would be the 1980’s and 1990’s bull run, as well as the 1950’s into the 1960’s. for what is worth, below is a long term monthly chart of mine. Of course, it needs to be confirmed all the way up by daily and weekly wave counts.
The top right corner purple marking is truncated, it should show III in purple.
By the way, I checked leading PE ratios yesterday. The have come down a long way from last year’s indicating corporate profits are very strong. SPX is at 21.74 down from 24.92 a year ago. The Russell 2000 is currently at 43 down from 109.89 a year ago! The DJIA is at 18.56 down from 24.31 a year ago.
That’s interesting. I presume the massive tax cut was one large factor, “free money” that went straight to the bottom line along with stock buybacks and bigger bonuses.
There’s more than one way to “revert to the mean”, isn’t there? Speaking of which I wonder where those who always prefer and often expect a price drive reversion to the mean have gone? Chris and Verne to name two. All quiet on the bearish minded front. This kind of market can make a bear pretty uncomfortable.
The EW analyst at the big name site has casually redone his shorter term count to show a iv happening here (instead of a C wave up from Dec lows complete several days ago), don’t know how he’ll jigger the larger count to accommodate. I just get the sense that that guy’s methodology is highly swayed by his own outlook, which is strongly bearish, which he finds data to support (recently it’s been the very very bullish sentiment indicators) and jiggers up a count to support. Rather than Lara’s approach of focusing strictly and neutrally on most likely and most likely alternative counts based on structure and supporting TA data. I am finding his dollar and interest rate counts to be valuable though.
“So I do not have actual stop loss orders in place but rather I am using a mental stop loss (sort of). I don’t want to get in trouble here because one of Lara’s rules is that if one violates her risk management guidelines including using stop loss orders, one may be censured from posting or even loose subscription rights.”
I’m actually having a little chuckle over this Rodney 🙂
In your case because you are a very seasoned trader it’s all good.
BUT I will have to note that we have had new members from time to time come in and let it be known they didn’t have a stop, my analysis turned out to be wrong (or at least, the main count was invalidated and the alternate was proven correct) and they complained of run away losses. Someone one once even demanded this membership find them a way out.
With very few exceptions (long term members who I know are very experienced traders) if a member here shows they’re trading without stops I WILL cancel membership. I don’t ever want to be held accountable for runaway losses on accounts where risk is not being managed.
Anyone who makes a trading decision (or any decision in life for that matter) and blames others for negative results will never be a successful trader (a winner in life). Every trader / investor must be fully self accountable for all their choices, every single choice or they will 1) continue to loose money, or most likely 2) eventually loose it all.
Some have said, the psychology of trading / investing is just as important as all other study, analysis, strategy, and tactics. I believe that particular thought hits the nail on the head.
FWIW I also am beginning to lean more towards the monthly alternate and weekly alternate.
I’m considering simply naming the counts “1”, “2” and “3”. Rather than “main” and “alternate”.
There is enough underlying strength in this market to see it continuing for a few years or so.
There is also enough developing weakness in declining ATR and weak volume to put that into context of a final fifth wave. A long drawn out one, but a final one.
Not sure if this has been brought up before but is it possible that the whole move up from the December low to now is Primary 1 – finished or close to with (3)-(4) being the Feb high to the March low ?
By my quick and amateur look…seems possible. In which case the matching V looks like it has a strong 2 (march sell off) and a matching 4 to that 2 is pending. Still a pretty bullish count for the time being.
Eventually some big reactionary 2 wave to the overall move off the Dec lows will come. Even at only a 38% retrace level, it will be a pretty decent size sell off. If it started now, it would go about 2718 at 38%, and that would be a 7% drop.
#1