Upwards movement has continued as the bigger picture for the Elliott wave count expected, although a little more sideways movement was expected first.
Summary: The next target for a pullback or consolidation to begin is now at 2,918. The upwards trend remains intact.
The final target remains the same at 3,045.
New updates to this analysis are in bold.
The biggest picture, Grand Super Cycle analysis, is here.
This week monthly charts will be reviewed.
ELLIOTT WAVE COUNTS
MAIN WAVE COUNT
MONTHLY CHART
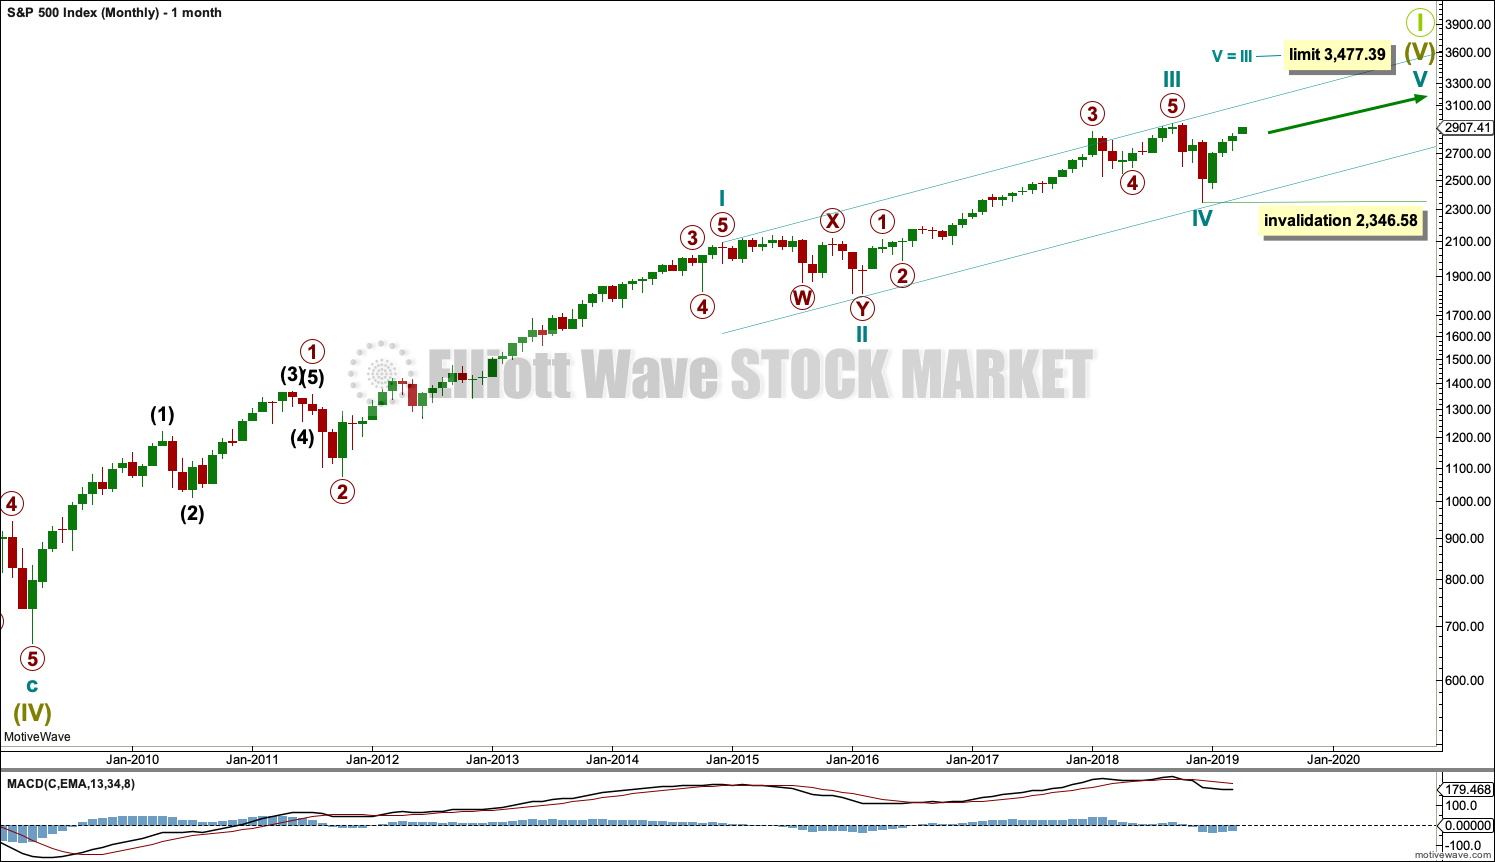
Super Cycle wave (IV) completed a 8.5 year correction. Thereafter, a bull market began for Super Cycle wave (V). The structure of Super Cycle wave (V) is incomplete. It is subdividing as an impulse.
There is no Fibonacci ratio between cycle waves I and III within Super Cycle wave (V). Cycle wave V will be limited to no longer than equality with cycle wave III, so that cycle wave III is not the shortest actionary wave.
A channel is drawn about the impulse of Super Cycle wave (V) using Elliott’s first technique. Cycle wave IV found support about the lower edge.
There is perfect alternation between a shallow time consuming combination for cycle wave II and now a deeper and more brief double zigzag for cycle wave IV. The speed and depth of cycle wave IV makes these two corrections look like they should be labelled the same degree. This wave count has the right look.
The middle of the third wave overshoots the upper edge of the Elliott channel drawn about this impulse. All remaining movement is contained within the channel. This has a typical look.
Within cycle wave V, no second wave correction may move beyond the start of its first wave below 2,346.58.
This wave count expects MACD to begin to exhibit divergence with price as price makes new highs. Cycle wave III may exhibit strongest momentum and cycle wave V may exhibit some weakness. If price makes new highs but MACD does not, then this would remain the main wave count.
Within Super Cycle wave (V), cycle wave III may not be the shortest actionary wave. Because cycle wave III is shorter than cycle wave I, this limits cycle wave V to no longer than equality in length with cycle wave III at 3,477.39. A target is calculated for cycle wave V to end prior to this point.
This wave count agrees with MACD. Cycle wave III exhibits strongest momentum, and primary wave 3 within cycle wave III exhibits the strongest histogram within MACD.
WEEKLY CHART
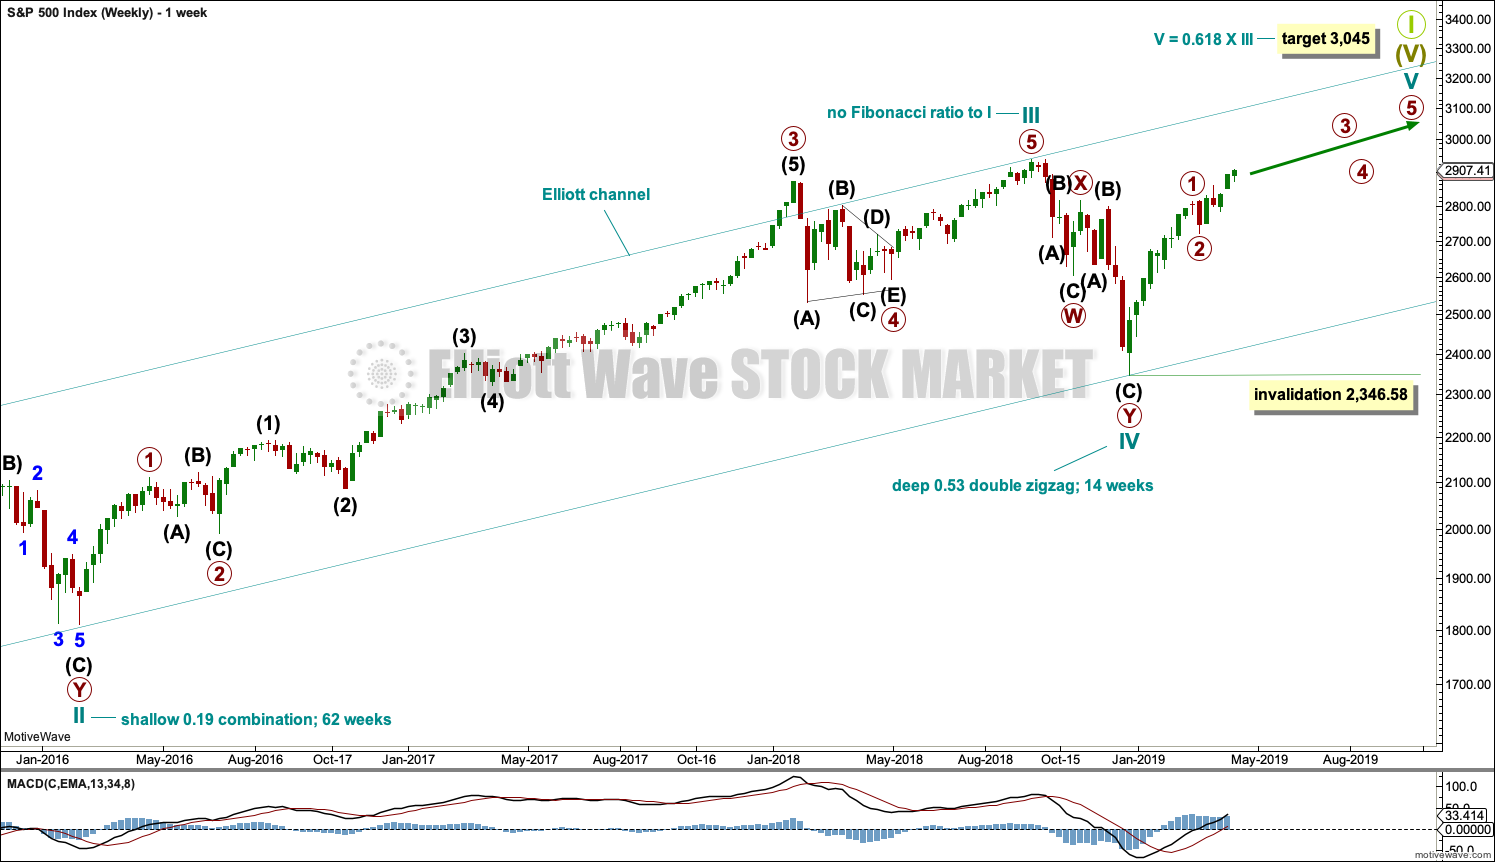
This weekly chart shows all of cycle waves III, IV and V so far.
Cycle wave II fits as a time consuming double combination: flat – X – zigzag. Combinations tend to be more time consuming corrective structures than zigzags. Cycle wave IV has completed as a multiple zigzag that should be expected to be more brief than cycle wave II.
Cycle wave IV may have ended at the lower edge of the Elliott channel.
Within cycle wave V, no second wave correction may move beyond the start of its first wave below 2,346.58.
Although both cycle waves II and IV are labelled W-X-Y, they are different corrective structures. There are two broad groups of Elliott wave corrective structures: the zigzag family, which are sharp corrections, and all the rest, which are sideways corrections. Multiple zigzags belong to the zigzag family and combinations belong to the sideways family. There is perfect alternation between the possible double zigzag of cycle wave IV and the combination of cycle wave II.
Although there is gross disproportion between the duration of cycle waves II and IV, the size of cycle wave IV in terms of price makes these two corrections look like they should be labelled at the same degree. Proportion is a function of either or both of price and time.
Draw the Elliott channel about Super Cycle wave (V) with the first trend line from the end of cycle wave I (at 2,079.46 on the week beginning 30th November 2014) to the high of cycle wave III, then place a parallel copy on the low of cycle wave II. Cycle wave V may find resistance about the upper edge.
It is possible that cycle wave V may end in October 2019. If it does not end there, or if the AD line makes new all time highs during or after June 2019, then the expectation for cycle wave V to end would be pushed out to March 2020 as the next possibility. Thereafter, the next possibility may be October 2020. March and October are considered as likely months for a bull market to end as in the past they have been popular. That does not mean though that this bull market may not end during any other month.
DAILY CHART
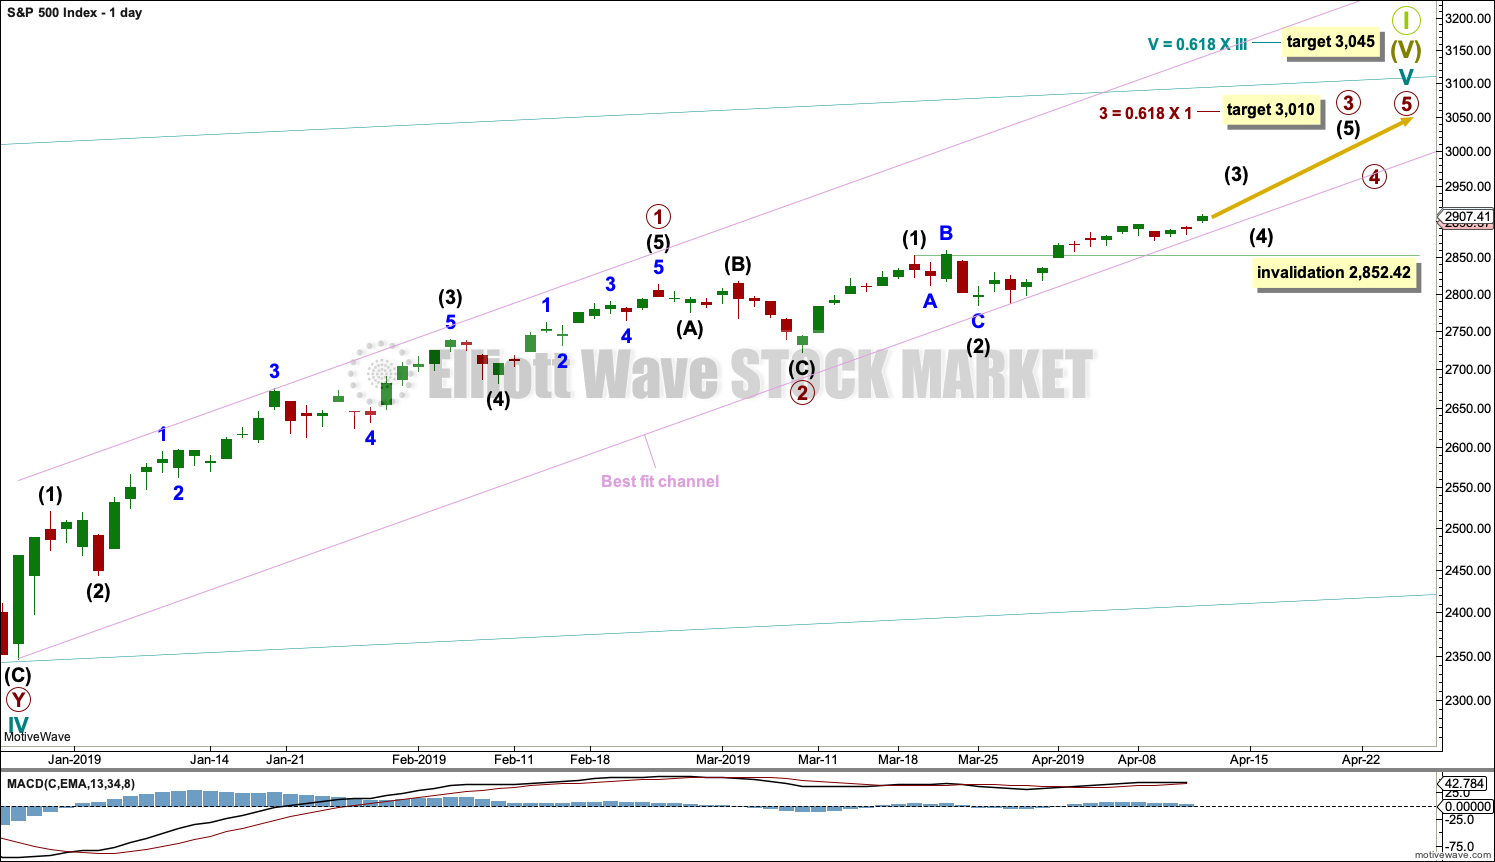
The daily chart will focus on the structure of cycle wave V.
Cycle wave V must subdivide as a five wave motive structure, either an impulse or an ending diagonal. An impulse is much more common and that will be how it is labelled. A diagonal would be considered if overlapping suggests it.
Primary wave 2 may have been a very brief and shallow expanded flat correction.
Within primary wave 3, intermediate waves (1) and (2) may be complete. Intermediate wave (3) is now relabelled as incomplete after Friday’s new high.
When intermediate wave (3) is complete, then intermediate wave (4) may not move into intermediate wave (1) price territory below 2,852.42.
The channel shows where small pullbacks are finding support. It may continue to do so, but the S&P does not always fit well within channels. It is possible that the channel may be breached and price may continue higher to find resistance at the lower edge of the channel.
HOURLY CHART
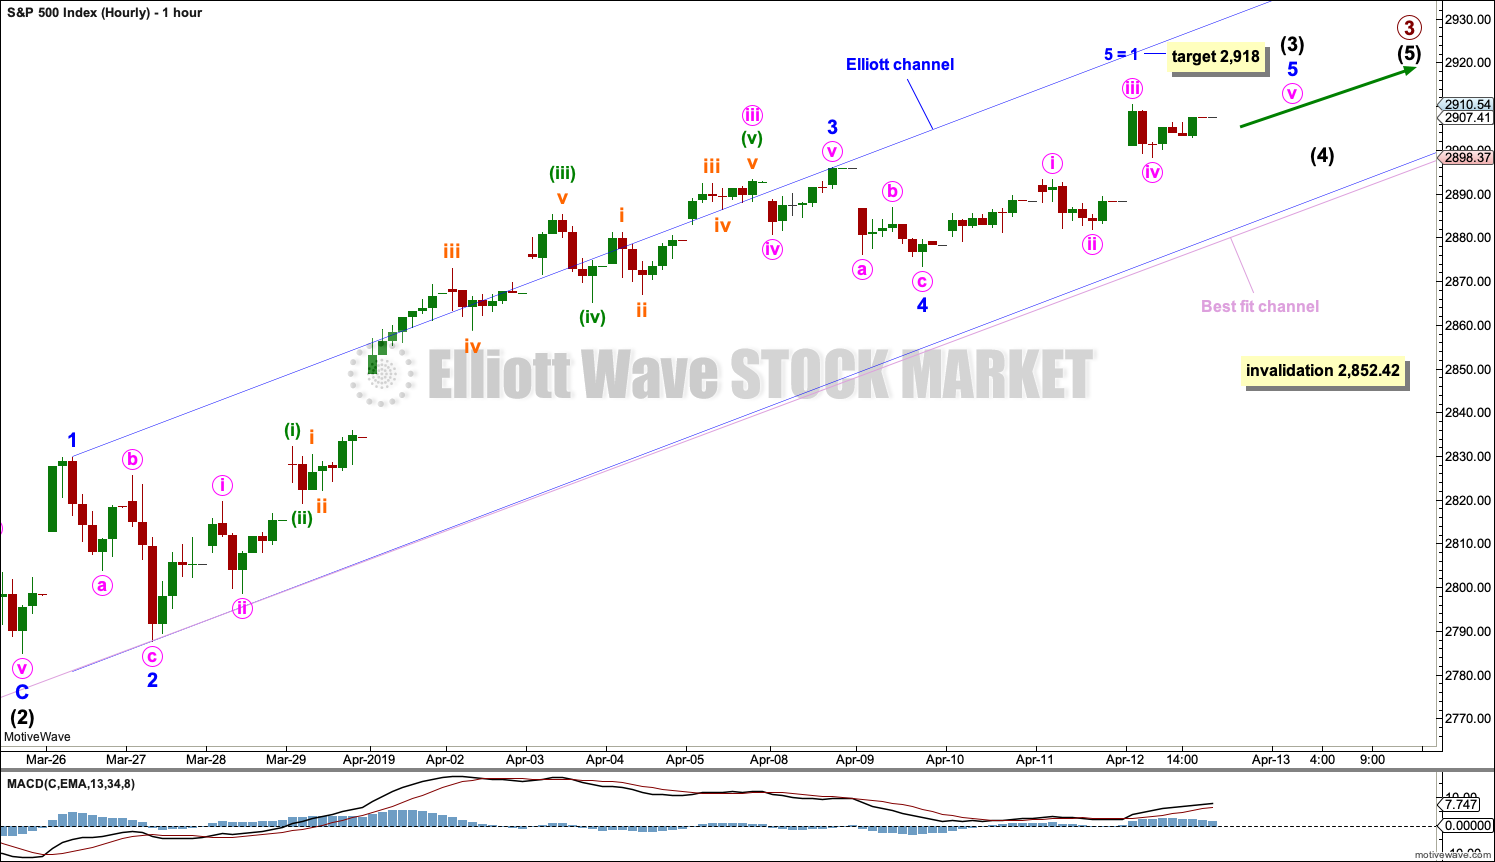
The hourly chart shows all of intermediate wave (3) so far, which is today relabelled.
Intermediate wave (3) may be extending. Within intermediate wave (3), minor waves 1 through to 4 may be complete. Minor wave 3 is 9.2 points short of 2.618 the length of minor wave 1. A target is calculated for minor wave 5 to exhibit the most common Fibonacci ratio to minor wave 1.
When it arrives, intermediate wave (4) may be relatively shallow. It may find support about the lower edge of the best fit channel.
ALTERNATE WAVE COUNT
MONTHLY CHART
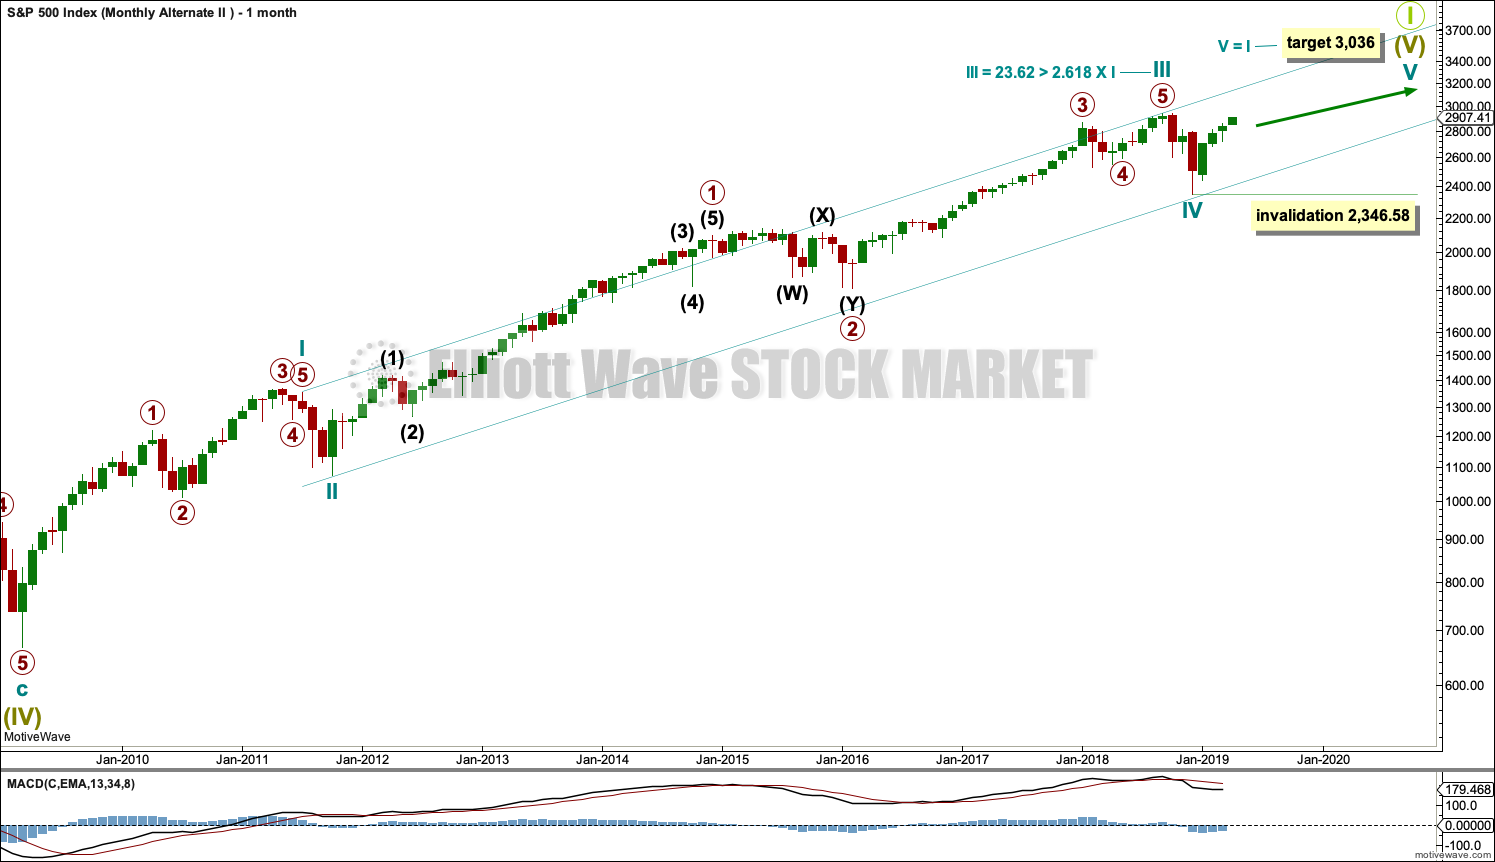
It is time to consider a more bullish wave count because the AD line is making new all time highs and the end of this bull market now would be extremely likely to be a bare minimum of 4 months away, and likely longer.
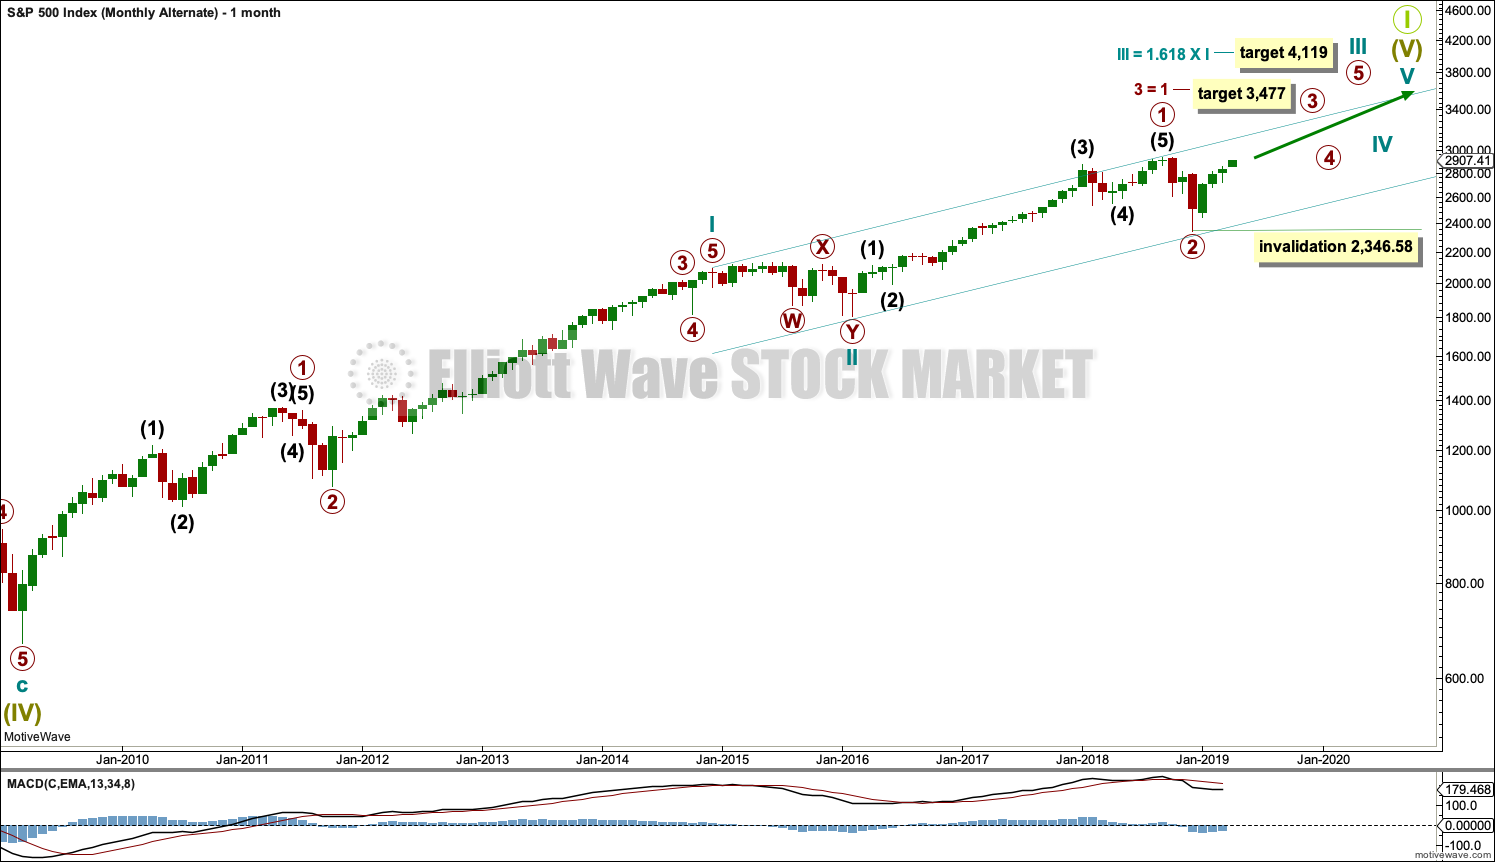
If the degree of labelling is moved down within cycle wave III, then it is possible that the last high was only primary wave 1. Cycle wave III may be extending.
Only two actionary waves within an impulse may extend. Cycle wave I was extended. If cycle wave III also extends, then cycle wave V may not extend.
A target is calculated for primary wave 3 to end. If price gets up to this target and the structure is incomplete, or if price keeps rising through the target, then a new higher target would then be calculated.
Within primary wave 3, no second wave correction may move beyond the start of its first wave below 2,346.58.
This wave count expects MACD to indicate stronger momentum as price makes a new all time high. If that happens, then this may be switched to be the main wave count.
The channel drawn here is an acceleration channel. The channel may be redrawn as price makes new highs. When cycle wave III may be complete, then this channel would be an Elliott channel and may show where cycle wave IV may find support.
This wave count has no limit on upwards movement.
SECOND ALTERNATE WAVE COUNT
MONTHLY CHART
It is also possible that cycle wave I was over earlier and did not extend. Cycle wave III may have been over at the last all time high and did extend.
Within cycle wave III, both primary waves 2 and 4 are more time consuming than cycle waves II and IV. This is possible and does occasionally happen when waves extend as they do so both in price and time, but it does give the wave count an odd look.
The channel is drawn using Elliott’s first technique. It shows where cycle wave IV found support. However, the upper edge of the channel is breached by much of cycle wave III and not just the strongest portion of it. This does not have a typical look.
This wave count still agrees with MACD. Cycle wave III exhibits strongest momentum, and primary wave 3 within cycle wave III exhibits the strongest histogram within MACD.
This wave count has no limit on upwards movement.
TECHNICAL ANALYSIS
MONTHLY CHART
Click chart to enlarge. Chart courtesy of et=”_blank”>StockCharts.com.
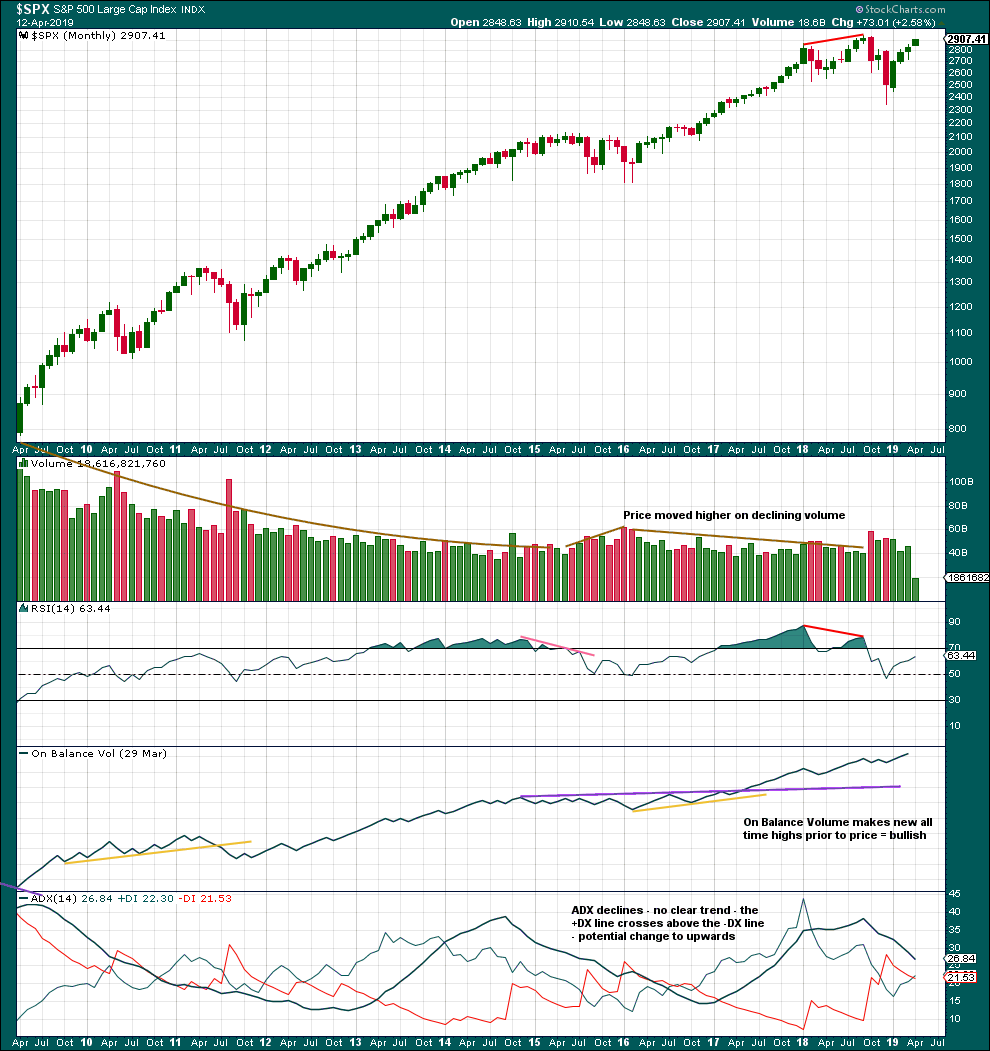
Price moving higher on declining volume has been a feature of this bull market since 2009. This may fit the larger picture that sees this bull market as a Super Cycle degree fifth wave. Fifth waves should exhibit some weakness; they do not always have support from volume.
RSI indicates the main monthly wave count may be more likely. It reached into overbought towards the end of both cycle waves I and III for that wave count.
WEEKLY CHART
Click chart to enlarge. Chart courtesy of et=”_blank”>StockCharts.com.
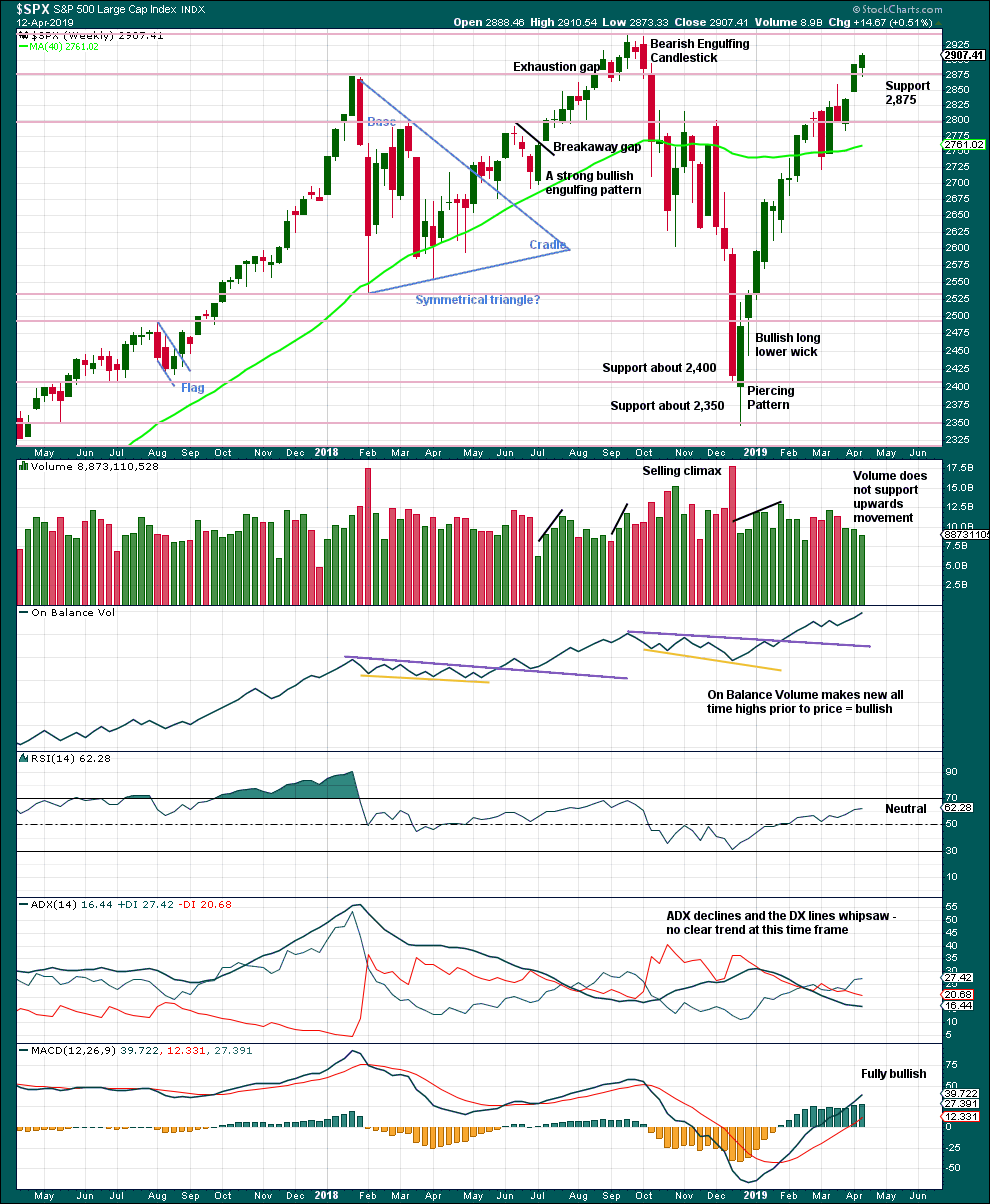
Resistance about 2,880 has been overcome. Next resistance is about the prior all time high about 2,940.
On Balance Volume makes another new all time high this week strongly supporting the Elliott wave count.
A decline in volume while price moves higher is not of concern given current market conditions. This has been a feature of this market for a long time and yet price continues higher.
DAILY CHART
Click chart to enlarge. Chart courtesy of StockCharts.com.
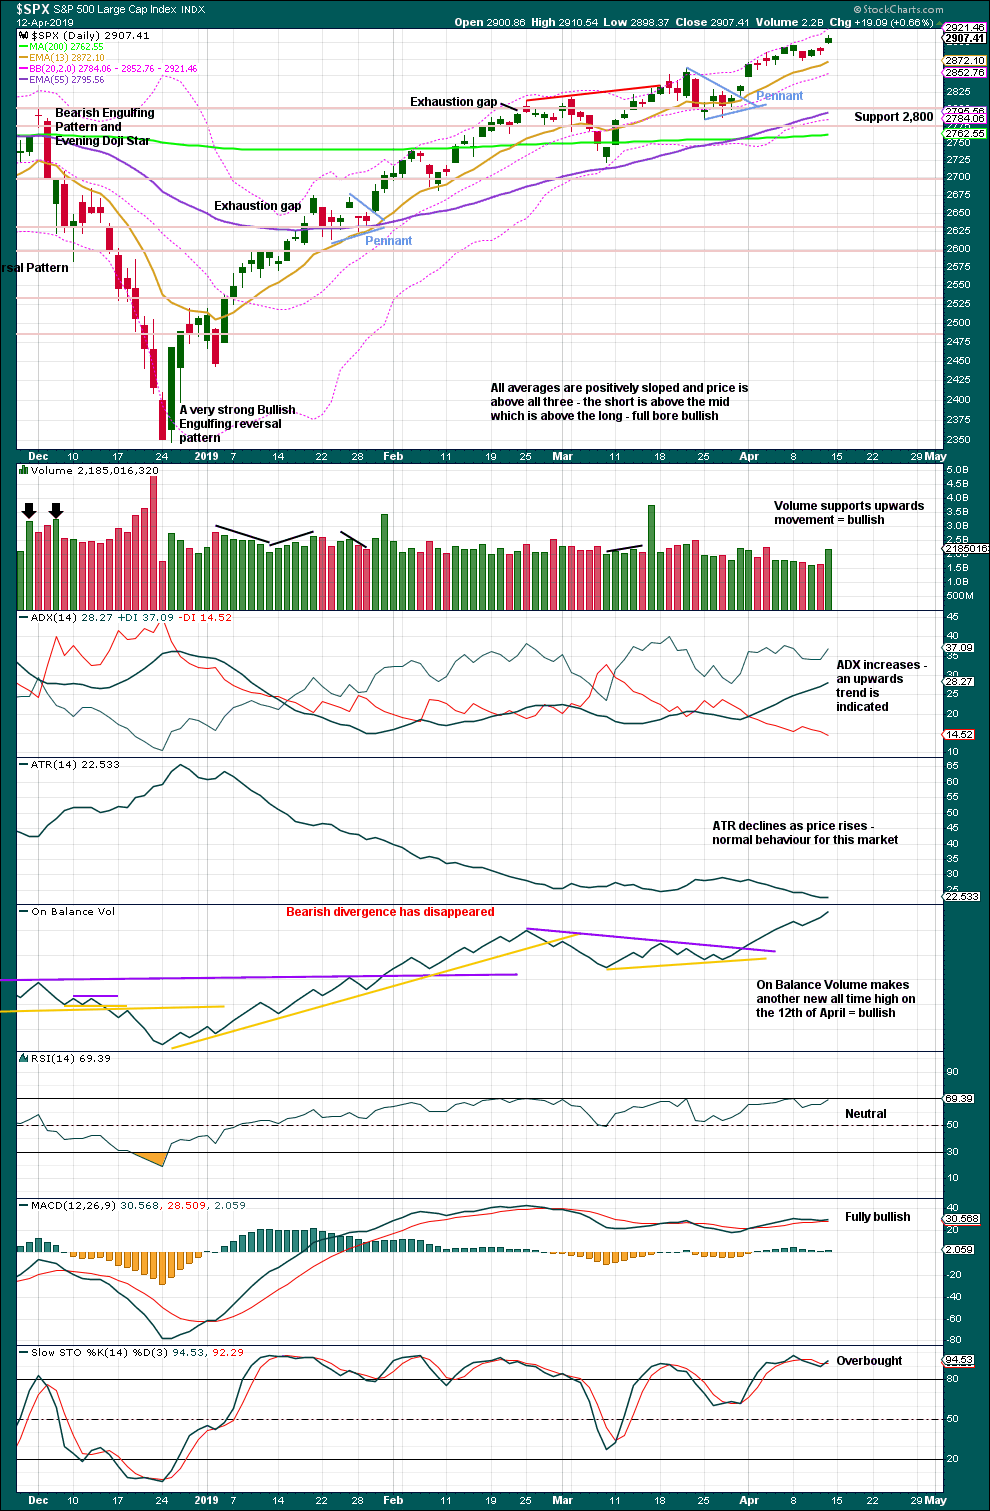
The December 2018 low is expected to remain intact. The two 90% upwards days on 26th December 2018 and 6th January 2019 indicate this upwards trend has internal strength.
Lowry’s data shows that on the 8th of April Selling Pressure has reached another new low for this bull market, and Buying Power has reached a new high for this rally. This indicates an expansion in demand and a contraction in supply, which has historically been associated with strong phases of bull markets. This strongly supports the Elliott wave count, which expects new all time highs to come this year.
While the last swing low of the 25th of March remains intact, there exists a series of higher highs and higher lows from the major low in December 2018. It would be safest to assume the upwards trend remains intact.
The pennant pattern is a reliable short-term continuation pattern. A target calculated using the flag pole is about 2,956.
A gap up on Friday may be another breakaway gap from a very small consolidation. It may provide support at 2,893.42. The breakaway is supported by volume for the short term.
BREADTH – AD LINE
WEEKLY CHART
Click chart to enlarge. Chart courtesy of StockCharts.com. So that colour blind members are included, bearish signals
will be noted with blue and bullish signals with yellow.
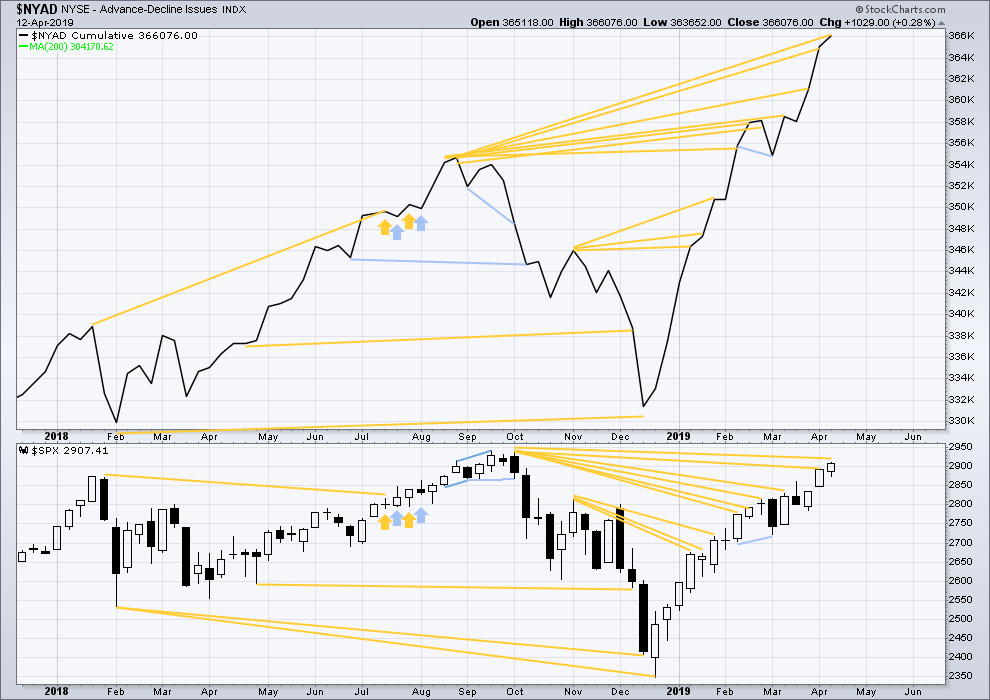
Every single bear market from the Great Depression and onwards has been preceded by a minimum of 4 months divergence between price and the AD line. With the AD line making a new all time high again last week, the end of this bull market and the start of a new bear market must be a minimum of 4 months away, which is the end of July 2019 at this time.
This week the AD line makes another new all time high. Bullish mid-term divergence continues.
Both mid and large caps have made new swing highs above the prior highs of the 25th of February, but small caps have not. This indicates some selectivity within this upwards trend.
DAILY CHART
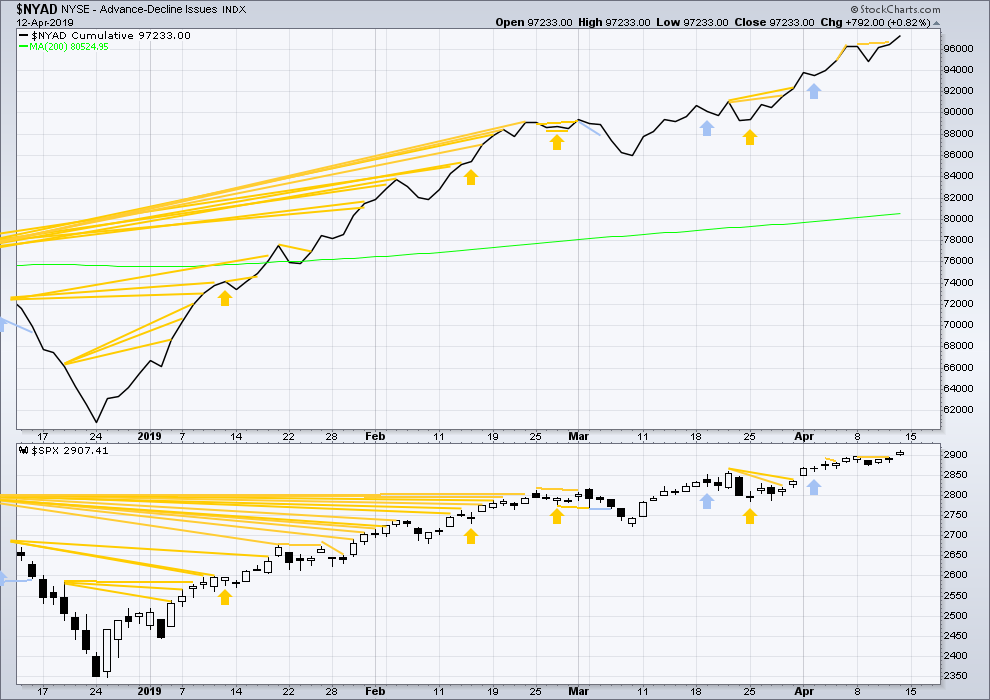
Click chart to enlarge. Chart courtesy of StockCharts.com. So that colour blind members are included, bearish signals
will be noted with blue and bullish signals with yellow.
Breadth should be read as a leading indicator.
Recent short-term bullish divergence has now been followed by upwards movement. Today both price and the AD line moved higher. Upwards movement has support from rising market breadth.
VOLATILITY – INVERTED VIX CHART
WEEKLY CHART
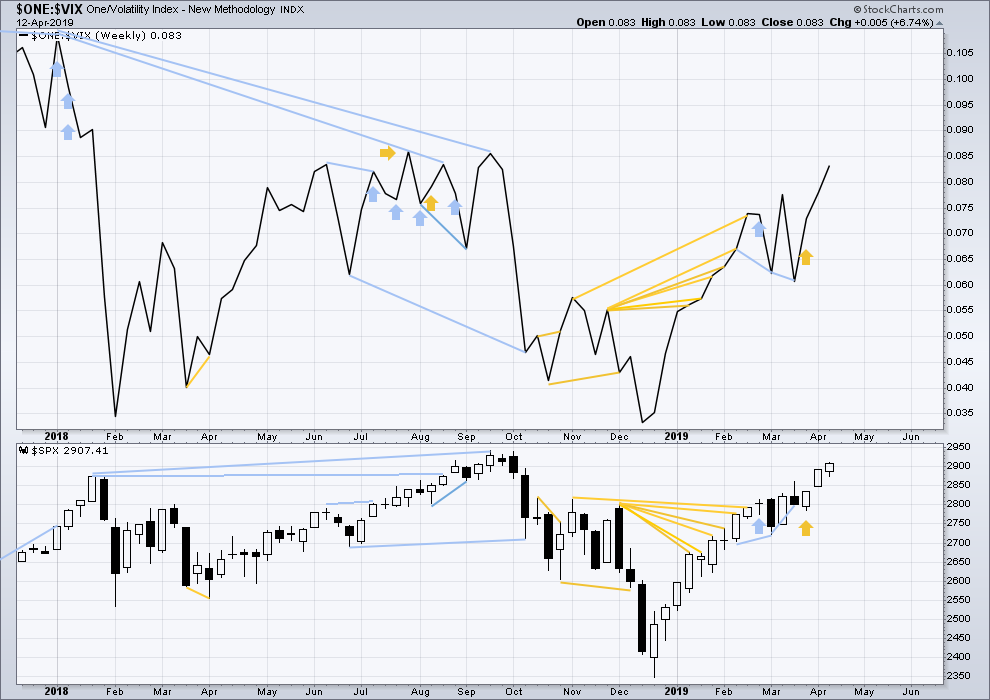
Click chart to enlarge. Chart courtesy of StockCharts.com. So that colour blind members are included, bearish signals
will be noted with blue and bullish signals with yellow.
This week both price and inverted VIX have moved higher. There is no mid or short-term divergence. Long-term divergence between all time highs remains.
DAILY CHART
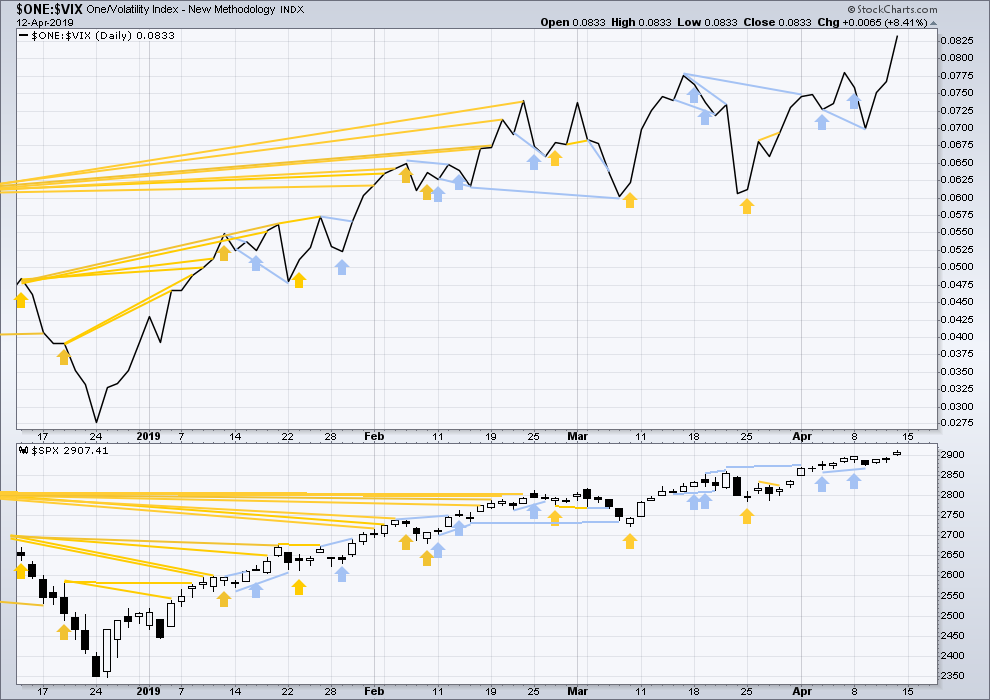
Click chart to enlarge. Chart courtesy of StockCharts.com. So that colour blind members are included, bearish signals
will be noted with blue and bullish signals with yellow.
Both price and inverted VIX moved higher on Friday. There is no new short-term divergence.
DOW THEORY
Dow Theory confirmed a bear market in December 2018. This does not necessarily mean a bear market at Grand Super Cycle degree though; Dow Theory makes no comment on Elliott wave counts. On the 25th of August 2015 Dow Theory also confirmed a bear market. The Elliott wave count sees that as part of cycle wave II. After Dow Theory confirmation of a bear market in August 2015, price went on to make new all time highs and the bull market continued.
DJIA: 23,344.52 – a close on the 19th of December at 23,284.97 confirms a bear market.
DJT: 9,806.79 – price has closed below this point on the 13th of December.
S&P500: 2,532.69 – a close on the 19th of December at 2,506.96 provides support to a bear market conclusion.
Nasdaq: 6,630.67 – a close on the 19th of December at 6,618.86 provides support to a bear market conclusion.
With all the indices moving now higher, Dow Theory would confirm a bull market if the following highs are made:
DJIA: 26,951.81
DJT: 11,623.58
S&P500: 2,940.91
Nasdaq: 8,133.30.
Published @ 01:03 a.m. EST on April 13, 2019.
—
Careful risk management protects your trading account(s).
Follow my two Golden Rules:
1. Always trade with stops.
2. Risk only 1-5% of equity on any one trade.

Hourly chart updated:
Sideways movement today may have been minute wave iv continuing. The last gap remains open, it may continue to provide support
bought the dip, looking to fill the gap at SPY 291.7
I’d like to touch on 2 topics; the modeled target of 2872 and (2) what happened last week.
We know that the model works, so why isn’t it working now? Here’s the approach we are using to work through this. It was designed to use recent data. The data used is found on the daily chart and includes the numbers since the most recent daily reversal peak or the most recent daily reversal low. For this target of ES 2872, the data modeled was from the start of Dec 2018 to present day. That has shown to be not what they are using. So, what are they looking at? It’s possible that they are using the data from Q4 2018 through present day. We have added the Oct ’18 and Nov ’18 data to the model. And, the model has generated a new target of ES 2927. 2927 is 55 points above 2872. If the 2927 doesn’t react sufficiently in time and sales, then the model will be proven to not have utility.
Last week the ES spent all its time drawing up an inverse head and shoulders and then breaking the neckline on a 61.8% fib extension. The thing that jumps out at me is the absolute perfection that the pattern has, including the most level neckline in TA history. It is so obvious that it makes me suspect a bull trap is being set. It’s like Jussie Smollett drew it.
The inverse H&S measurement target is at (around) ES 2923, which seems easily doable. But, the bullish pattern will stick with people and manage their expectations. They will buy into any “dips” below 2923.
Who says I am getting old and slipping? #1 for the weekend!
And may I add, excellent analysis this week as it is every week. Lara is simply the best there is at her craft and in her offerings to the public. As I have for the last couple of months, I continue to favor the fist Alternate monthly wave count. I believe this bull market has several years left. If that is the case, we should move above the main count target of 3045 relatively soon and with relative ease.
I continue to recommend Ciovacco Capital’s YouTube channel for your viewing. This week’s video presents much support for case that we are going much, much higher in the US equity markets. Of course, Mr. Ciovacco makes no predictions. He just looks at the data we have on hand today and states that it supports the probability that good things (bullish things) may happen for a long time.
I must not forget the Point & Figure charts I posted yesterday as one piece of evidence that supports the first monthly Alternate count. The SPX charts have a standing target of 3809. Let the reader be forewarned.
Have a great weekend Lara and all subscribers. Be safe, have joy, and make fond memories with those you love.
Hey Rodney, I am a Ciovacco fan too. However, his recent “short takes” video just doesn’t sit well with me. For example, his “mother of all breadth signals” chart uses 2 horizontal reference lines. The lower line is the level we were at a couple of months ago. The upper is the level we are at now. This is recency bias, which attaches greater significance to events that have just happened.
His two timeframes that he has highlighted to be significant, begin in 2009 and 2011. Then he charts out results for up to 5 years for each timeframe. This uses overlapping data sets to support a conclusion. Then, he displays 10 year, S&P 500 charts for both timeframes to illustrate that good things happen. Again, he is using essentially the same data set to make 2 separate supporting statements about good things happening.
Over the past few months I have heard the remark in his videos about “the probability of” something happening. It drives me crazy and I find it hard to stay in my chair. Probability is a real thing that can be accurately quantified and measured. Much of his interpretation doesn’t account for things like reversion to the mean, standard deviation, variability, or outliers. For God’s sake man, hire a professional statistician and perform some statistical analysis.
In the most gentlemanly way possible, I’ll say that his scientific methodology lacks authenticity. I will add that I admire his spirit in thinking outside of the box.
the Ciovacco chart
With the MACD set up, he shows that historically since 1950, 16 times out of 16 times with such set ups, the market was POSITIVE after 2 years time.
Let’s assume that the probability of getting such a result was 50% (16 straight “winners”). What’s the probability of the underlying setup producing yet ANOTHER winner (up after 2 years time)?
The answer is 95.8%. At a 95.8% probability level of producing a positive result after 2 years, it’s a 50% chance you’ll get 16 winners in a row.
Of course, the average and median gains at 2 years of the 16 cases are all rather large.
I think this is a very strong statistical case for a bullish posture at the monthly and weekly timeframes, myself. And this is ignoring the other independent historical setups he also has assessed recently (though none of them were as statistically compelling as this one).
The similarity on the weekly chart to early 2012 is striking. Note what happened next then: price got just a little bit into new ATH territory, and another (but much smaller) correction hit. Then off to the races in a hugely consistent manner.
It is time to deploy longer term bullish strategies in general, I agree. This economic slowdown may very well be over by the time it’s formally recognized. The market seems to already be discounting beyond it. (I consider the average market discounting to cover roughly the next 9-10 months).
The MACD study data was strongly compelling. The odds a positive market going forward based on this set up’s history for the last 70 years has got to be 95%, minimum, based on the historic data. One could argue it’s time to go “all in” relative to one’s own allocation models based on this, and I would expect Ciovacco has the actual posture in the market now. What more would he be looking for? 16 out of 16 times, up at the 2 year market, and the vast majority solidly up. That’s a powerful darn statistic that you are going to have a heck of a time ever replicating with ANY set up. And the set up is right here, right now.
Good morning Kevin, or in your case, good middle of the night. SoCal, right?
I’m concerned about going long at the market top. Here is the big picture chart. I see the SPX moving over the last 15 years in this fibonacci framework. The bull market since 2009 has had a few multi-month retracements. The SPX would climb to a significant fib level, then retrace and continue the climb higher.
What looks different to me, is that the market retraced in 2018 and 2019 before having reached a significant fib level. It’s hard to see the 423.6% fib extension, but it’s way up at the top of the chart and it is a level at SPX 3003. That would be the next major fib extension level and the SPX is struggling to reach it. The market isn’t required to get up there before it could stop being a bull market and start a bearish move.
I don’t like what the chart is doing (post 2017).
Nor, NorCal. We are building a wall across CA around San Luis Obispo to separate the state, as a matter of fact. Okay, just kidding.
I think the intermediate/long term bull case is extremely strong. Lara’s EW call is one factor. Ciovacco’s analysis and compelling set up data is another. The third is the relatively minor size of this current recession.
Thanks for your assessment. I have stops. I am in at a daily TF trade, a weekly TF trade, and monthly, different amounts, different stop levels based on respective tf charts.
What about “what the chart is doing” after 2017 do you “not like”?
A casual observer of this chart might conclude that since the massive 2009 bear market, after each visible pullback of a couple of months duration, the markets then runs up in a strongly consistent manner for significant periods of time. And such a period is just now starting.
What about this chart tells you something different?
If the chart had reached the 423.6% major fib extension level and then retraced/gone sideways for 16 months, I would love the long.
But the opposite is occurring. I don’t see this as a coy maneuver intended to obscure their true intensions. It’s way too big to be considered a head fake. I am still a believer in Lara’s upper end limit of SPX 3477.39
I don’t know that the market will go from here to the ATH in one steady climb.
I wouldn’t be surprised to see the market move back to SPX 2000, which is where it was trading less than 3 years ago. I don’t like the chart because I see it failing to reach the next major level and retracing before it has reached that major fib level, rather than retracing after hitting its target. It looks like the bull market is unraveling.
Lara’s weekly chart projected target of SPX 3045 is so close to where we’re at today (2900). The market needs to climb just 5% to hit her projection. I think it’s a brilliant target. The market needs to go through 3003 (the 423.6% fib extension) and it is not doing it.
The market could go to 2000, for instance, and then eventually hit the 3045 target.
I wish you and everyone all the best results.