A small downwards day remains well above the short-term invalidation point. Today VIX and the short-term volume profile offer support to the main Elliott wave count.
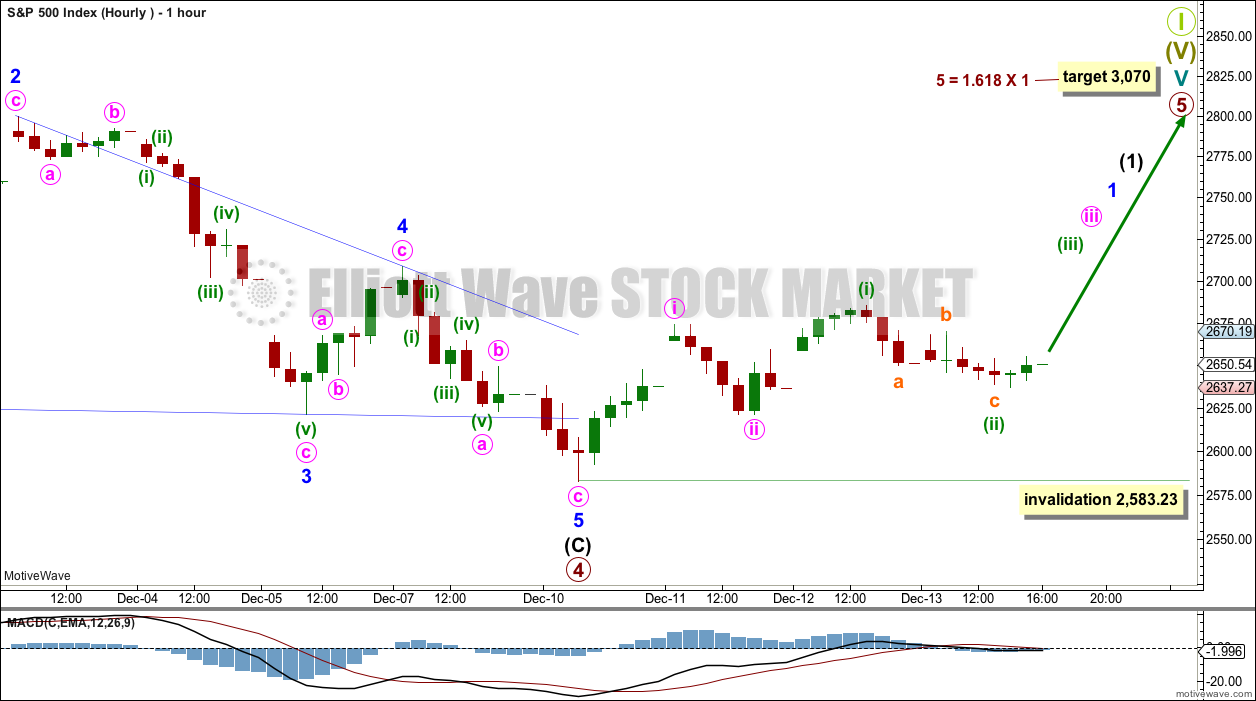
Summary: A strong bullish Hammer candlestick reversal pattern at the low indicates a trend change. The target for primary wave 5 to end is now 3,070. This may be met next year. March is the first expectation.
If price keeps rising through this first target, then a new target would be calculated and the expectation for the bull market to end may then be in October 2019.
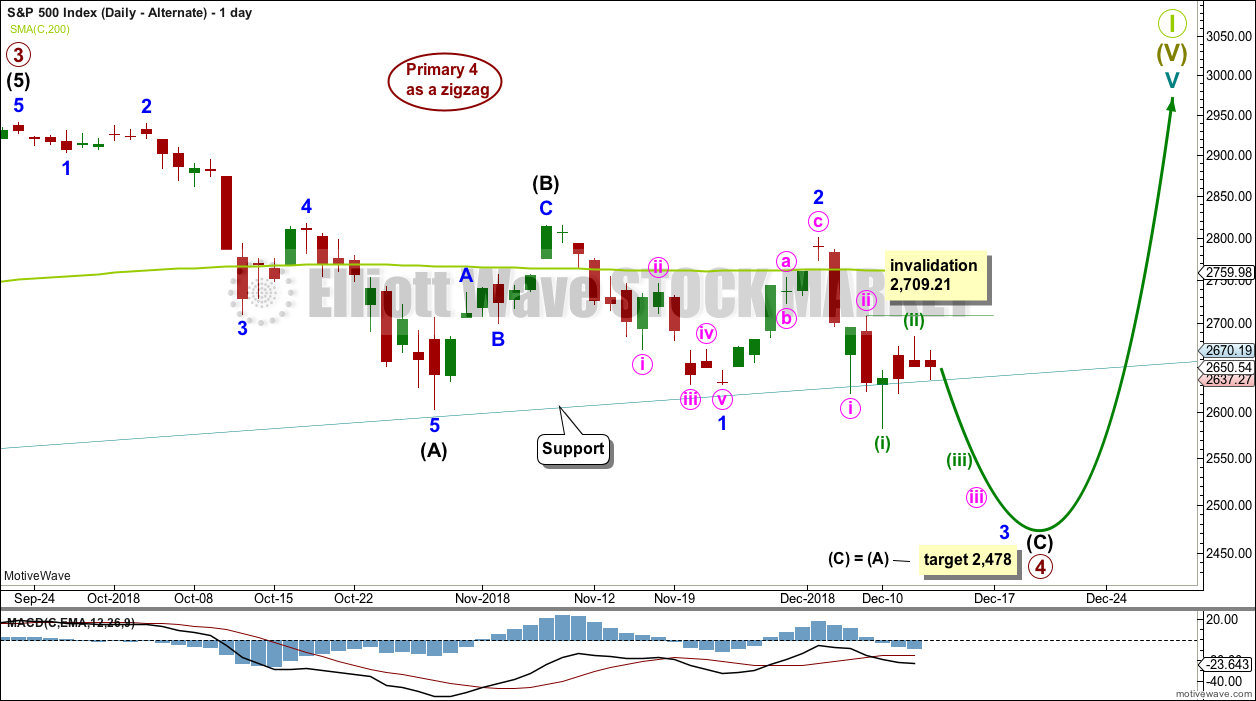
If price makes a new low below 2,583.23, then the target for the end of primary wave 4 would be about 2,478.
New updates to this analysis are in bold.
The biggest picture, Grand Super Cycle analysis, is here.
Last published monthly chart is here, video is here.
MAIN ELLIOTT WAVE COUNT
WEEKLY CHART
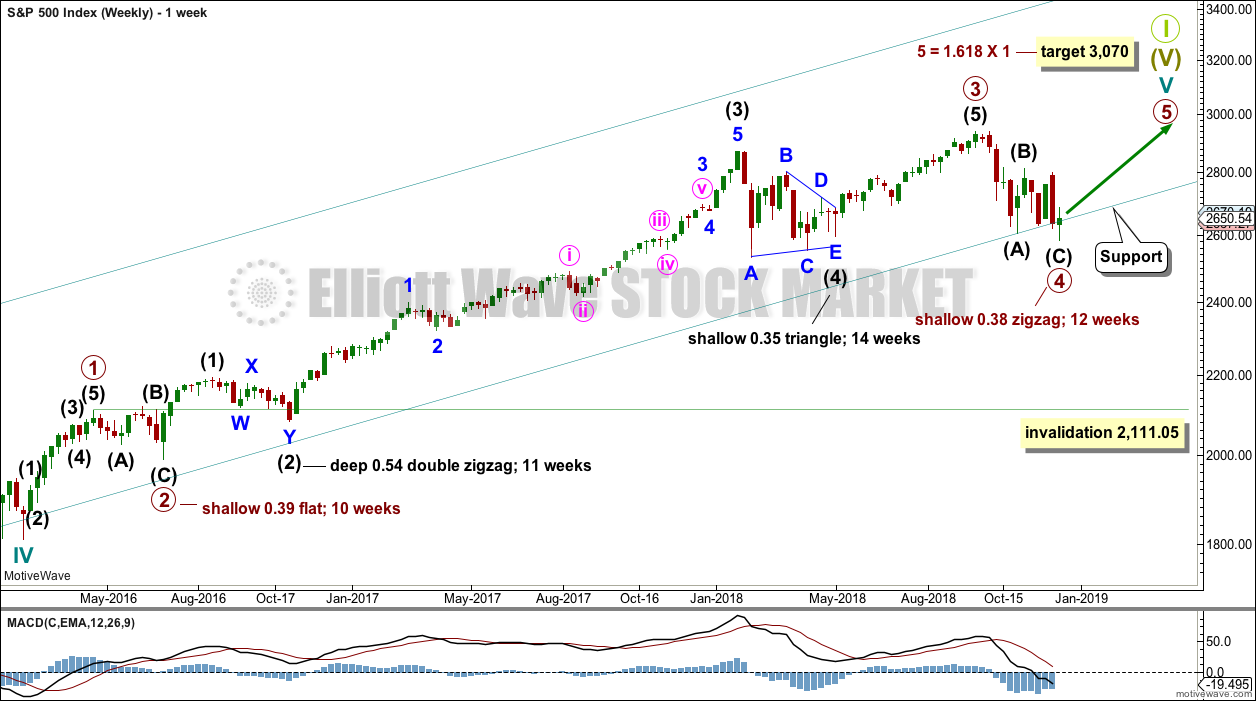
Cycle wave V must complete as a five structure, which should look clear at the weekly chart level and also at the monthly chart level. It may only be an impulse or ending diagonal. It is clear it is an impulse.
Within primary wave 3, there is perfect alternation and excellent proportion between intermediate waves (2) and (4).
Draw the teal channel from the high of cycle wave I at 1,343.80 on the week beginning 3rd July 2011, to the high of cycle wave III at 2,079.46 on the week beginning 30th November 2014, and place a parallel copy on the low of cycle wave II at 1,074.77 on the week beginning 2nd October 2011. Draw this chart on a semi-log scale. A small overshoot, like that seen at the end of cycle wave IV, would be entirely acceptable. If price does move below the channel, then it should reverse reasonably quickly.
Primary wave 4 may be over at the last low as a complete zigzag. The teal trend channel is overshot, which is acceptable; this has happened before at the end of cycle wave IV.
This wave count has the right look at the monthly chart level.
If primary wave 5 ends at or after the end of December 2018 and the AD line fails to make new all time highs, there would then be the minimum required four months of bearish divergence between price and the AD line. If this happens, then the conditions for the end of this bull market would be in place.
Primary wave 4 may not move into primary wave 1 price territory below 2,111.05.
Two daily charts below are published in order of probability.
DAILY CHART
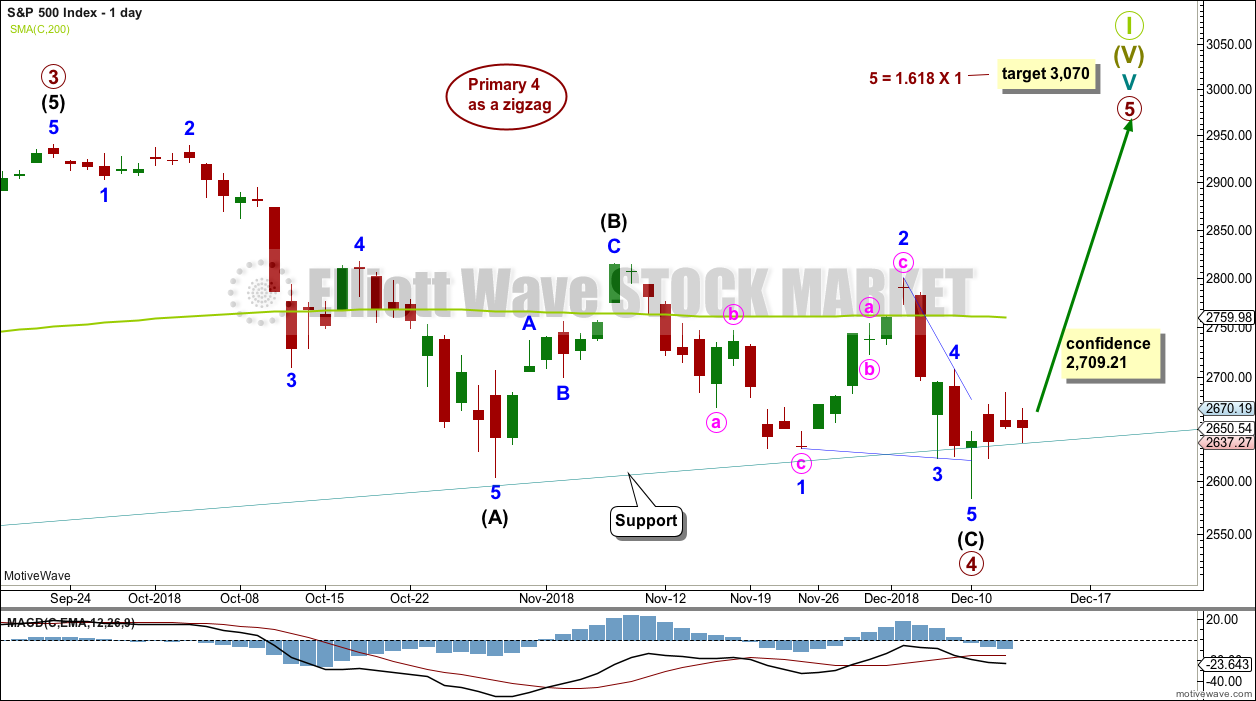
Primary wave 4 may be a complete single zigzag.
Within the zigzag, intermediate wave (C) must subdivide as a five wave structure. It may be a complete ending contracting diagonal.
Within the ending diagonal, all sub-waves must subdivide as zigzags, minor wave 4 must overlap minor wave 1 price territory, and minor wave 4 may not move beyond the end of minor wave 2 above 2,800.18.
Minor wave 5 may have ended with an overshoot of the 1-3 trend line.
If primary wave 5 were to only reach equality in length with primary wave 1, it would be truncated. The next Fibonacci ratio in the sequence is used to calculate a target.
HOURLY CHART
Within the new trend of primary wave 5, minor wave 2 may not move beyond the start of minor wave 1 below 2,583.23.
Within primary wave 5, there may now be two overlapping first and second waves to begin minor wave 1. This wave count would now expect some increase in upwards momentum, possibly in the next session.
ALTERNATE DAILY CHART
The other possible structure for intermediate wave (C) would be a simple impulse. If intermediate wave (C) is unfolding as an impulse, then it may now have three first and second waves complete. This wave count would expect to see an increase in downwards momentum as the middle of a third wave unfolds.
Within minute wave iii, minuette wave (ii) may not move beyond the start of minuette wave (i) above 2,709.21.
This wave count would expect to see a very large breach of the teal trend channel on the weekly chart. This has not happened during the life of this trend channel.
The S&P commonly forms slow curving rounded tops. When it does this, it can breach channels only to continue on to make new all time highs. It is possible that Super Cycle wave I may end in this way.
TECHNICAL ANALYSIS
WEEKLY CHART
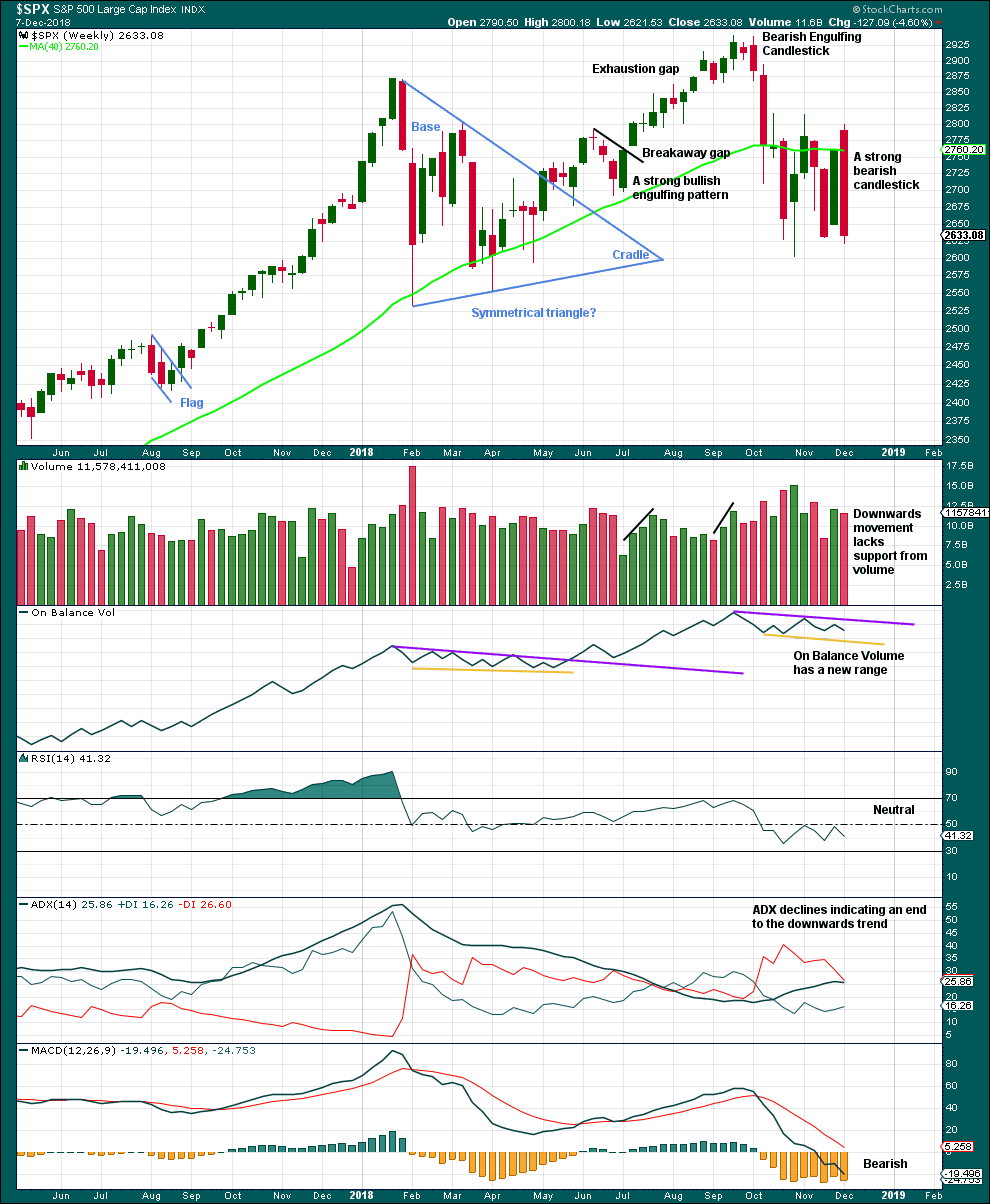
Click chart to enlarge. Chart courtesy of et=”_blank”>StockCharts.com.
Last weekly candlestick is a strong bearish candlestick, but does not meet all the criteria for a Bearish Engulfing pattern. From Nison, “Japanese Candlestick Charting Techniques” page 43:
“There are three criteria for an engulfing pattern:
1. The market has to be in a clearly definable uptrend (for a bearish engulfing pattern)…
2. Two candles comprise the engulfing pattern. The second real body must engulf the prior real body (it need not engulf the shadows).
3. The second real body of the engulfing pattern should be the opposite colour of the first real body.”
This market is not currently in a clearly definable upwards trend, so the first criteria is not met.
A decline in volume last week may be due to the week being a short trading week, and so it would be best to look inside the week to determine the short-term volume profile.
However, the strongest volume for recent weeks is for the upwards week beginning 29th of October. This short-term volume profile at this time frame is bullish.
For a more bearish outlook a bearish signal from On Balance Volume would be preferred.
DAILY CHART
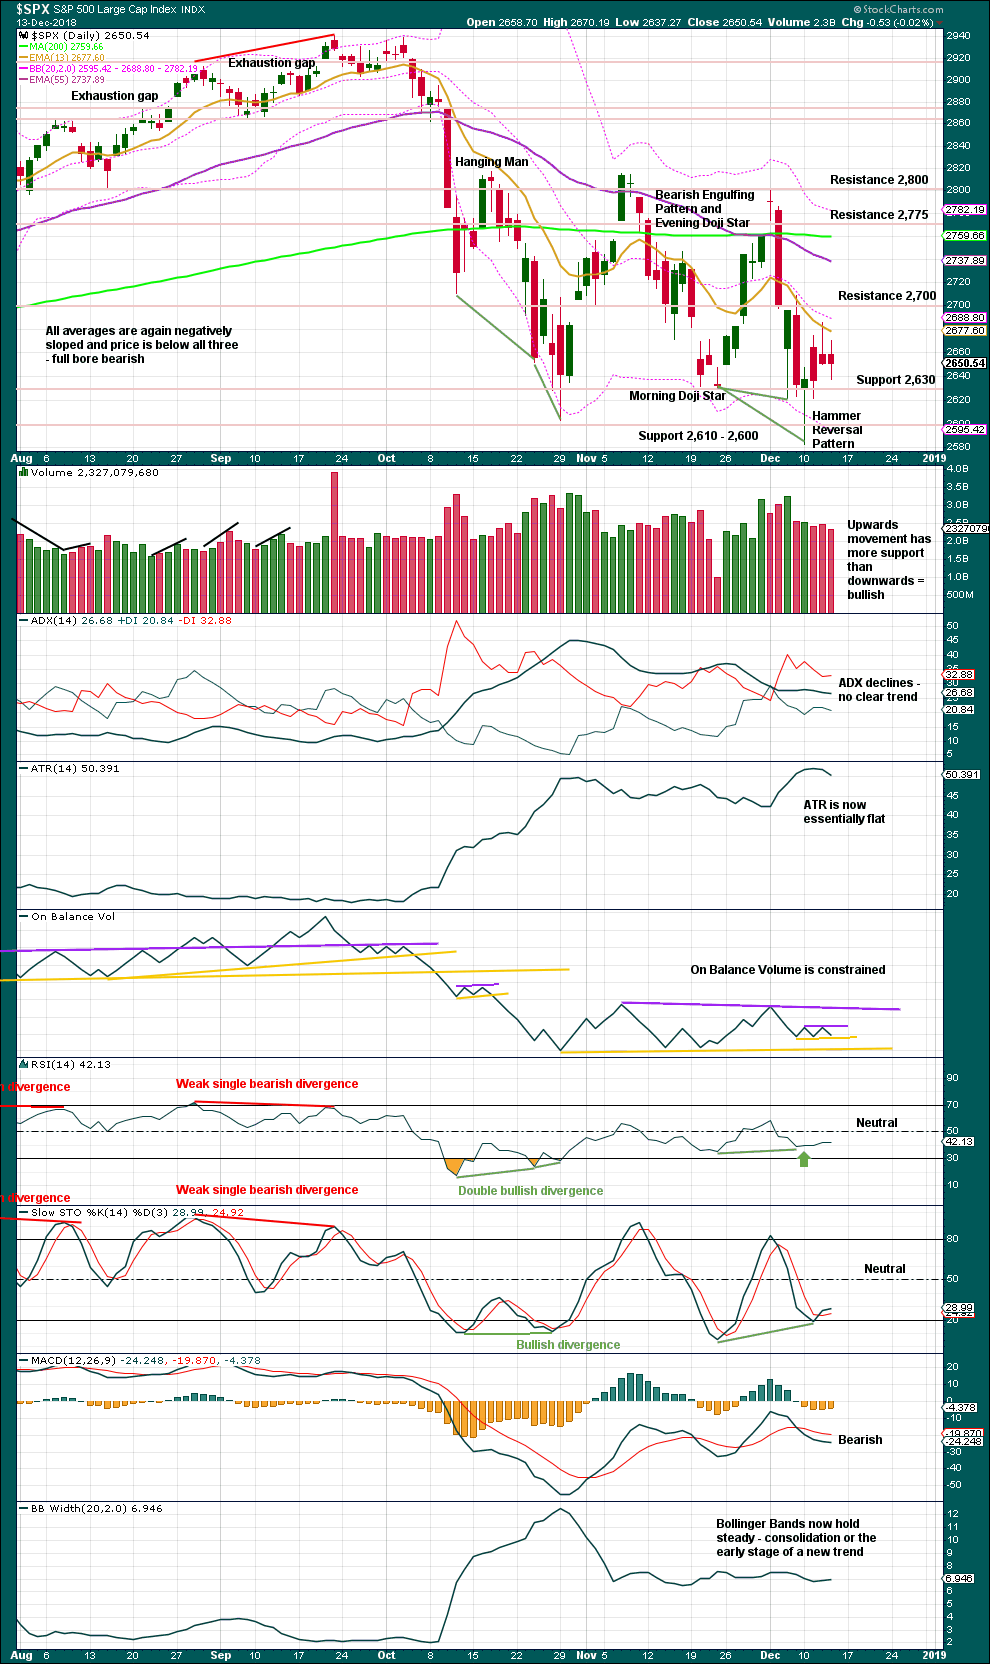
Click chart to enlarge. Chart courtesy of StockCharts.com.
The lower edge of the teal trend channel is not shown on this chart, but it should be considered as part of this technical analysis. Expect that trend line to continue to provide support, until it does not.
Currently, this market is consolidating with resistance about 2,815 and support about 2,605 to 2,620. It is the upwards day of the 30th of October that has strongest volume during this consolidation, suggesting an upwards breakout may be more likely than downwards. This technique does not always work, but it does work more often than it fails.
With the strong Hammer candlestick reversal pattern, it still looks like a low is in place.
There is very strong resistance ahead at 2,700 and then at the 200 day moving average. For this consolidation, only a close above the upper edge of resistance at 2,800 on an upwards day with support from volume would give confidence that a new upwards trend is in place. While price remains within the consolidation zone, both Elliott wave counts will remain valid and must be considered.
Two new very short-term trend lines are drawn on On Balance Volume. A break out of this small zone would be a short-term weak signal.
BREADTH – AD LINE
WEEKLY CHART
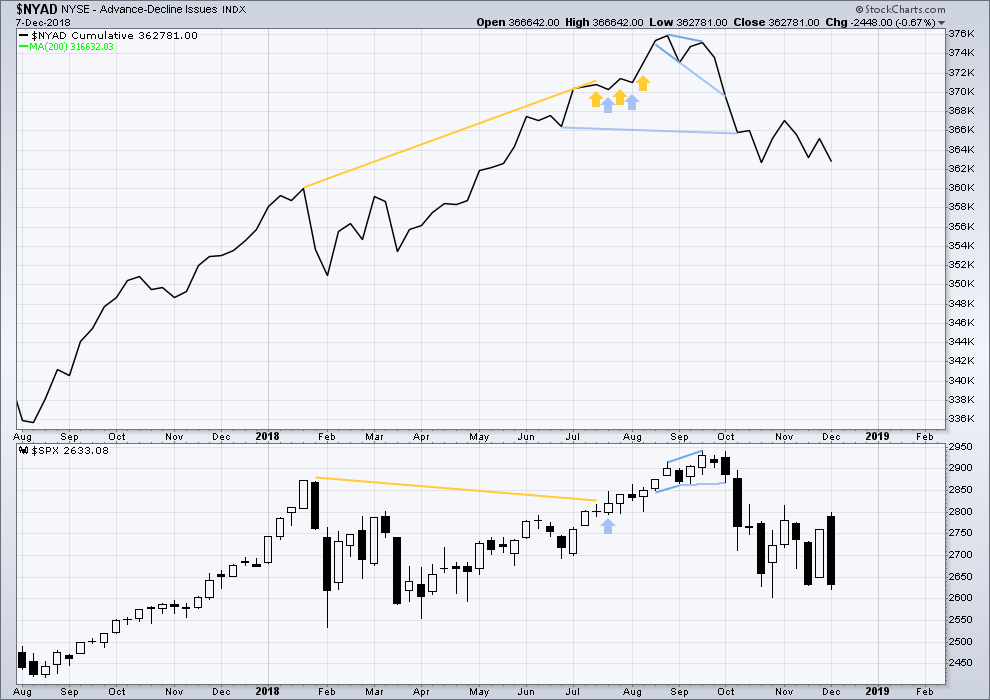
Click chart to enlarge. Chart courtesy of StockCharts.com. So that colour blind members are included, bearish signals
will be noted with blue and bullish signals with yellow.
Both price and the AD line have moved lower last week. There is no divergence, and the AD line is not falling any faster than price here.
DAILY CHART
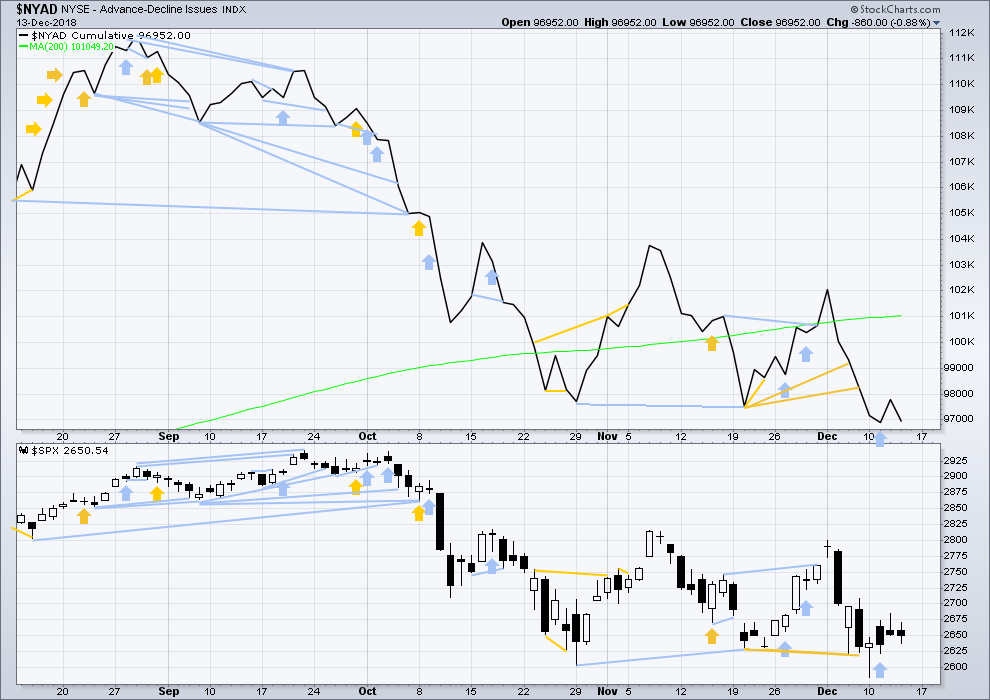
Click chart to enlarge. Chart courtesy of StockCharts.com. So that colour blind members are included, bearish signals
will be noted with blue and bullish signals with yellow.
There is normally 4-6 months divergence between price and market breadth prior to a full fledged bear market. This has been so for all major bear markets within the last 90 odd years. With no longer-term divergence yet at this point, any decline in price should be expected to be a pullback within an ongoing bull market and not necessarily the start of a bear market. New all time highs from the AD line on the 29th of August means that the beginning of any bear market may be at the end of December 2018, but it may of course be a lot longer than that.
Breadth should be read as a leading indicator.
Today both price and the AD line have moved lower. Downwards movement has support from declining market breadth. Neither have made new lows. There is no new divergence.
Nearing the end of this bull market, to the end of primary wave 5, bearish signals from the AD line may begin to accumulate.
VOLATILITY – INVERTED VIX CHART
WEEKLY CHART
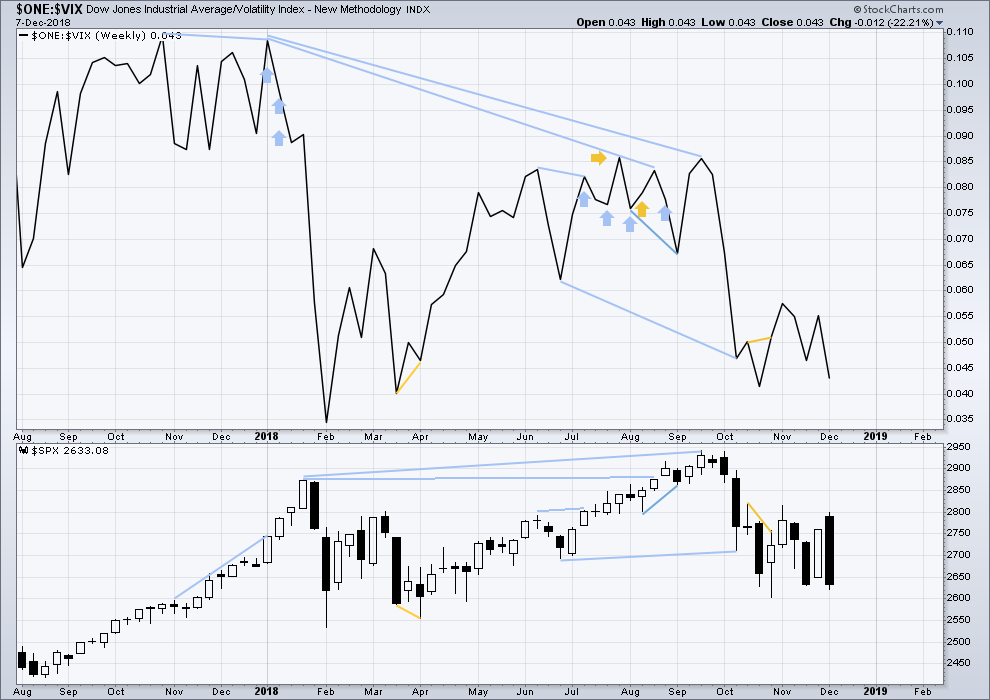
Click chart to enlarge. Chart courtesy of StockCharts.com. So that colour blind members are included, bearish signals
will be noted with blue and bullish signals with yellow.
Both price and inverted VIX have moved lower last week. The fall in price comes with a normal corresponding increase in volatility, but VIX is not increasing any faster than price. There is no divergence and no bearish signal.
DAILY CHART
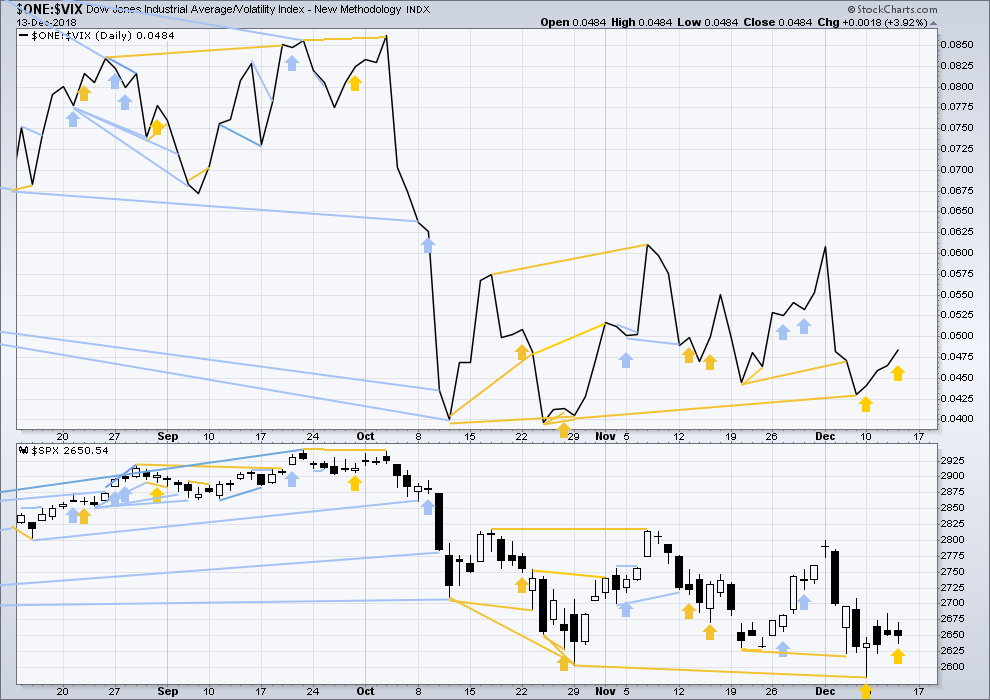
Click chart to enlarge. Chart courtesy of StockCharts.com. So that colour blind members are included, bearish signals
will be noted with blue and bullish signals with yellow.
Normally, volatility should decline as price moves higher and increase as price moves lower. This means that normally inverted VIX should move in the same direction as price.
Like the AD line, inverted VIX may now begin to accumulate instances of bearish signals or divergence as a fifth wave at three large degrees comes to an end.
Today price moved lower, but inverted VIX moved higher. Downwards movement today does not have normal increase in VIX; it comes with a decline in VIX. This divergence is bullish.
DOW THEORY
The following lows need to be exceeded for Dow Theory to confirm the end of the bull market and a change to a bear market:
DJIA: 23,344.52.
DJT: 9,806.79 – although a new low below this point has been made, price has not closed below this point.
S&P500: 2,532.69.
Nasdaq: 6,630.67.
Published @ 10:20 p.m. EST.
—
Careful risk management protects your trading account(s).
Follow my two Golden Rules:
1. Always trade with stops.
2. Risk only 1-5% of equity on any one trade.

Apple $165.28 LOW / THREE DAY VIEW [When “euphoria” drops under its own support we SHORT with bearish divergence adds to the fun and we SELL $233.47.]
Cool charts and indicator but it isn’t helpful to us unless we can use it ourselves.
What happened to the bull market….
Well here is an idea…
It’s just a primary 4 (down). Panic and fear is part of the game.
I agree.
But damn, those steaks look good!
I think they are dry aged t-bones. Dry aged steaks are the best.
I’m doubtful the bottom is in yet. I suspect SPX spikes downs to and turns off 2558 (double bottom) and RUT off the 1382-1390 levels is likely. And NDX…maybe close to 100% at 6534.
That would make sense if computers are out there hunting stop loss orders. There is probably a pile of them sitting just underneath those april lows.
The daily chart is so bad looking with todays candle. Monday should be very telling.
2596. Pucker thyself.
I paid for this whole damn seat…. but I’m only using the edge of it!
There may be a few members who did not receive my email earlier this week with Christmas / New Year holiday dates. So I’ll copy it below for you:
“Dear Elliott Wave Stock Market Members,
It’s that time of the year again.
Once a year I need to take a holiday. I take two weeks over Christmas / New
Year because it includes two less open sessions and so means I only miss
analysis for eight sessions.
This year there will be no analysis from Monday 24th December 2018 to
Friday 4th January 2019.
Analysis will resume on Monday 7th January 2019 and I will prepare a video
for you on this day as well.
This is necessary so that I can continue to provide you with analysis long
term. If I did not take a break once a year I would burn out.
I have some excellent news to add at this time. I am currently training a
new analyst on Elliott wave and technical analysis. She may be ready to
begin to publish analysis under my supervision over the next few weeks.
I wish all our members a very Merry Christmas and Happy New Year. May you
all be safe and healthy, and lets all look forward to profits next year.
Next year may be a particularly exciting one.”
Updated hourly chart:
It’s now possible that minute ii could be over. The structure of minuette (c) may now be a complete five wave impulse.
Seeing some Santa Rally call options being picked up for Dec 31 in tech. Might be time.
Testing the waters in Spy again. Upper 261’s.
Any thoughts on crude oil?
Up 3.5% yesterday, down 3% today…
Looks like it might break out upwards, until today, lol
Hourly chart updated:
I had left the invalidation point at the low to allow for the possibility that minute ii could continue lower, which it may have done today. Minute ii may be an expanded flat. The structure of minuette (c) looks like it needs one final low to complete.
Price is clearly being squeezed. It will break out. I had really hoped for it to do so today to give us some clarity but that now looks like it won’t happen.
Volume suggests an upwards breakout is more likely. That doesn’t mean it has to happen, nothing in TA is 100% certain. It only means it’s more likely.
Right on. Base building = price squeeze? We shall see.
I don’t think we breakout until after the Fed decision next week. Sneaky feeling rates are left unchanged and we see a massive squeeze.
Fed decision and that sweet government shutdown one week from today.
Oh let’s throw in a few new indictments of “friends and family members” for good measure!
Happy Holidaze…
Agreed. Indictments aside (or included I guess) policy makers can control whether this market collapses or enters a massive squeeze with a few decisions next week. That amounts to effectively (the possibility of) legal market manipulation and scary to me. I’m shocked VIX isn’t much higher today. I’m trusting the wave count and vix today and buying some SpY Dec 21 270 calls. Prepared to let them expire worthless.
2605.7 is the 78.6% retrace level of the up move and may (may) hold it here.
Or maybe we are to get a double bottom.
Or maybe the GSC is complete and the market is headed to 1200 over the next year or two. Lol!!!!!! Paranoia strikes deep, into your life it will creep, it starts when you’re always afraid, get out of line, the market sweeps you away!
Also isnt today the move from Dec to March ES contracts? Historically does that add to the confusion?
Nah.
Yes – today is “rollover” day typically (2nd Friday of the contract month)
Guess I should have clarified, rollover day, but most of the volume has already moved on to March.
Long term weekly of CVS. The 8 month or so trend line is tagged again, exactly at the 50% retrace level. Note the last hit on the same TL: exactly at the 61.8% retrace level.
I will be taking buy triggers. The EV here should be very good, and a high reward/risk ratio is the recent low is used as a stop. Not advice just a set up for consideration.
NFLX in day 3 of a squeeze on rising momentum and a higher swing low in place.
adding, slowly, since it hasnt breached the downward channel
went 20% long on spy $263.05
breakeven stop now. (not screwing around with losses)
SOHWFV (Sitting on hands waiting for Verne) 🙂
But at least financials are green….. one good signal
And RTY…. which has been the canary in the coal mine since October… first to green today.
I get so dizzy even walking in a straight line …
Its all so choppy. Was already stopped out. AAPL plunged to 166 and where AAPL goes, SPY goes.
Take care..
Don’t get too overly bearish, there’s possibility of liquidation, if u see it then don’t try to catch the falling knife and we could end up around low 2500 by Eod. But if it doesn’t get liquidated, we could easily close around 2650s and rip next week…
The futures are down and seems the open might be below support…
But if it’s the alternate unfolding than the whole action yest didn’t seem like and impulsive move to the downside (ie 3 of 3), it was more choppy and seemed corrective, on that basis seems like some kind of corrective move to the downside?? So it should resolve to the upside?
Am i reading this correctly?
It’s been quite difficult action past few days, sometimes best to just wait and let it resolve one way or another… my feeling we open down then after setting up a low in 1.5 hrs after open rally all day…. obviously price action is more important and i’ll let that confirm if i am wrong
That’s how I read it.
I keep thinking, if the alternate was my main count, how would I be reading it? I’d be very concerned quite frankly. This movement really does not look like the start of a third wave at three degrees. It’s choppy and slow, and weak.
I could be wrong of course and it could resolve itself with a strong downwards breakout.
But that hasn’t happened, and I can only analyse the data in front of me.
And please keep doing just that…and only that!!!
All these other pundits will inform us about the surrounding noise, fire and fury.
I like your assessment of the “not looking right” nature of the alternate. An important perspective.
Lara
In your main hourly don’t you mean minuette I may not move lower than the end of minute II?
No, because the invalidation point for minuette (i) was at 2,621.30.
So the invalidation point is lower to allow for the possibility (which I’ll now publish above) that minute ii continued lower.
Or minor 2. It is the same for both degrees.
3 DAY Apple +5% Capitulation [with Monthly $160.63+ hidden bullish divergence ] 50 to 62% bounce would be fair.
Curious how that will look with a $2 gap down.
Also has a bit of rsi diverg, but until it makes a move, it’s a no-go for me.
That being said, I think MSFT is turning into the “new” pony. Likely a lot of aapl money flowing in. Very strong comparably versus rest of tech.
Apple new lows without “euphoria” is always very bullish the key 160.63+ in my book.
I will try to post an update for you a bit later.
So what is the “euphoria” oscillator measuring?
Just noticed the alternative dipped to 2478 target. interesante.
IWM also broke its trend since 2009 today.
Also, this is incorrect as of today:
The following lows need to be exceeded for Dow Theory to confirm the end of the bull market and a change to a bear market:
DJT: 9,806.79 – although a new low below this point has been made, price has not closed below this point.
DJT closed 9,672.74 today. -1.64%
I think there will be a large attempt to hold this up tomorrow
I’m looking for a late day flush play as it fails
Running the downside in the last hour or so
When all put premiums have been milked for the day
Could be very high risk reward where ..05-.20 leftover put premiums become $1-2.-$3
Watched it happen a lot over the last couple weeks
Wouldn’t be surprising. I have some crossovers realllllllllllllly close to crossing up on ES. If we open flat or green, I may be going long. (or atleast attempt to)
If that’s the case…
I’ll be loading AAPL near month near money calls
I just don’t see how the futures recover tonight
It will require shorting more vix futures ..
And that is a really dangerous game right now with where the markets are
But you never know what news could happen
If 4 isn’t over and the market really is going to make a new high
More weak hands need to be shaken out so the balloon can float
One last flush would do all that
And it’s right on the doorstep
And every bounce has been sold the last week… so there is not going to be buyers lined up IMO at these levels
Only higher ones after danger clears
I see more hold it up … and then let it go during tomorrow’s session
Futures don’t look good now, but we’ve seen a lot of pretty wide swings both inside and outside regular market hours. 20 pts is nothing when Spooz routinely pops or drops 80.
6:35am and it certainly not crossing haha. Futures even lower.
If it crosses won’t be until Monday, minimum, if market doesn’t plunge.
Noted. Thanks jmdrew.
Wouldn’t a close below that trend line on the weekly on a sell off tomorrow makes things look quite different in the weekly ?
Maybe. I think Lara mentioned she would prefer to see a full bar close below it to consider it over.
A weekly candle not touching the teal line is tequired to establish a full breach.
Exactly Rodney, thanks.
That’s my definition of a breach. Otherwise it’s just an overshoot.