Downwards movement today indicated the alternate wave counts may be correct. Price has closed above the support line.
Summary: A strong bullish Hammer candlestick reversal pattern today indicates a low may now be in place. The target for primary wave 5 to end is now 3,070. This may be met next year. March is the first expectation.
If price keeps rising through this first target, then a new target would be calculated and the expectation for the bull market to end may then be in October 2019.
New updates to this analysis are in bold.
The biggest picture, Grand Super Cycle analysis, is here.
Last published monthly chart is here, video is here.
MAIN ELLIOTT WAVE COUNT
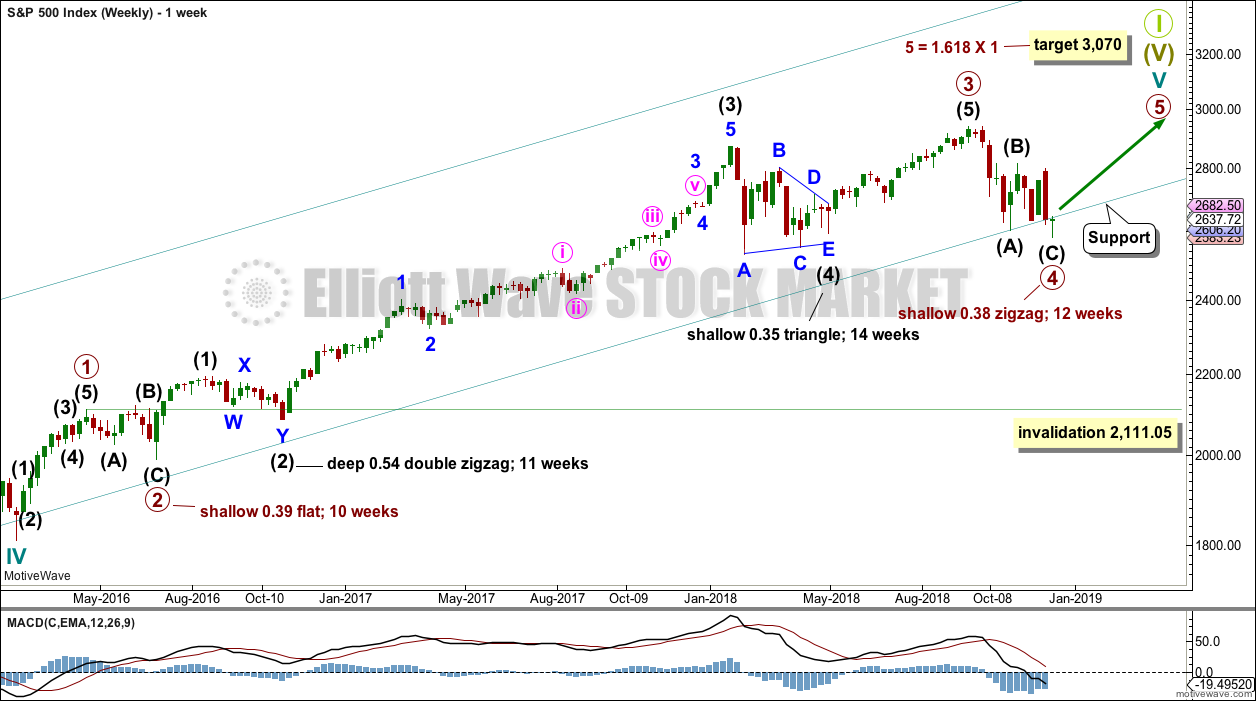
WEEKLY CHART
Cycle wave V must complete as a five structure, which should look clear at the weekly chart level and also at the monthly chart level. It may only be an impulse or ending diagonal. It is clear it is an impulse.
Within primary wave 3, there is perfect alternation and excellent proportion between intermediate waves (2) and (4).
Draw the teal channel from the high of cycle wave I at 1,343.80 on the week beginning 3rd July 2011, to the high of cycle wave III at 2,079.46 on the week beginning 30th November 2014, and place a parallel copy on the low of cycle wave II at 1,074.77 on the week beginning 2nd October 2011. Draw this chart on a semi-log scale. A small overshoot, like that seen at the end of cycle wave IV, would be entirely acceptable. If price does move below the channel, then it should reverse reasonably quickly.
Primary wave 4 may be over at today’s low as a complete zigzag. The teal trend channel is overshot, which is acceptable; this has happened before at the end of cycle wave IV.
This wave count has the right look at the monthly chart level.
If primary wave 5 ends at or after the end of December 2018 and the AD line fails to make new all time highs, there would then be the minimum required four months of bearish divergence between price and the AD line. If this happens, then the conditions for the end of this bull market would be in place.
Primary wave 4 may not move into primary wave 1 price territory below 2,111.05.
Two daily charts below are published in order of probability.
DAILY CHART
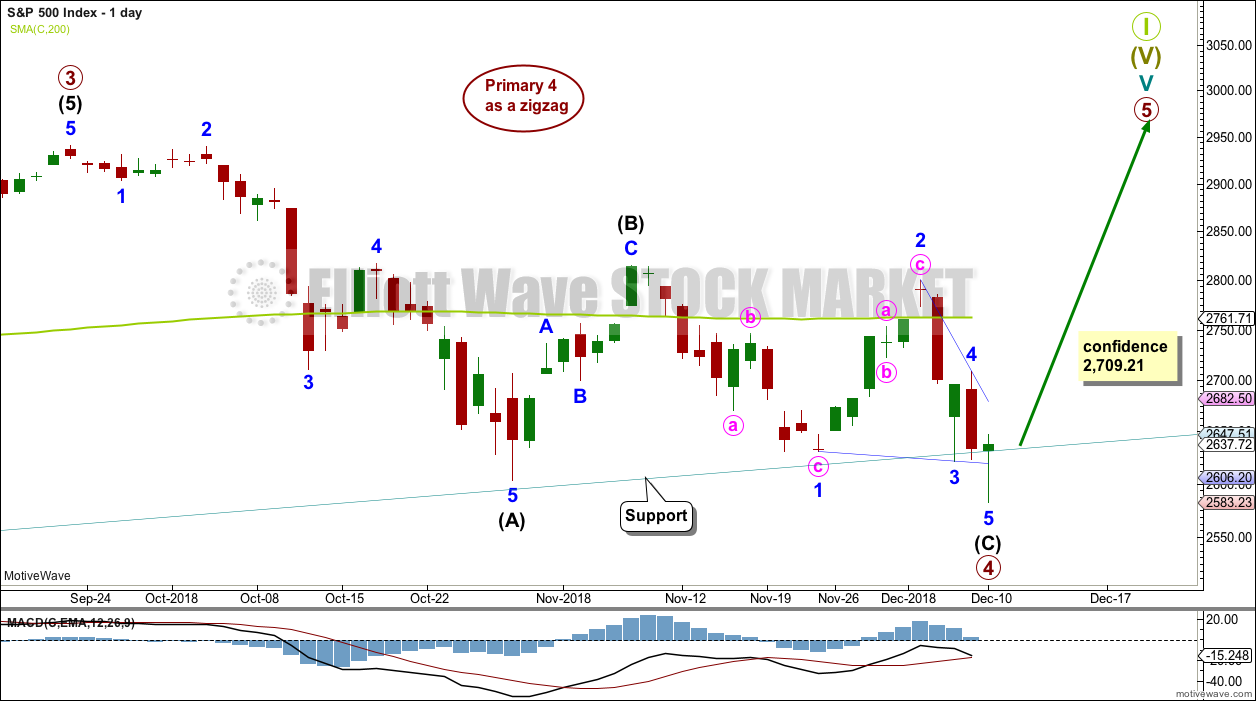
Primary wave 4 may be a complete single zigzag.
Within the zigzag, intermediate wave (C) may be an almost complete ending contracting diagonal.
Within the ending diagonal, all sub-waves must subdivide as zigzags, minor wave 4 must overlap minor wave 1 price territory, and minor wave 4 may not move beyond the end of minor wave 2 above 2,800.18.
Minor wave 5 may end with a small overshoot of the 1-3 trend line.
It is possible that minor wave 4 may move sideways as the arrow suggests. This would give the diagonal trend lines a more normal look. It is also possible that minor wave 4 could be over at Friday’s high and minor wave 5 may continue lower on Monday.
This wave count would expect only a small overshoot of the teal trend channel.
HOURLY CHART
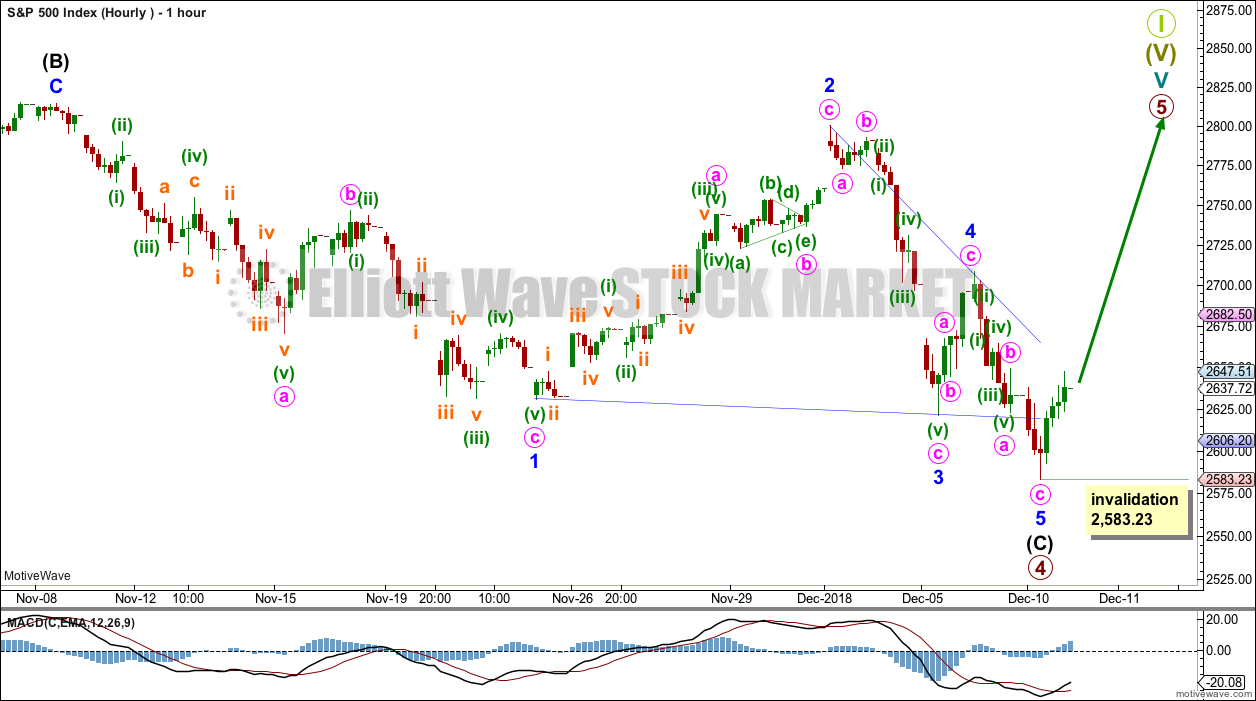
Within the zigzag for primary wave 4, intermediate wave (C) must subdivide as a five wave structure. This main wave count expects it may now be a complete ending contracting diagonal.
Within an ending diagonal, all sub-waves must subdivide as zigzags. Minor wave 4 must overlap minor wave 1, and it may not move beyond the end of minor wave 2. Minor wave 5 has overshot the 1-3 trend line, which is normal for a contracting diagonal.
Within the new trend of primary wave 5, no second wave correction may move beyond the start of its first wave below 2,583.23.
ALTERNATE DAILY CHART
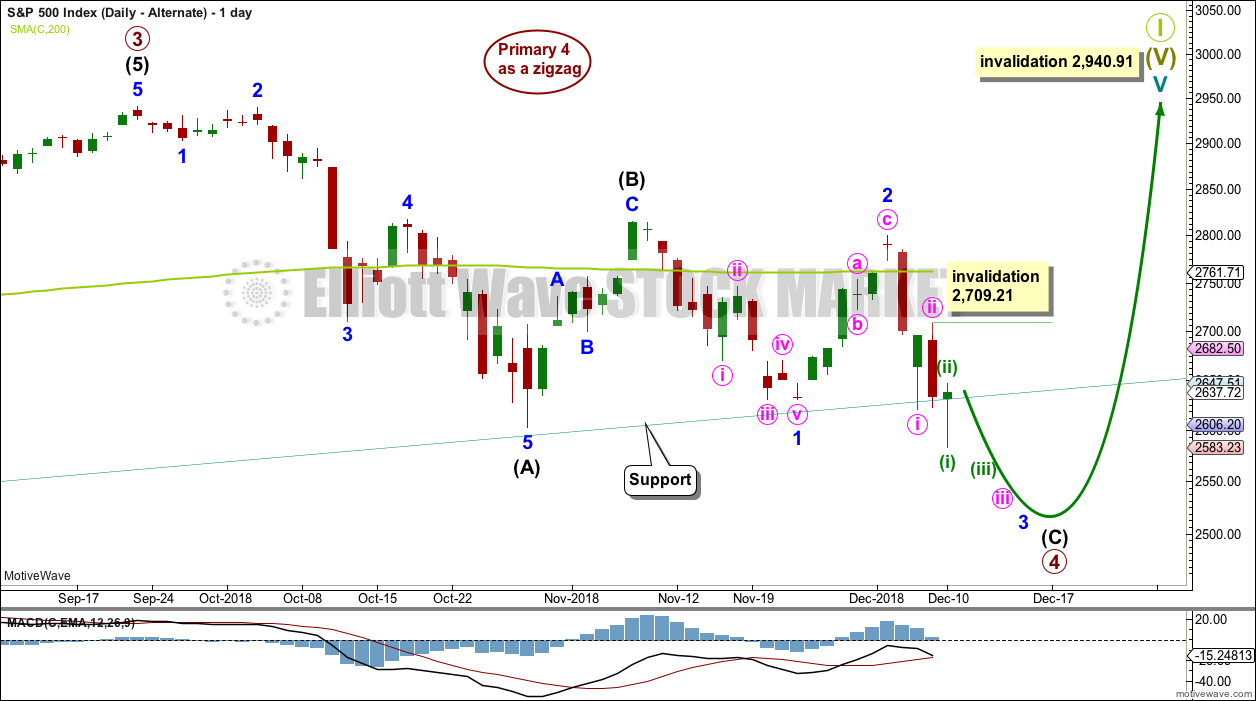
The other possible structure for intermediate wave (C) would be a simple impulse. If intermediate wave (C) is unfolding as an impulse, then it may now have three first and second waves complete. This wave count would expect to see an increase in downwards momentum as the middle of a third wave unfolds.
Within minute wave iii, minuette wave (ii) may not move beyond the start of minuette wave (i) above 2,709.21.
This wave count would expect to see breach of the teal trend channel on the weekly chart. This has not happened during the life of this trend channel.
The S&P commonly forms slow curving rounded tops. When it does this, it can breach channels only to continue on to make new all time highs. It is possible that Super Cycle wave I may end in this way.
TECHNICAL ANALYSIS
WEEKLY CHART
Click chart to enlarge. Chart courtesy of et=”_blank”>StockCharts.com.
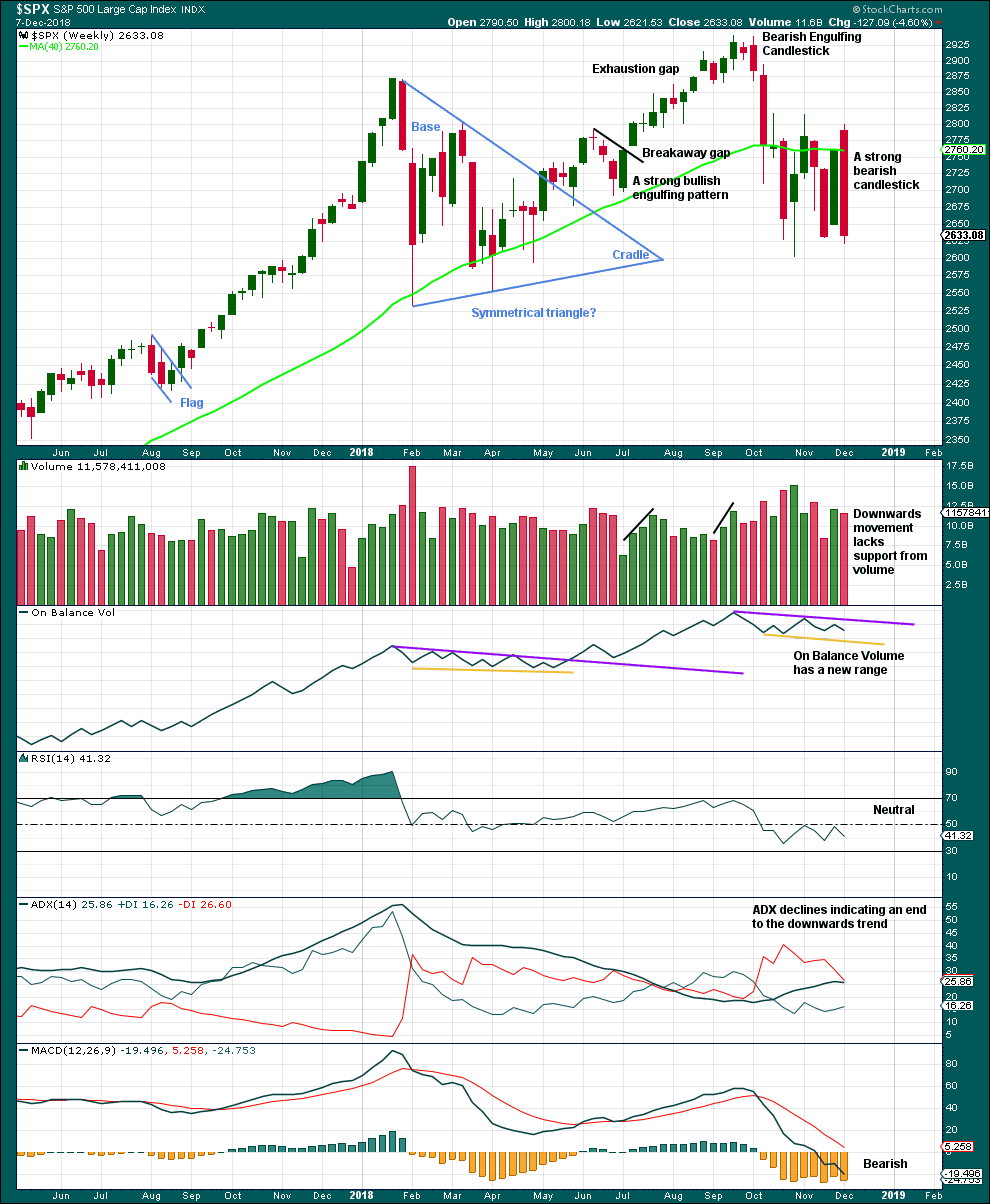
Last weekly candlestick is a strong bearish candlestick, but does not meet all the criteria for a Bearish Engulfing pattern. From Nison, “Japanese Candlestick Charting Techniques” page 43:
“There are three criteria for an engulfing pattern:
1. The market has to be in a clearly definable uptrend (for a bearish engulfing pattern)…
2. Two candles comprise the engulfing pattern. The second real body must engulf the prior real body (it need not engulf the shadows).
3. The second real body of the engulfing pattern should be the opposite colour of the first real body.”
This market is not currently in a clearly definable upwards trend, so the first criteria is not met.
A decline in volume last week may be due to the week being a short trading week, and so it would be best to look inside the week to determine the short-term volume profile.
However, the strongest volume for recent weeks is for the upwards week beginning 29th of October. This short-term volume profile at this time frame is bullish.
For a more bearish outlook a bearish signal from On Balance Volume would be preferred.
DAILY CHART
Click chart to enlarge. Chart courtesy of StockCharts.com.
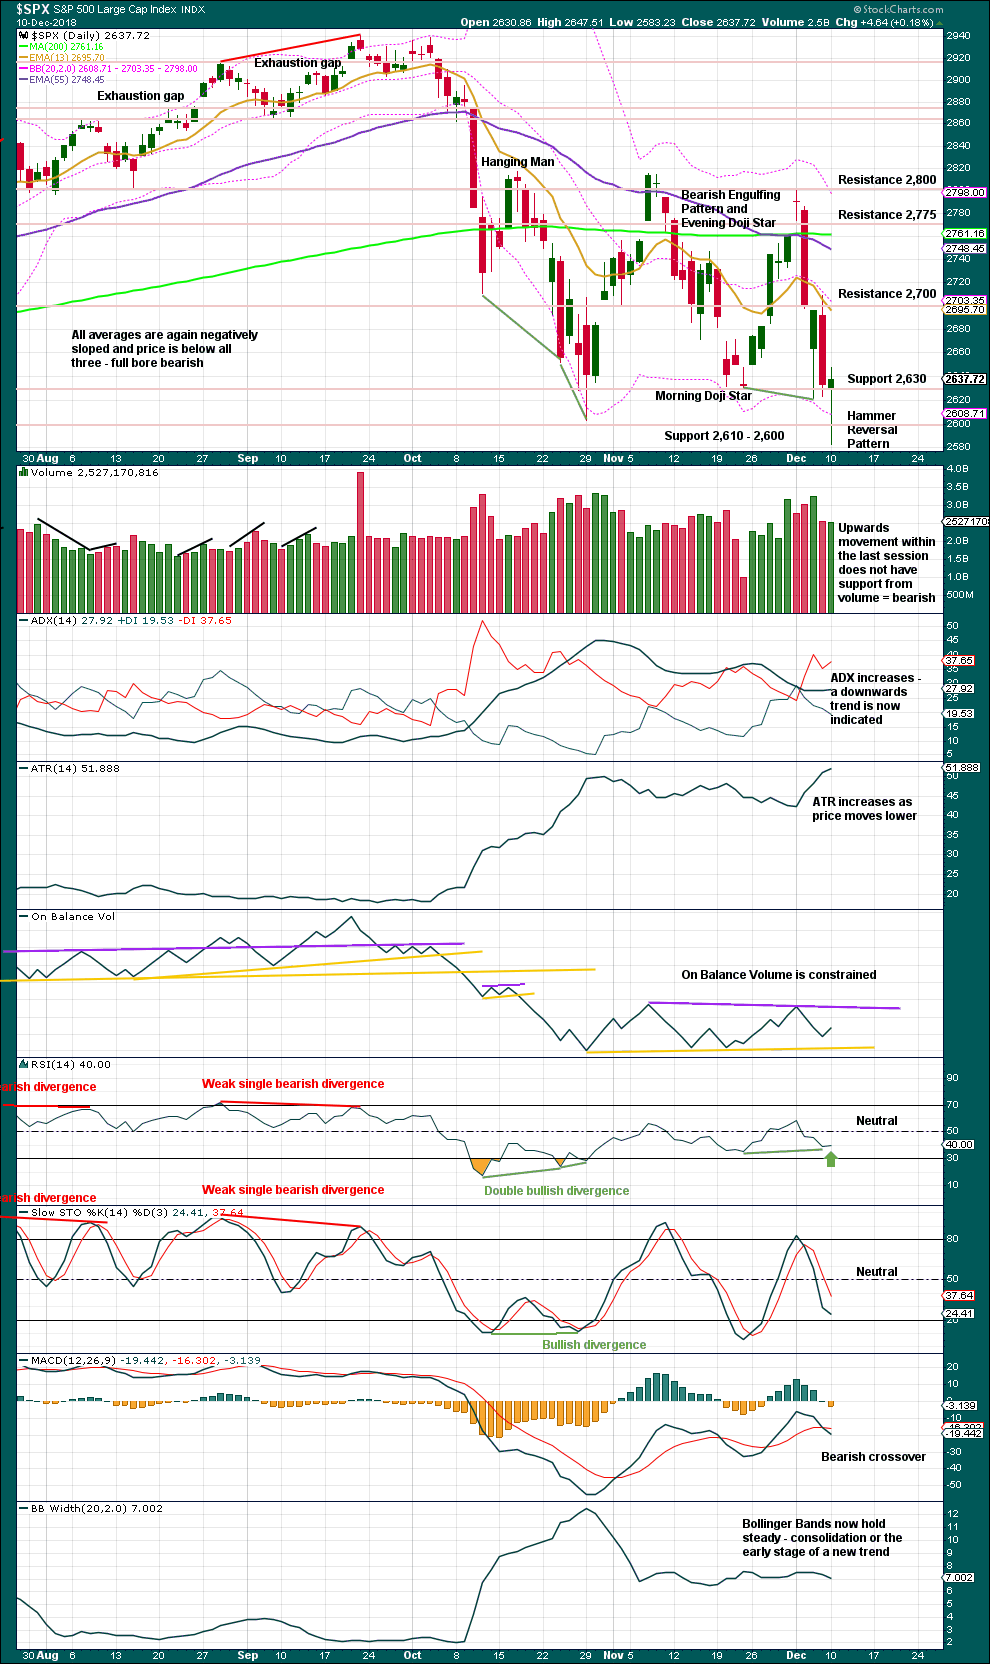
The lower edge of the teal trend channel is not shown on this chart, but it should be considered as part of this technical analysis. Expect that trend line to continue to provide support, until it does not.
Currently, this market is consolidating with resistance about 2,815 and support about 2,605 to 2,620. It is the upwards day of the 30th of October that has strongest volume during this consolidation, suggesting an upwards breakout may be more likely than downwards. This technique does not always work, but it does work more often than it fails.
Today price overshot the lower edge of the consolidation zone and price has closed back within the zone.
There is still short-term bullish divergence between price and RSI. There is also single day bullish divergence today. Today price has moved lower, but RSI has moved higher. RSI does not support downwards movement in price today. In conjunction with a very bullish Hammer reversal pattern, today it looks more likely now that a low may be in place.
BREADTH – AD LINE
WEEKLY CHART
Click chart to enlarge. Chart courtesy of StockCharts.com. So that colour blind members are included, bearish signals
will be noted with blue and bullish signals with yellow.
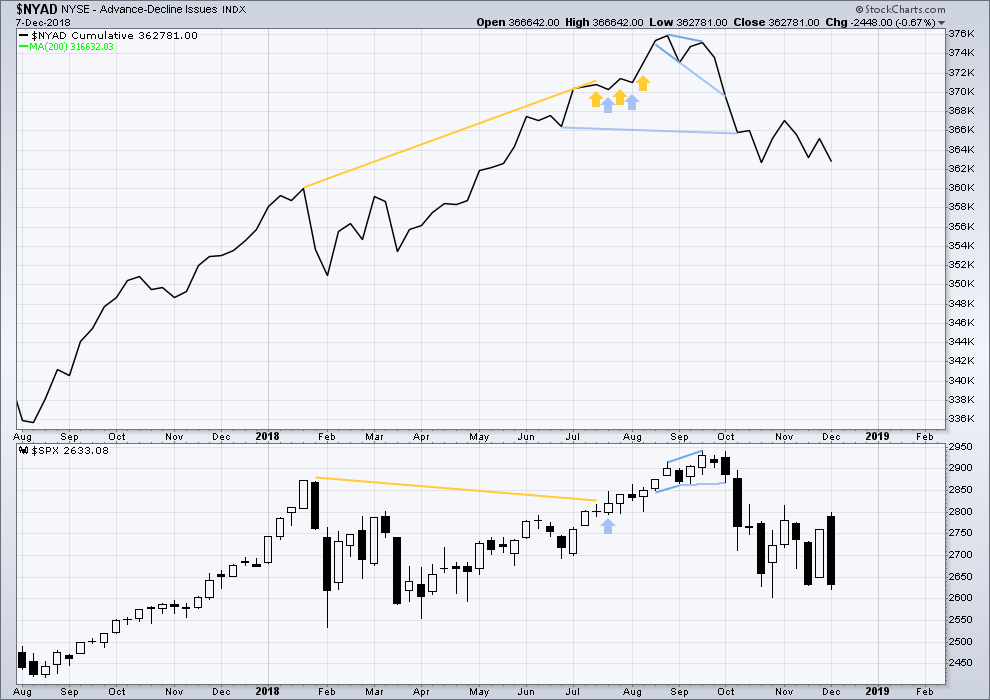
Both price and the AD line have moved lower last week. There is no divergence, and the AD line is not falling any faster than price here.
DAILY CHART
Click chart to enlarge. Chart courtesy of StockCharts.com. So that colour blind members are included, bearish signals
will be noted with blue and bullish signals with yellow.
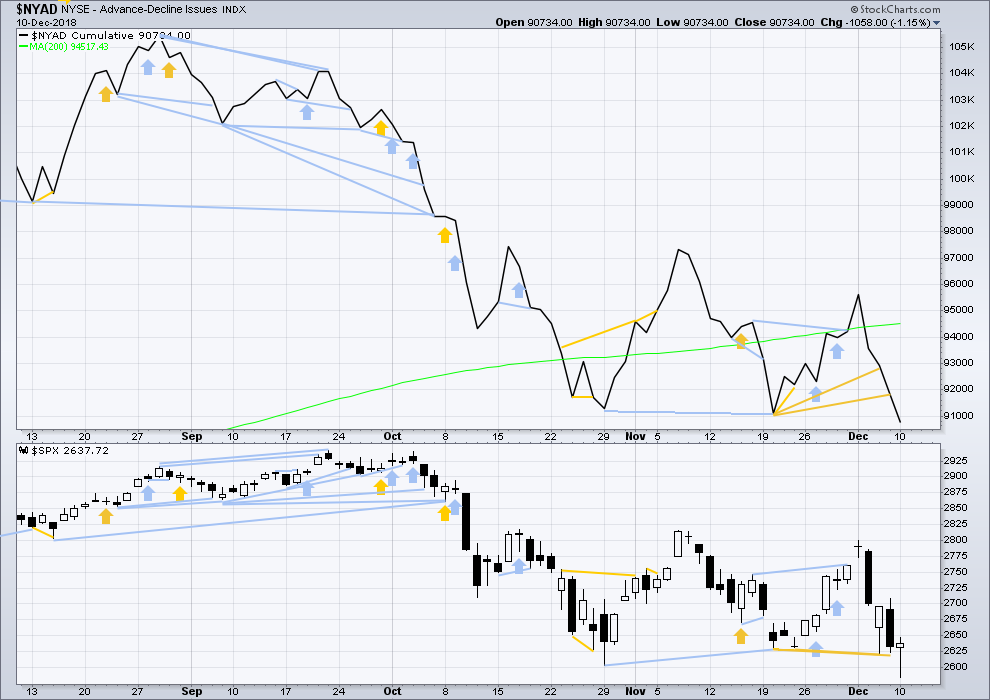
There is normally 4-6 months divergence between price and market breadth prior to a full fledged bear market. This has been so for all major bear markets within the last 90 odd years. With no longer-term divergence yet at this point, any decline in price should be expected to be a pullback within an ongoing bull market and not necessarily the start of a bear market. New all time highs from the AD line on the 29th of August means that the beginning of any bear market may be at the end of December 2018, but it may of course be a lot longer than that.
Breadth should be read as a leading indicator.
Both price and the AD line have moved lower today. There is no divergence.
VOLATILITY – INVERTED VIX CHART
WEEKLY CHART
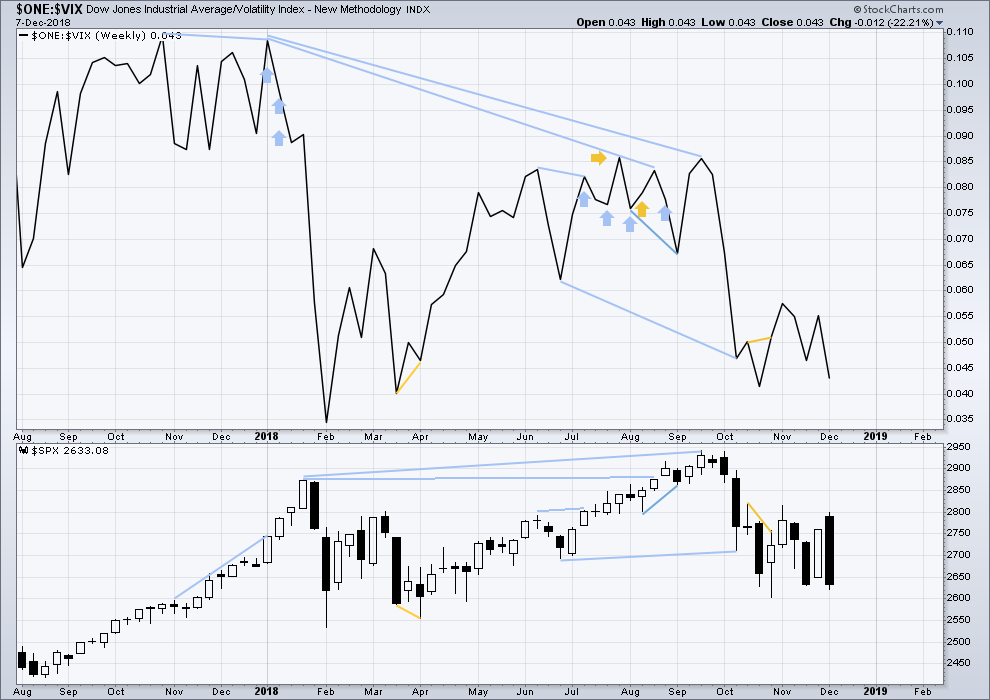
Click chart to enlarge. Chart courtesy of StockCharts.com. So that colour blind members are included, bearish signals
will be noted with blue and bullish signals with yellow.
Both price and inverted VIX have moved lower last week. The fall in price comes with a normal corresponding increase in volatility, but VIX is not increasing any faster than price. There is no divergence and no bearish signal.
DAILY CHART
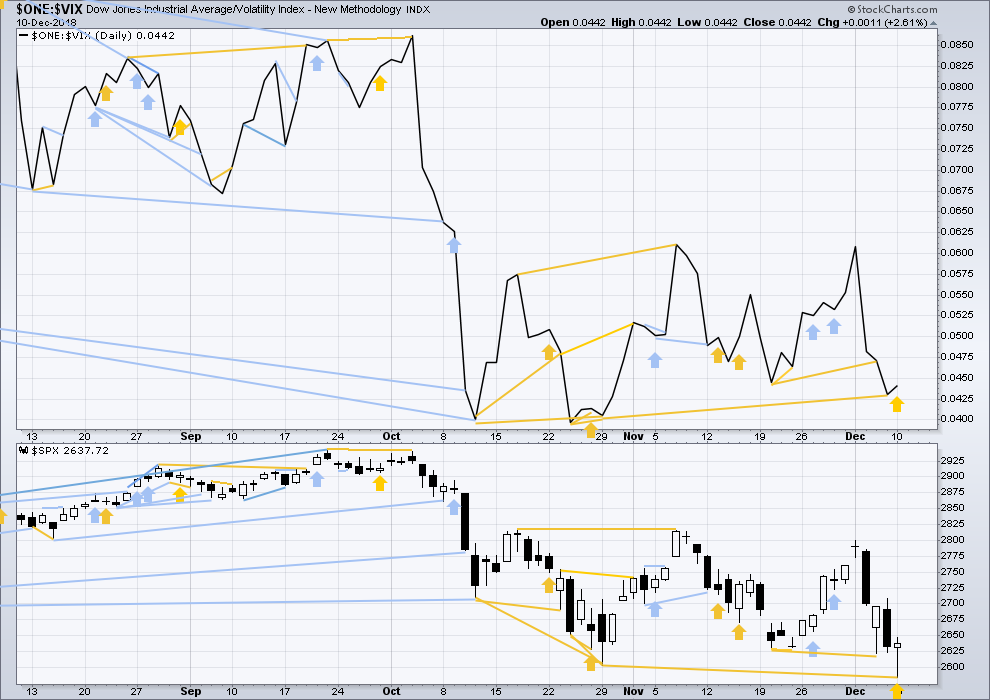
Click chart to enlarge. Chart courtesy of StockCharts.com. So that colour blind members are included, bearish signals
will be noted with blue and bullish signals with yellow.
Normally, volatility should decline as price moves higher and increase as price moves lower. This means that normally inverted VIX should move in the same direction as price.
Like the AD line, inverted VIX may now begin to accumulate instances of bearish signals or divergence as a fifth wave at three large degrees comes to an end.
Price has moved lower to make a new swing low below the prior swing low of the 29th of October, but inverted VIX has not made a corresponding new low. Downwards movement in price does not come with a normal corresponding increase in VIX. This divergence is bullish.
Today price has moved lower, but inverted VIX has moved higher. Downwards movement during this session has not come with a normal corresponding increase in VIX. Today VIX has declined. This divergence is bullish.
DOW THEORY
The following lows need to be exceeded for Dow Theory to confirm the end of the bull market and a change to a bear market:
DJIA: 23,344.52.
DJT: 9,806.79 – although a new low below this point has been made, price has not closed below this point.
S&P500: 2,532.69.
Nasdaq: 6,630.67.
Published @ 10:24 p.m. EST.
—
Careful risk management protects your trading account(s).
Follow my two Golden Rules:
1. Always trade with stops.
2. Risk only 1-5% of equity on any one trade.

I was wrong about my Dow 17k call.
It looks like the bear market is finally over.
Merry Christmas everyone!
Merry Christmas to you too ian2. I am interested in what has changed your mind on the DOW call. As I see it we are not out of the woods just yet. I want the 2709 confidence point to be achieved followed by a break out above the 2815 resistance level before I have full confidence it will go to 3000. If those two areas don’t fall, we could possibly see another big leg down notwithstanding the AD Line breadth that Lara gets from Lawrys. So, if you don’t mind, I’d like to hear what changed your mind. Thanks in advance.
I’m just trolling.
I see circuit breakers going off in the near future. Hopefully, level 3.
Risk/Reward from 2800 to 3000 not very large.
You are correct. However, I am long now in my long term account (daily & weekly positions) giving a better rick/reward ratio. I will use my short term account for trading on the way up. Today’s Minor 2 completion would have been a good entry with limited risk to the downside. Unfortunately, I was on the road making some Christmas visits today and missed it. My daily unreliable availability to trade is what keeps me out of the short term trading.
Minor 2 at today’s low looks like an impulse, it will have a better look if we move down further tomorrow and take out today’s lows: would give it an ABC, 3 wave structure. So you might not have missed it Rodney…
Does anyone recall 2 back to back BIG green hammers with very long lower wicks reverse so sharply the very next trading day?
Each of the last 4 days have something like an 80 point move in SPX.
I don’t think anything is normal, currently.
In a structure of the size/energy of a P4…nothing unusual IMO. And a FINAL P4 before a GSC…well, that’s new in our world!! Ain’t never happened before. I would expect even more volatility than I would otherwise, and we that’s pretty much what we got.
Which is why I never really bought into the P4 being over after that first massive move down. “Gonna ring like a bell for awhile!” was my thought. And it did. Booooiiiiinnnngggg!!!! I love it. I’ve made good money through this thing. After I took some lumps off the highs, my bad, trade and learn and improve! Always.
This is how I’m going to be counting the hourly chart today.
There’s a 5 min chart below in response to a members concern if anyone wants to see how minor waves 1 and 2 may subdivide.
Minor 2 is continuing lower since this chart was posted.
The 0.618 Fibonacci ratio is at 2,618. Look for support there.
Pretty irritating when one stirs the pot.
Key retrace levels.
I’ve been pondering the structure of the move up from yesterday’s low. Is that a proper impulse? Sump’n about it ain’t quite convincing to me. And now the gap is closed.
Sitting on hands at the moment.
Come on guys…!!!
Are you traders or not???
What is the TREND?????!!!!! 🙁
Taking a break….
Every time you say that, I’ve asked and will keep asking the same questions.
How do you MEASURE trend Verne? What’s your trend assessment at every time frame based on that quantitative measure? And based on that, how does that drive your decision making?
I have my answers, and I’ve given the details before. What are yours?
BTW, the hourly trend (as I measure it) is now neutral (after being strong down, then mild down). In other words…hourly trend is shifting.
And of course…the best trades are always as/when trend is ending at one time frame, and already shifted at a lower timeframe. The 5 minute was strong up yesterday/early today. Moved back to strong down…is currently at mild down. A little more up and it’s going to go neutral then back to up. That in turn is likely to drive the hourly trend back to up. Etc. Trend changing from lower TF’s up through higher. It takes time. Waiting for daily/weekly trend to change to “up” first…well, you can. Or you can anticipate when in line with a high probability wave count…can’t you? I can, and I do.
But you may be right. The daily/weekly trends are clearly down. And may continue. The monthly is neutral…and could move any direction from there.
not to mention…I don’t share my trade details here, too much effort not important not even really appropriate IMO. How do you know that I’m not short this move down? I trade multiple timeframes…
I guess my point is, overall, there’s no one right way to trade. In my opinion.
It’s higher, much higher.
305 SPY btw end of the year.
A steady set of higher highs/higher lows, and I count an even # (6) of pullbacks through it all (this all on the 5 minute). Looks right to me.
I’m leaning that way too, Kevin, despite the somewhat unusual look on the 5-minute chart. Looks better on a 30-minute chart.
I appreciate your thoughtful (non-insulting) reply.
Ah, Verne doesn’t mean it that way. He’s just passionate.
Agreed.
Verne always means well for the members of this service. We appreciate all his input as we do from all members.
I agree 🙂
Keep posting Verne!
And everyone else… this forum would not be the same without everyone’s input
I second that. As a stock trader Verne has earned my respect throughout the years. His information is always appreciated.
This may be a solution for you Curtis.
Thank you, Lara! I’ll take that as a puzzle solved.
For day traders the 5 min charts are relevant. But they can be confusing and exasperating. For me, the hourly charts are the best and I trade on a higher time frame. Lara tends to rely on hourly as the lowest time frame as well. She used to provide a lot of 5 minute work but that proved ineffective. It is all up to the individual needs.
LOL I just provided a 5 min chart for Curtis… then I read your comment.
Agreed. IMO it’s a bit too much noise the lower time frames.
I utilize the 5 minute and 1 minute. In general, I use the 1/5 to “time” my entries into the hourly action. Sometimes…I use the 1 to “time” my entry into the 5 minute action. But I increasingly believe that such trades are far, far less +EV than trading the higher timeframe wave counts.
Buckle up…!!!
It’s a long, long way to Tipperary :-))
Longed the gap close… Think I need a beer.
“…Cuz the future’s uncertain and the end is always near?”
still morning at my location on the planet. “Woke up this mornin’ and I got my self a BEEEER!!!” Lol!! Well, coffee actually. Further intoxicants wait for a bit later in the day…
“…Cuz the future’s uncertain and the end is always near?”
You got it!
So….. yesterday I bought 10 DEC 18 272.5 SPY (only $100) ….. has anyone ever exercised this kinda theoretical situation?
would need a gap and go here
Oil (/CL) has stopped, turned and paused right at/above a key 78.6% retrace level on the monthly chart (shown). On the daily, it’s broken it’s sharp down trend line from early October. And it’s polarity inverted on the daily. That all said, I’m still cautious…but it is at a high leverage point re: reward vs. risk (if you were to use the 78.6% level as a stop).
nice chart, I am building a position in GUSH
You like living on the sharp edge! I kind of dislike hugely leveraged ETF’s, they just seem to eat my lunch too often. I prefer options on less volatile instruments.
Kaplaugh!!
Lots of interesting set ups out there if you are a believer in the P4 being over.
CELG for example. yesterday was 2nd touch and turn off the 61.8% of the entire price move from the start of the bull market in 2009 to it’s high in Dec 2018. Seems like a solid bottom to trade off of to me (not advice, just an idea).
Or CPB (cambell’s soup), same period retrace to the 78.6% almost exactly and a turn.
Lots of set ups…
I am looking for the first 5 wave impulse up to complete and then go long at the srcond wave retracement. Then I’ll go long in short term account. I am already fully long at long term position account. Very slightly under water. May go green yet today.
Not a bad idea to hedge long positions…. 🙂
You guys ever see this movie?
https://www.youtube.com/watch?v=Y2DqFRsPrns
Yes, a couple of times – it’s a good one!
I’m going to rewatch it on Friday or Monday.
I assume you mean 5 wave impulse at the 5 minute TF, not the hourly, and it certainly looks like that is complete and the ii is in full swing. I want to be on the low/turn of this ii myself…and of course there’s still some risk re: the alternate, it has not been invalidated yet.
Don’t want to tempt fate, but looks like Lara’s main count may be evolving here.
Sweet!
That works well for me…
“Use the wave count Luke!!”
Yes sir ree, Bob.
We need a Luke and Bob on this blog!
That’s right! Because as we all know, Bob’s your Uncle!
You will have to elaborate on this one. I don’t get it.
Bob’s your Uncle is a long time phrase that means “you’ve got it” or “yup, everything is good!”. It’s origins are unclear. I think it’s a midwest thing. My wife uses it a lot.
You got me by seconds.
Wow! You guys let me squeeze in here.
Just barely !