A short-term pullback was expected to begin on Friday, but this did not eventuate. Overall, an upwards trend was expected to be in place and this continues. The target remains the same.
Summary: For the very short term, upwards movement looks most likely to continue at the start of next week. A short-term target for a small interruption to the trend for minor wave 2 is now at 2,780.
A target for the next wave up is 2,973. About this target a multi week consolidation may begin for intermediate wave (4).
The main wave count now expects this bull market to end at the end of December 2018 at the earliest, and possibly in March 2019, at 3,090.
The last gap may provide support at 2,682.53.
New updates to this analysis are in bold.
The biggest picture, Grand Super Cycle analysis, is here.
Last published monthly chart is here, video is here.
MAIN ELLIOTT WAVE COUNT
WEEKLY CHART
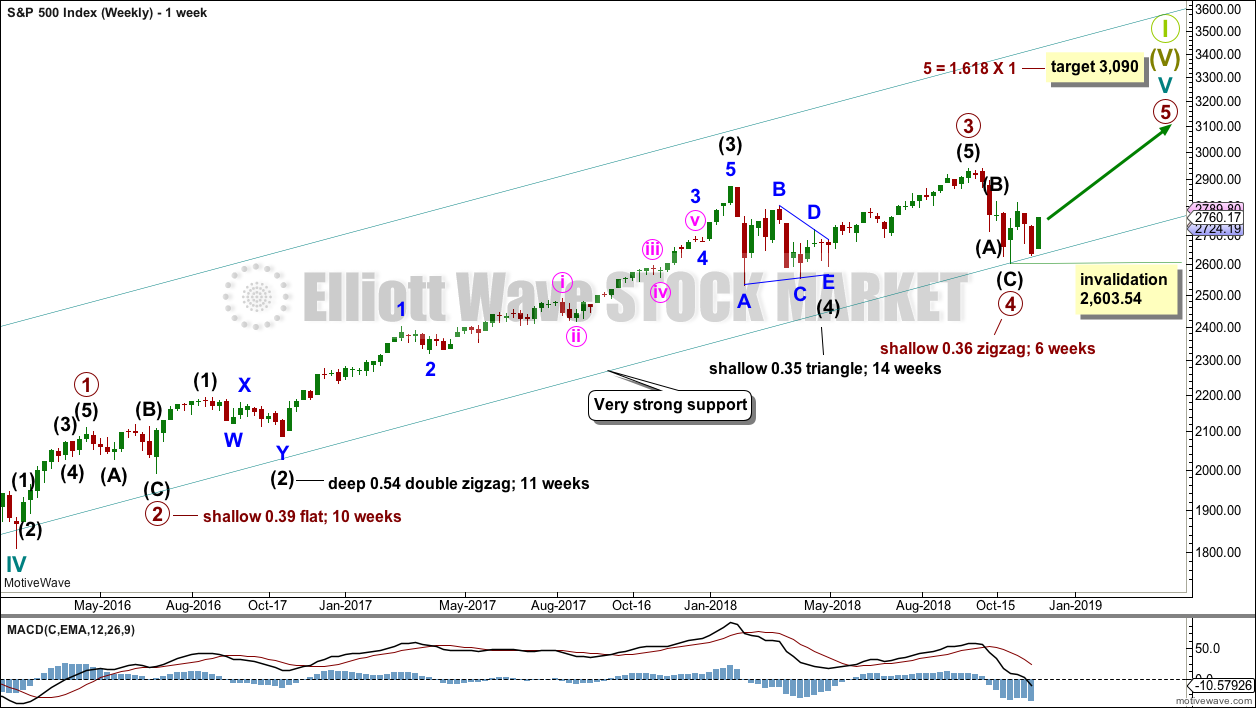
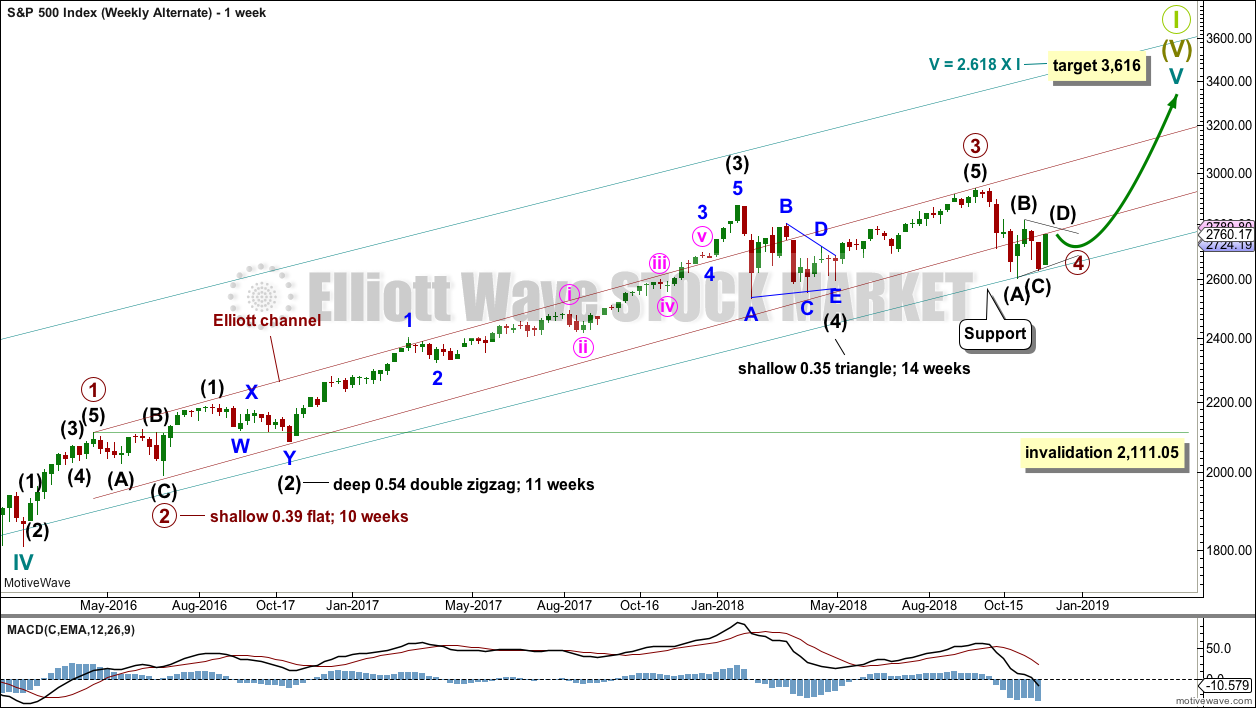
Cycle wave V must complete as a five structure, which should look clear at the weekly chart level and also at the monthly chart level. It may only be an impulse or ending diagonal. It is clear it is an impulse.
Within primary wave 3, there is perfect alternation and excellent proportion between intermediate waves (2) and (4).
Primary wave 4 may have found very strong support about the lower edge of the teal channel. This channel is copied over from the monthly chart and contains the entire bull market since its beginning in March 2009. While Super Cycle wave (V) is incomplete, this channel should not be breached at the weekly chart level.
Draw the teal channel from the high of cycle wave I at 1,343.80 on the week beginning 3rd July 2011, to the high of cycle wave III at 2,079.46 on the week beginning 30th November 2014, and place a parallel copy on the low of cycle wave II at 1,074.77 on the week beginning 2nd October 2011. Draw this chart on a semi-log scale. A small overshoot, like that seen at the end of cycle wave IV, would be entirely acceptable. If price does move below the channel, then it should reverse reasonably quickly.
The proportion between primary waves 2 and 4 is reasonable. Flat corrections tend to be longer lasting structures than zigzags. There would be perfect alternation in structure and inadequate alternation in depth. This is acceptable.
This wave count has the right look at the monthly chart level.
If primary wave 5 ends at or after the end of December 2018 and the AD line fails to make new all time highs, there would then be the minimum required four months of bearish divergence between price and the AD line. If this happens, then the conditions for the end of this bull market would be in place.
A target is calculated for primary wave 5 to end. If primary wave 5 were to be only equal in length with primary wave 1, then it would be truncated. A truncated primary wave 5 would be unlikely as then there could be no bearish divergence with the AD line. The next Fibonacci ratio in the sequence is used to calculate a target for primary wave 5.
Within primary wave 5, no second wave correction may move beyond the start of its first wave below 2,603.54.
DAILY CHART
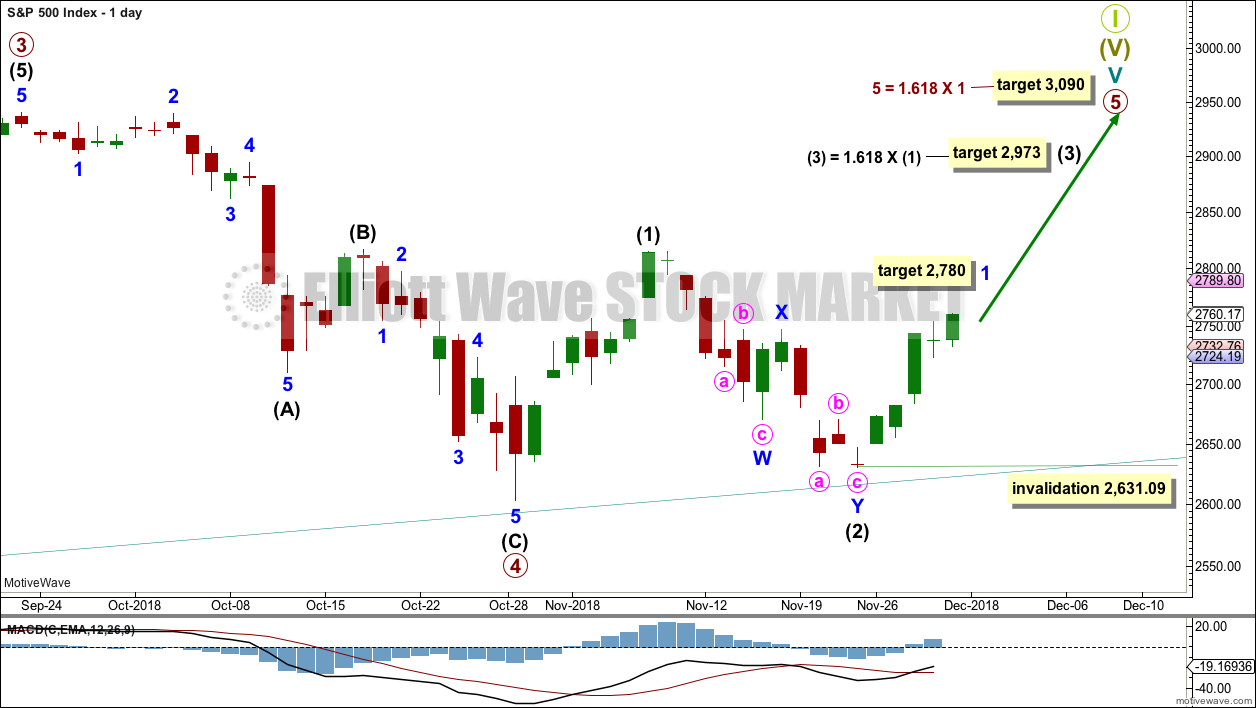
Within primary wave 5, intermediate waves (1) and (2) may be over. Within intermediate wave (3), minor wave 2 may not move beyond the start of minor wave 1 below 2,631.09.
Primary wave 5 may subdivide either as an impulse (more likely) or an ending diagonal (less likely). Intermediate wave (1) may be seen as either a five wave impulse or a three wave zigzag at lower time frames, and so at this stage primary wave 5 could be either an impulse or a diagonal.
For both an impulse and a diagonal, intermediate wave (3) must move above the end of intermediate wave (1).
Primary wave 5 at its end may be expected to exhibit reasonable weakness. At its end, it should exhibit a minimum of 4 months bearish divergence with the AD line, it may exhibit bearish divergence between price and RSI and Stochastics, and it may lack support from volume.
HOURLY CHART
Intermediate wave (3) may only subdivide as an impulse if primary wave 5 subdivides as an impulse.
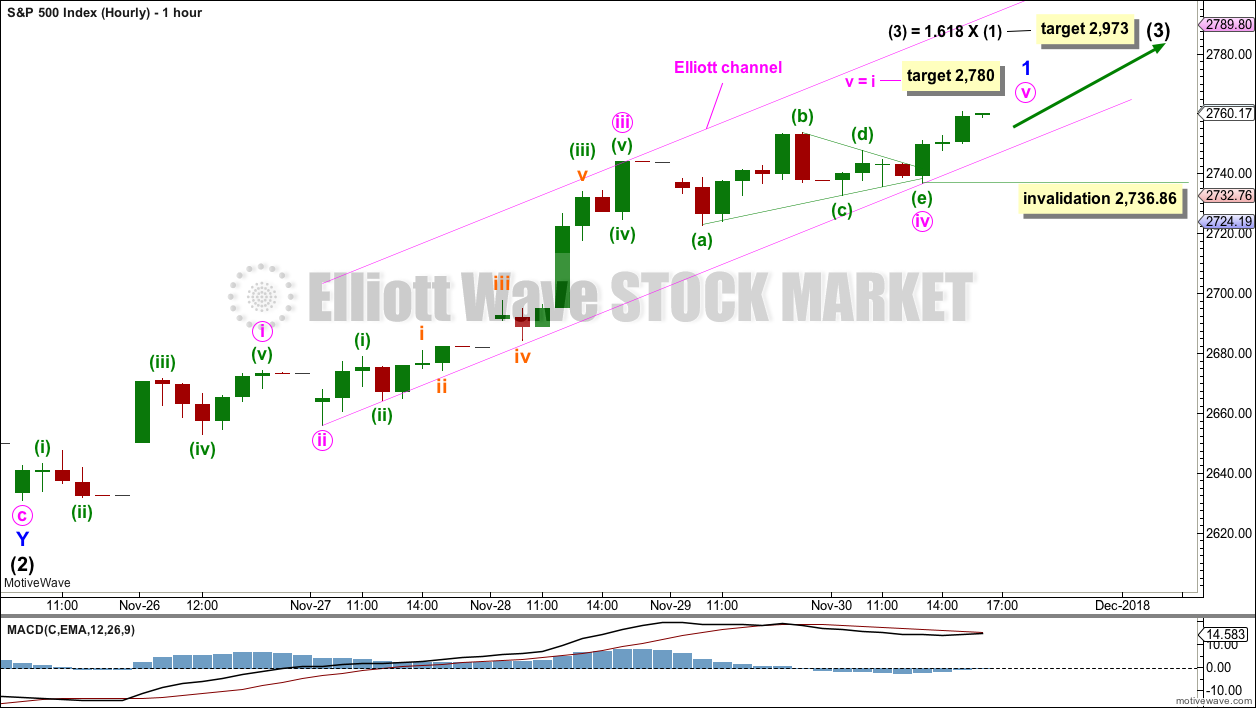
Within intermediate wave (3), minor wave 1 may again be incomplete.
Within minor wave 1, minute waves i through to iv may be complete. Minute wave ii may have been a zigzag. Minute wave iv may have been a more time consuming triangle, which provides perfect alternation.
There is no adequate Fibonacci ratio between minute waves i and iii. This makes it more likely that minute wave v may exhibit a Fibonacci ratio to either of minute waves i or iii. The most common Fibonacci ratio is used to calculate a target.
A channel is drawn about minor wave 1 using Elliott’s second technique. Price should now remain within this channel while minor wave 1 continues. If price breaks below the lower edge of the channel, whether or not the target is reached, then assume minor wave 1 is over and minor wave 2 has then begun.
Within minute wave v, no second wave correction may move beyond the start of its first wave below 2,736.86.
When minor wave 1 could be complete, then the invalidation point must move down to its start at 2,631.09. Minor wave 2 may last about three days and may end about the 0.382 or 0.618 Fibonacci ratio of minor wave 1. Minor wave 2 may not move beyond the start of minor wave 1 below 2,631.09.
ALTERNATE ELLIOTT WAVE COUNT
WEEKLY CHART
It is also still possible that primary wave 4 may be incomplete. However, at this stage, if primary wave 4 is incomplete and continues for a further several weeks, it would now be out of proportion to primary wave 2. Primary wave 2 lasted 10 weeks. If primary wave 4 is incomplete, then so far it has lasted 10 weeks.
If primary wave 4 is incomplete, then the most likely structures at this stage may be a zigzag, triangle or combination. A double zigzag and flat are discarded based upon the requirement for a large overshoot of the teal trend channel, and poor proportion.
Primary wave 4 may not move into primary wave 1 price territory below 2,111.05.
For this alternate wave count, when primary wave 4 may be complete, then the final target may be calculated at primary degree. At that stage, there may be two targets, or the target may widen to a small zone.
DAILY CHART – ZIGZAG
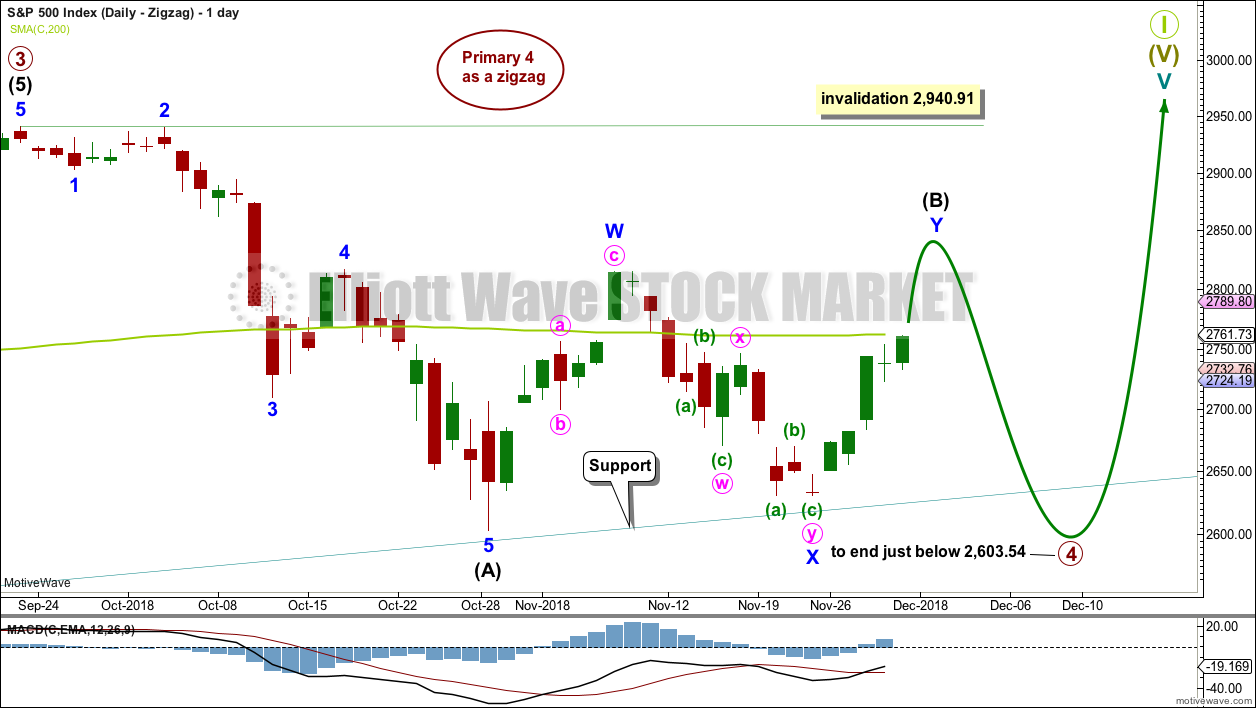
Primary wave 4 may be unfolding as a single zigzag, which is the most common type of corrective structure. This would provide perfect alternation with the flat correction of primary wave 2.
Within the zigzag, intermediate wave (B) may be continuing higher as a double zigzag. Intermediate wave (B) may not move beyond the start of intermediate wave (A) above 2,940.91.
The probability of this wave count is reduced. If intermediate wave (B) is incomplete and intermediate wave (C) has not begun, then this wave count now requires a few more weeks for the structure to complete. If it can do so in just three or four weeks, it may be acceptable.
The longer intermediate wave (B) lasts, the greater the overshoot of the teal trend line required for intermediate wave (C) to move below the end of intermediate wave (A) to avoid a truncation. The probability of this wave count is further reduced for this reason.
DAILY CHART – TRIANGLE
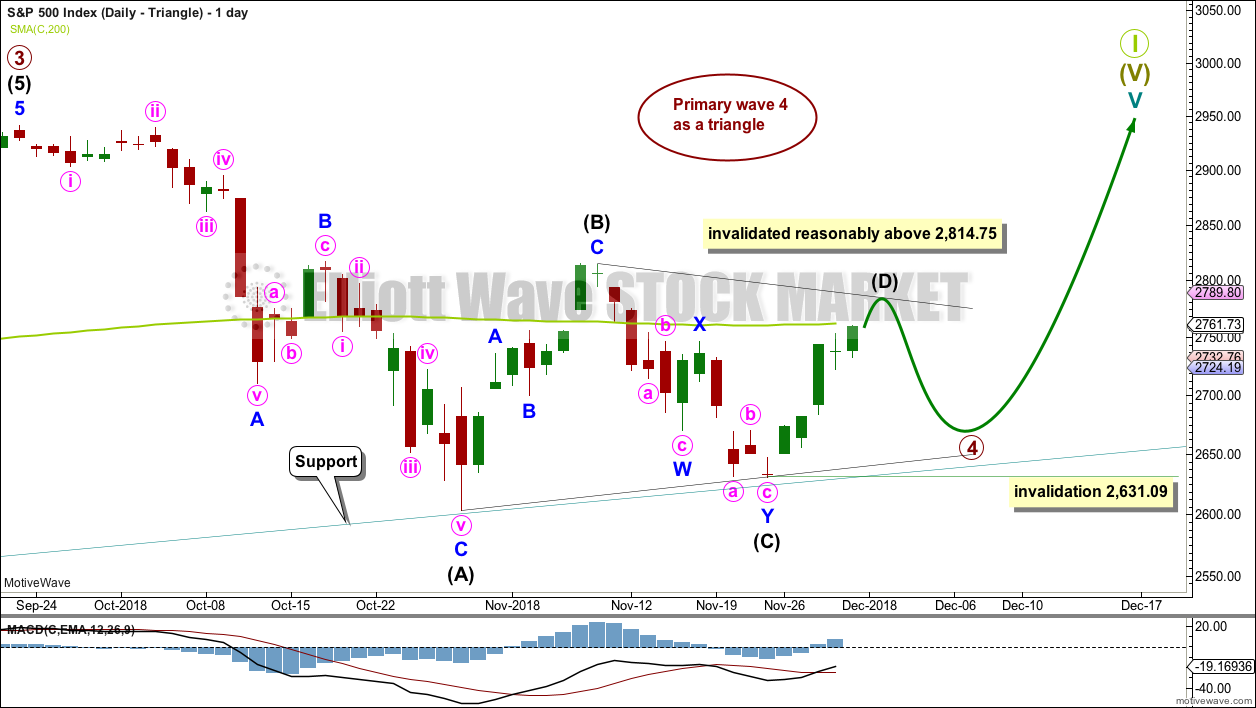
If primary wave 4 unfolds as a triangle, it would have perfect alternation with the regular flat correction of primary wave 2. It would also continue to find support about the lower edge of the teal trend channel. Triangles are fairly common structures for fourth waves.
The triangle is relabelled to see intermediate waves (A), (B) and (C) now all complete. Intermediate wave (B) is shorter than B waves of triangles usually are; this gives the triangle an odd look. However, considering the duration of primary wave 4 so far, this labelling now makes more sense.
Intermediate wave (C) may have completed as a double zigzag. This is the most common triangle sub-wave to subdivide as a multiple.
Price has bounced up off the lower edge of the teal trend channel.
If the triangle is a regular contracting triangle, which is the most common type, then intermediate wave (D) may not move beyond the end of intermediate wave (B) above 2,814.75.
If the triangle is a regular barrier triangle, then intermediate wave (D) may end about the same level as intermediate wave (B). As long as the (B)-(D) trend line remains essentially flat a triangle would remain valid. This invalidation point is not exact; intermediate wave (D) can end very slightly above 2,814.75.
The final wave down for intermediate wave (E) may not move beyond the end of intermediate wave (C) below 2,631.09.
This wave count could see a triangle complete in another four to five weeks, which would see primary wave 4 last a total of 14 or so weeks. This would be reasonably in proportion to the triangle for intermediate wave (4) one degree lower, and this would be acceptable.
This wave count would also see the lower edge of the teal trend channel continue to provide support. This would give the wave count the right look at the weekly and monthly chart levels.
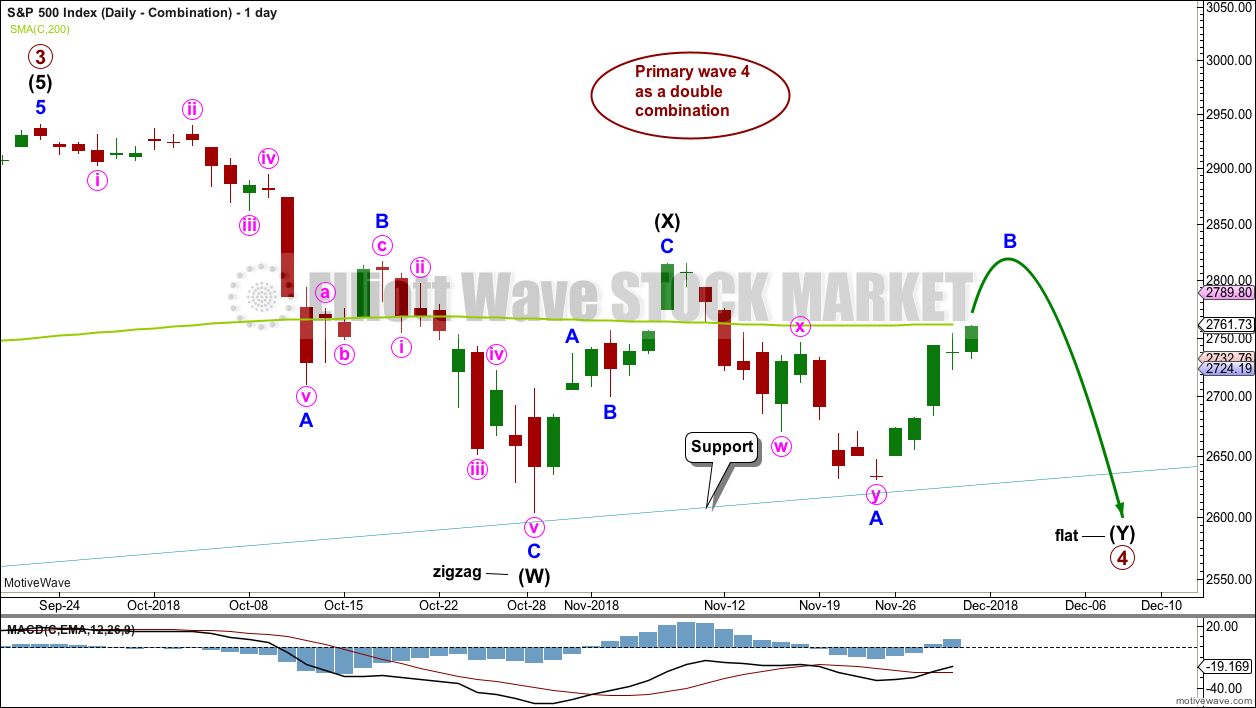
DAILY CHART – COMBINATION
This wave count is judged to have only a slightly lower probability than the triangle. If this wave count is correct, then primary wave 4 may be a few weeks longer in duration than primary wave 2. This wave count now has a problem of proportion.
Primary wave 4 may be unfolding as a double combination. The first structure in the double may be a complete zigzag labelled intermediate wave (W). The double may be joined by a three in the opposite direction labelled intermediate wave (X). Intermediate wave (X) may be complete as a single zigzag; it is deep at 0.63 the length of intermediate wave (W), which looks reasonable.
Intermediate wave (Y) would most likely be a flat correction, which should subdivide 3-3-5. At its end, it would now require a reasonable overshoot of the lower edge of the teal trend channel. This further reduces the probability of this wave count.
Within the flat correction of intermediate wave (Y), minor wave B must retrace a minimum 0.9 length of minor wave A at 2,796.74. The common range for minor wave B is from 1 to 1.38 times the length of minor wave A giving a range from 2,815.15 to 2,885.09. Minor wave B may make a new high above the start of minor wave A at 2,815.15 as in an expanded flat.
TECHNICAL ANALYSIS
WEEKLY CHART
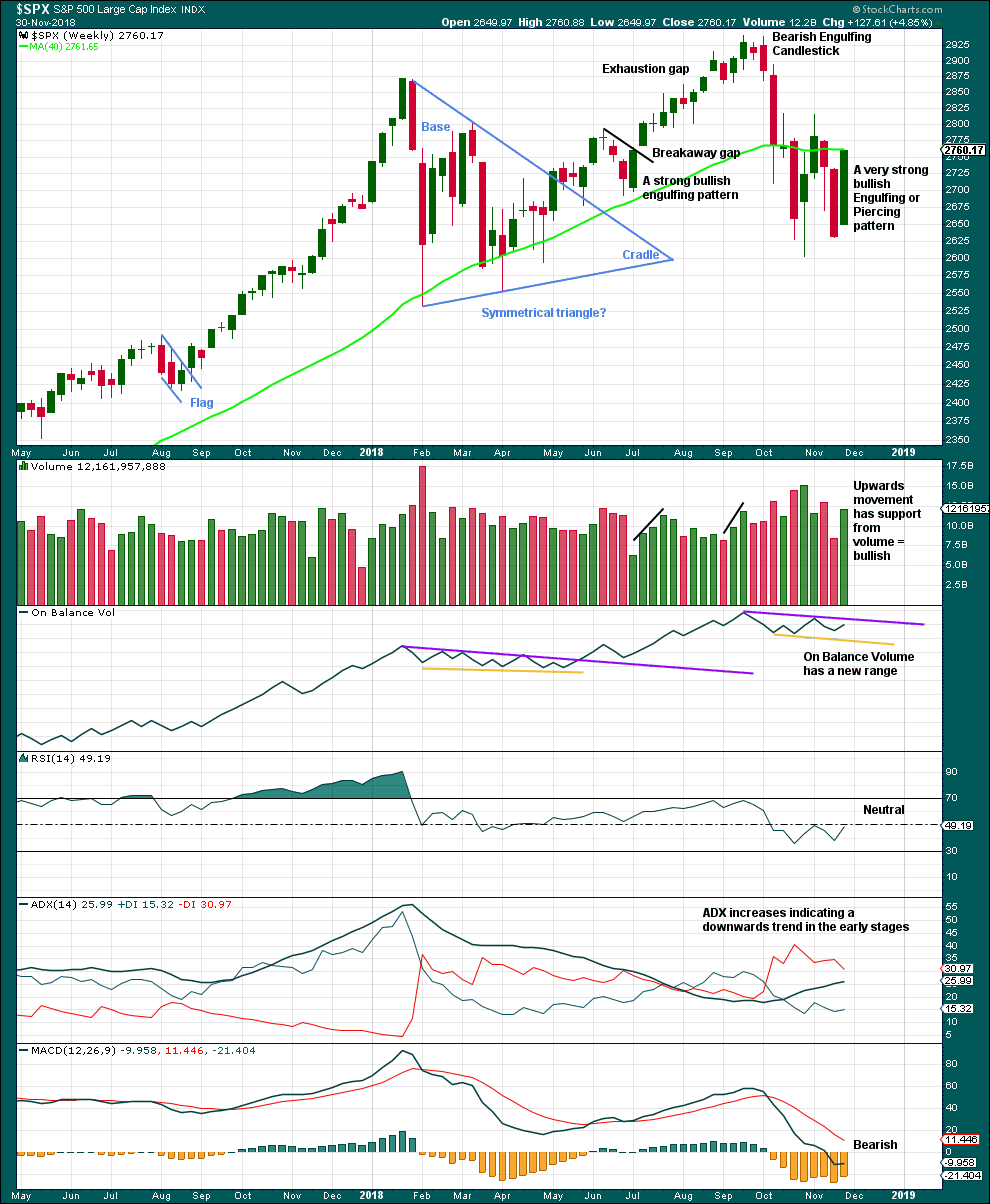
Click chart to enlarge. Chart courtesy of et=”_blank”>StockCharts.com.
A Bullish Engulfing candlestick pattern requires the second candlestick to open below the low of the first candlestick. This week’s candlestick opens above the low of last week’s candlestick. However, the most important aspect of an Engulfing pattern is the close of the second candlestick. Here, this week’s candlestick has closed well above the open of last week’s candlestick. This is very bullish.
This candlestick is neither correctly an engulfing nor piercing pattern, but the close is very bullish. It will be read as a bullish reversal pattern.
With support from volume, this weekly candlestick is very bullish. This supports the main Elliott wave count. This does not look like a B wave nor a D wave within a triangle.
DAILY CHART
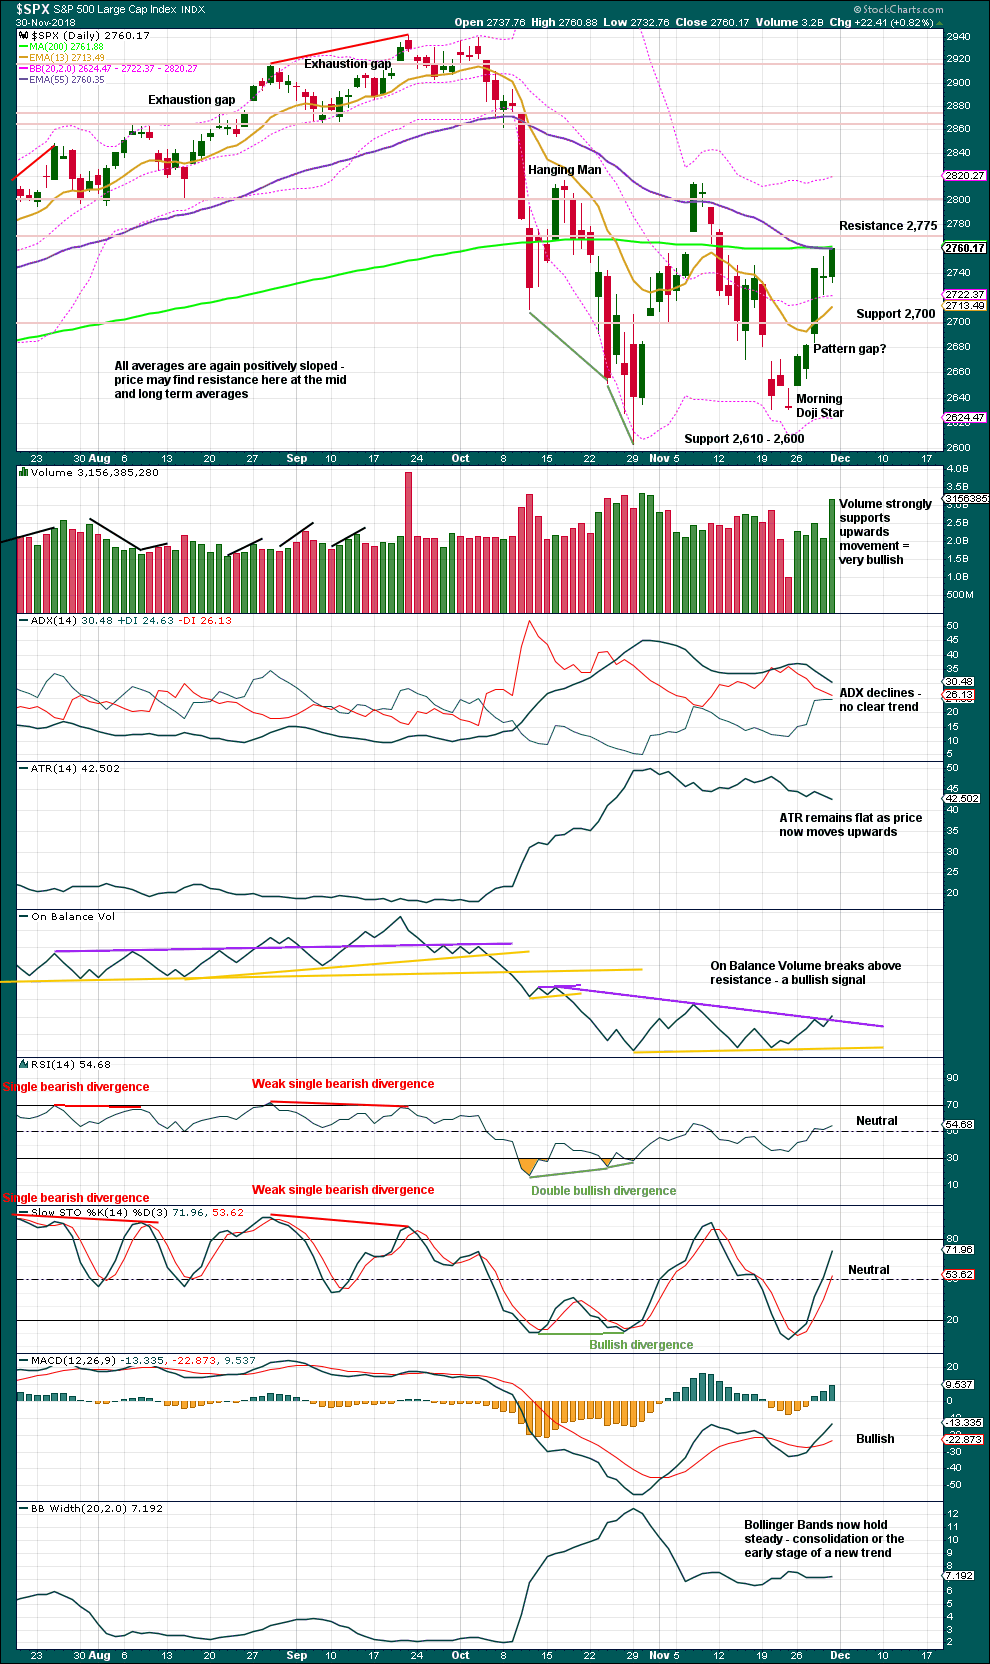
Click chart to enlarge. Chart courtesy of StockCharts.com.
The lower edge of the teal trend channel is not shown on this chart, but it should be considered as part of this technical analysis. Expect that trend line to continue to provide support, until it does not.
The strongest pieces of technical analysis on this chart are strong volume for Friday and a bullish signal from On Balance Volume. This offers reasonable support to the main Elliott wave count, and puts strong doubt on the alternate daily wave counts. This does not look at all like a B wave; B waves should exhibit clear weakness.
BREADTH – AD LINE
WEEKLY CHART
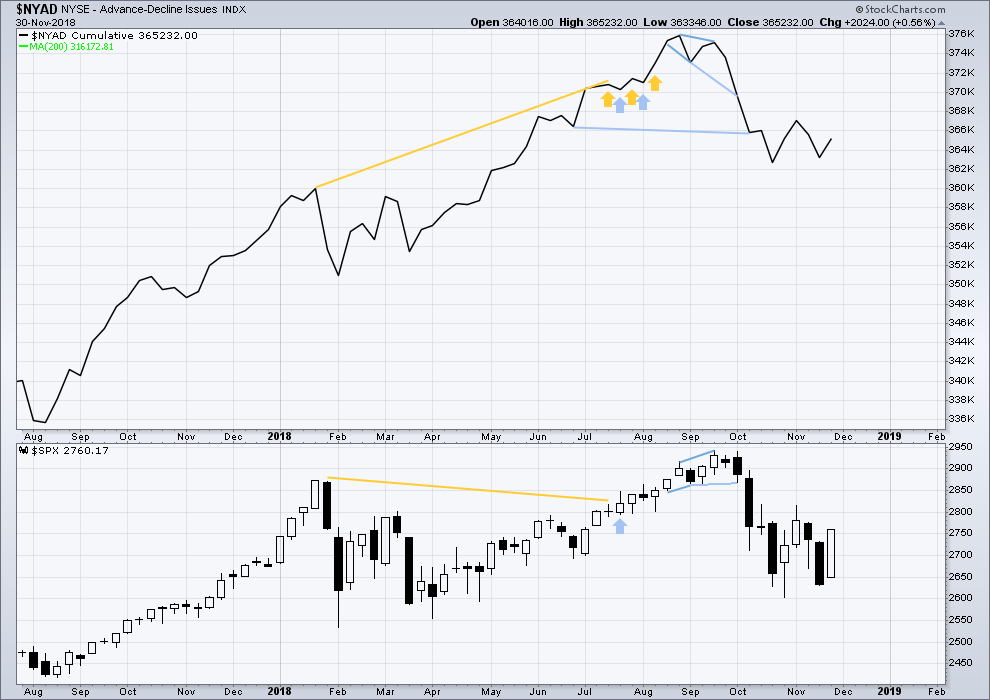
Click chart to enlarge. Chart courtesy of StockCharts.com. So that colour blind members are included, bearish signals
will be noted with blue and bullish signals with yellow.
Both price and the AD line have moved higher this week. Upwards movement has support from rising market breadth. There is no short-term divergence.
All of small, mid and large caps are moving higher. Upwards movement has broad market support.
DAILY CHART
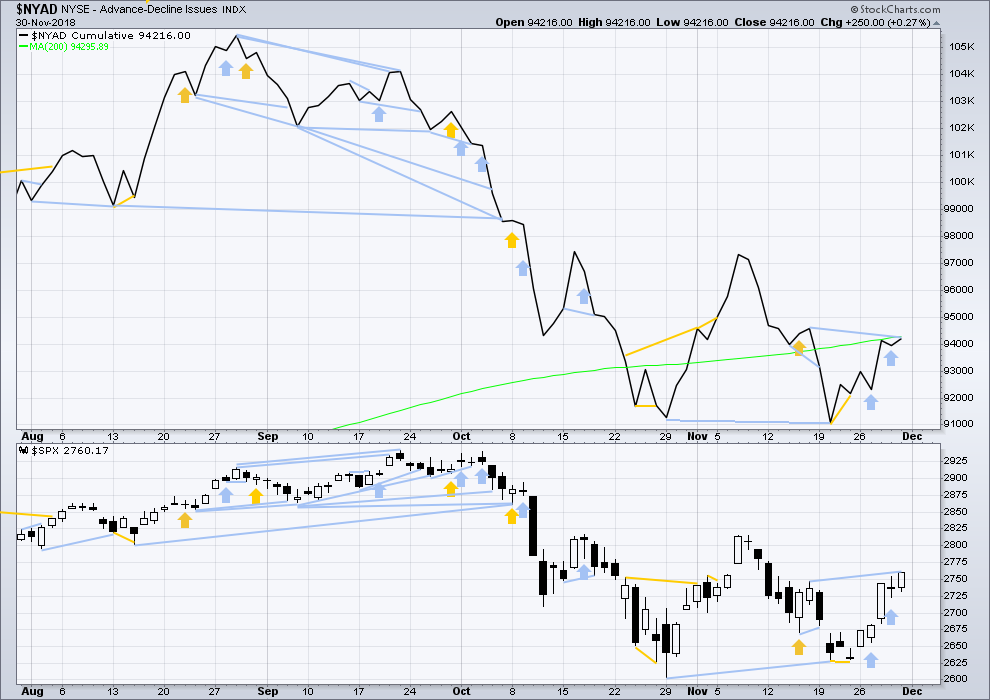
Click chart to enlarge. Chart courtesy of StockCharts.com. So that colour blind members are included, bearish signals
will be noted with blue and bullish signals with yellow.
There is normally 4-6 months divergence between price and market breadth prior to a full fledged bear market. This has been so for all major bear markets within the last 90 odd years. With no longer-term divergence yet at this point, any decline in price should be expected to be a pullback within an ongoing bull market and not necessarily the start of a bear market. New all time highs from the AD line on the 29th of August means that the beginning of any bear market may be at the end of December 2018, but it may of course be a lot longer than that.
Breadth should be read as a leading indicator.
Price has made a slight new high above the prior swing high of the 16th of November, but the AD line has not. This short-term divergence is bearish.
However, in context of a fifth wave at three large degrees unfolding some bearish signals may now be expected to begin to accumulate. This divergence is bearish, but will not be read as immediately so.
VOLATILITY – INVERTED VIX CHART
WEEKLY CHART
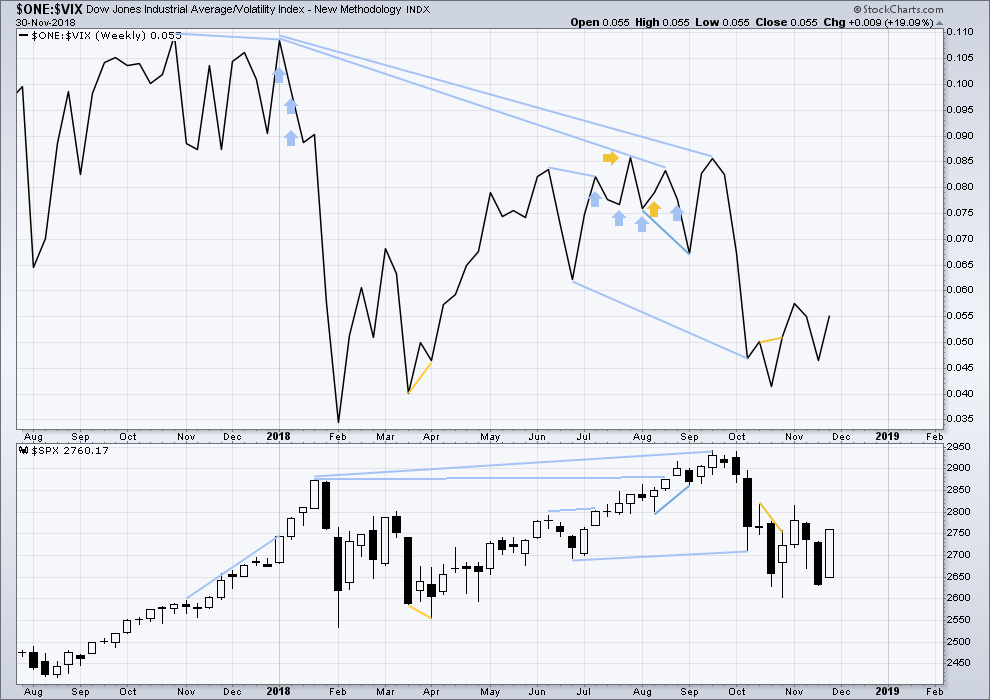
Click chart to enlarge. Chart courtesy of StockCharts.com. So that colour blind members are included, bearish signals
will be noted with blue and bullish signals with yellow.
Both price and inverted VIX have moved higher this week. There is no short-term divergence.
DAILY CHART
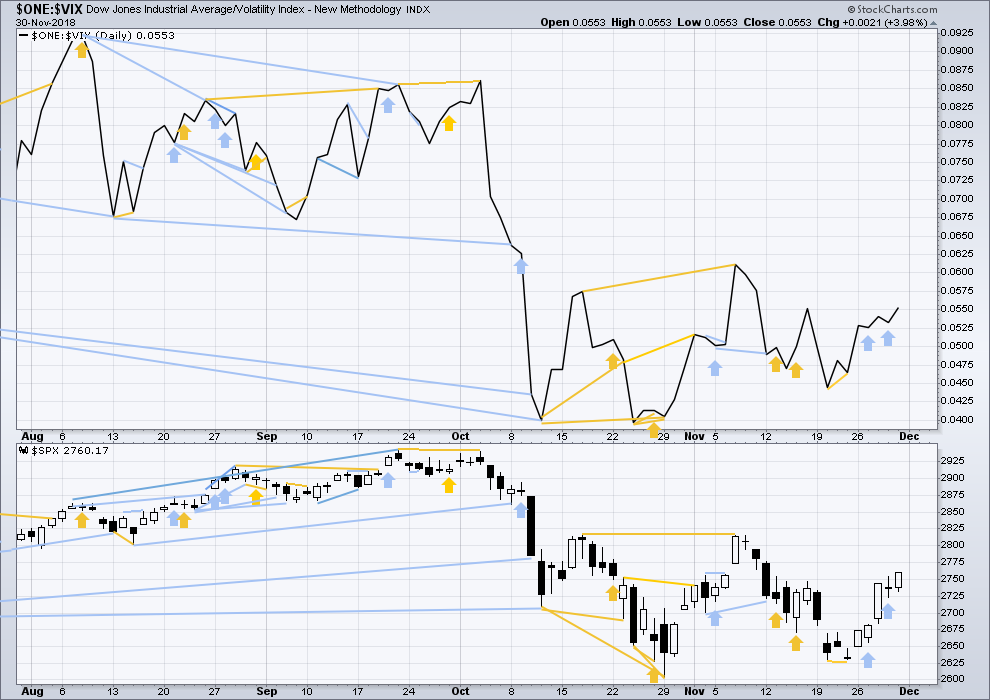
Click chart to enlarge. Chart courtesy of StockCharts.com. So that colour blind members are included, bearish signals
will be noted with blue and bullish signals with yellow.
Normally, volatility should decline as price moves higher and increase as price moves lower. This means that normally inverted VIX should move in the same direction as price.
Like the AD line, inverted VIX may now begin to accumulate instances of bearish signals or divergence as a fifth wave at three large degrees comes to an end.
Both price and inverted VIX have moved higher on Friday, and both have made new short-term swing highs above the prior swing high of the 16th of November. There is no short-term divergence.
DOW THEORY
All of DJIA, DJT, Nasdaq and the S&P are moving higher this week.
The following lows need to be exceeded for Dow Theory to confirm the end of the bull market and a change to a bear market:
DJIA: 23,344.52.
DJT: 9,806.79.
S&P500: 2,532.69.
Nasdaq: 6,630.67.
Published @ 02:44 a.m. EST on December 1, 2018.
—
Careful risk management protects your trading account(s).
Follow my two Golden Rules:
1. Always trade with stops.
2. Risk only 1-5% of equity on any one trade.

I’m a bit nervous this morning to put this chart up here before the market has closed and before I can see volume data for this session.
But from an EW POV it’s now possible to see a very neat complete five wave impulse for minor wave 1.
The bullish scenario which is equally as likely is that minute wave v may continue. Today’s high may be only minuette wave (i) within minute wave v. This bullish scenario will remain equally as valid while price remains within the Elliott channel, and above 2,726.86.
And so for any confidence whatsoever that minor wave 2 has arrived, we need to see a breach of the channel by downwards (not sideways) movement, and then a new low below 2,726.88. But a good channel breach will be enough for reasonable confidence.
My target for minor wave 2 would be preferred at the 0.382 Fibonacci ratio.
Hi Lara after looking at the volume numbers and other things after the market closed today.
Do you still feel the same way about your daily update?
Thank You
RUT look’n done at AM highs….?
or spoke too soon
Since it is never clear here… who was positioned before the close Friday for what occurred here when markets opened Sunday through this morning?
If nobody positioned as most are day traders here… what direction are you playing for today?
I have been full bore long for a while and plan to remain so until at least end of Intermediate 3.
I trade multiple time frames. I’ve already taken some good size profits in the Q’s, which I bought close of day Fri. I also have a variety of long spreads, including put credits. Holding those. Getting longe in Q’s, IWM, SPY here, as well as selling some premium below key turn fibo levels in selected big caps. The bull is roaring, obviously. The news has fulfilled the requirements of the EW count, surprise surprise.
The highs here this morning so far are not at highly likely turn levels (not fractal fibo levels). My expectations is a partial gap fill, then renewed upward action.
Right… we got the top of the channel and now down and maybe back to 2815 today?
Sounds like a high potential scenario to me Peter. 2815 obviously being a key 100%/swing high, and thus a very likely completion level for the minute v of the minor 1.
And…I guess that’s about the place (with some turn indications and sell triggers) I take massive profit on the short leg of my SPY bull put spread. And pray to the EW gods for a DEEP minor 2!!!
My question of the moment is when do the big players start buying here? I believe they are watching and waiting with their guns loaded for the bird to get closer…closer…we’ll see.
I followed my lesson from Friday: stay out of the slop!!! Reverse…reverse…reverse…reverse…ah, fuhgeddaboutit!
No knife work for me today. Got nicked friday, that was enough.
Wow! ES futures for SPX are up 48.45 at this moment. It sure looks like we are seeing 3rd wave action. Green prints to start this Santa Claus rally. All aboard the Santa sleigh for a ride up past 2800. The late comers who don’t want to miss the ride are going to be pushing this up. Hold on.
Wait for the wave 2 IMO, it could definitely touch 2820s or might drip down to 2780 by open…. but regardless expects it to consolidate this move from 2630 in next few days… IMO
Till now, I was completely considerate the P4 done and that we are in P5 but this move reminds me of the same move after the midterm elections and making me think that we might got to new lows around 2600 if this move turns out to be a flat B??? But just IMO.. I guess how it consolidates from here or moves down will help in working out…
Big second wave….look out below! 🙂
Dontcha think price needs to finish the minor 1 up first? This action appears corrective at a lower degree.
Hey there Verne
I’m new to the comment section … but have been following your comments
Just curious how you are positioned right now
You were talking about 275 puts last week on the day before expiration…
We are now 40 points higher
So you must be feeling some pain… you were very confident that what was coming was a pretty big down move
So would assume that you got caught pretty good
You
Mentioned how important it was to know the overall trend
It happens… but wanted to follow up as I get a feel for the traders on the board and their opinions
A very bullish week indeed. Thank you Lara for the analysis. I just love how classical TA can help determine which EW count is most likely correct. Volume this week and Friday especially was large and significant.
The only thing I would add to this classical TA is that the McClellan Oscillator has given two buy signals, one at the 2604 low and the other at the 2631 low. One to start Intermediate 1 and the other to start Intermediate 3. These both support the Main Count.
Finally, some are still calling the move from the ATH to 2604 as the first wave in a very bearish five wave downward pattern. The second wave would be and ‘A’ to 2815; ‘B’ to 2631; and now is ‘C’ of 2 to end around 2860 or so. This would be followed by a large third wave down to the low 2000’s in SPX. This count does not align with classical TA as Lara has pointed out. The final nail in the coffin for this count will be a new ATH above 2940. Note: Lara’s Intermediate 3 target is 2973 which would invalidate the very bearish count. Those bears who capitulate at that point would get long just before the final top at 3100. Very interesting.
Thanks again Lara.
Thanks Rodney.
I’m so glad I did my CMT. Adding classic analysis to Elliott wave skills… I am so much more comfortable with the charts I publish for you all now. And more confident in the few times I give specific trading advice.
1st on the 1st of December. Have a great December everyone. In the US we are having a most extreme winter. Record cold temps and snowfall in many locations. Where I live, we have been spared these extremes.