Upwards movement was expected for Wednesday’s session. A higher high and a higher low fits the definition of an upwards day.
Summary: For the short term, a low may be in place if the teal trend line offers support. A target for the next wave up is either 2,843 or 2,975. Have some confidence in this view if price makes a new high above 2,685.75.
The zigzag wave count is given a closer look today. It is possible that price may move lower to overshoot the teal channel. The target for a low is about 2,591.
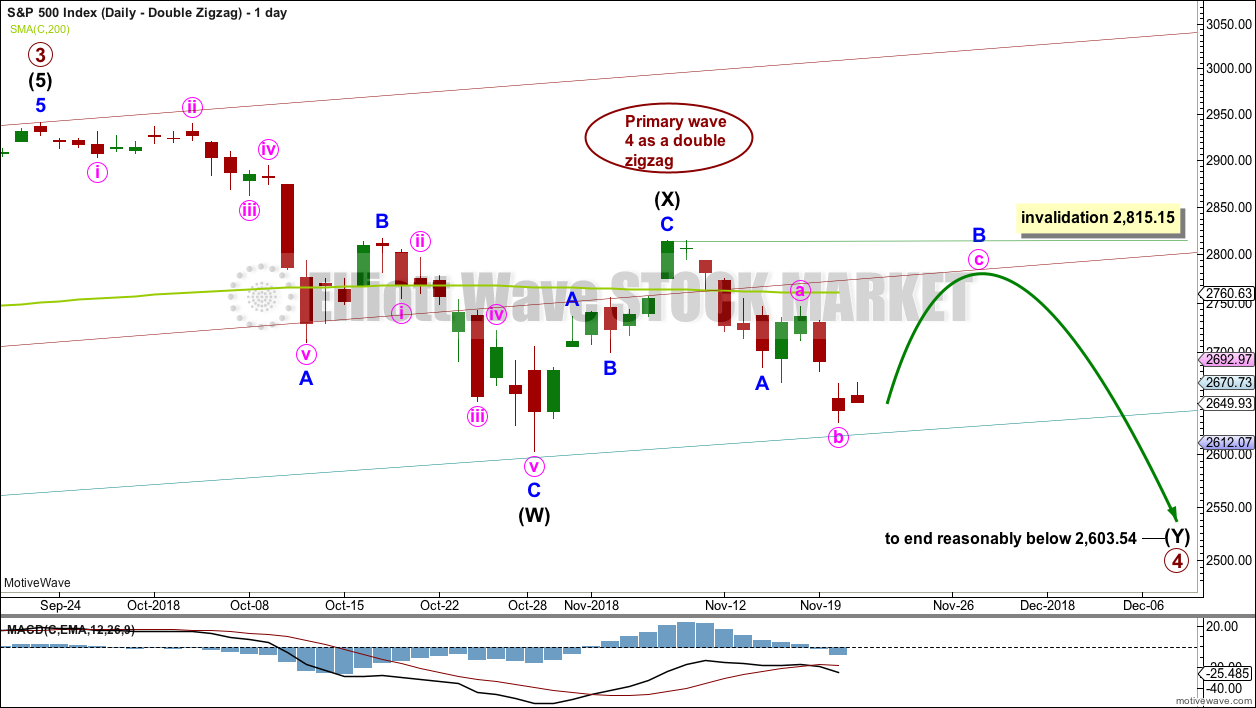
Five daily charts today look at five different structures for primary wave 4, in order of probability (roughly): triangle, combination, zigzag, double zigzag, and flat.
Primary wave 4 could be over. The alternate wave count outlines this possibility.
New updates to this analysis are in bold.
The biggest picture, Grand Super Cycle analysis, is here.
Last published monthly chart is here, video is here.
ELLIOTT WAVE COUNT
WEEKLY CHART
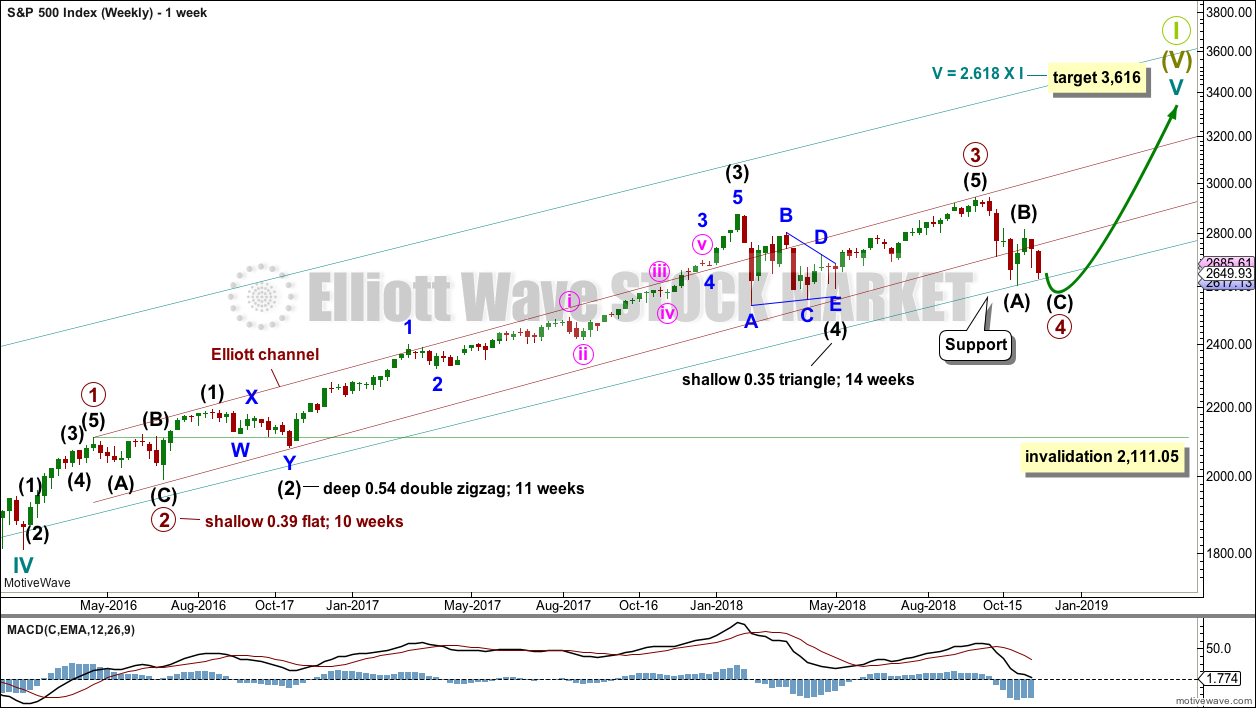
Cycle wave V must complete as a five structure, which should look clear at the weekly chart level and also now at the monthly chart level. It may only be an impulse or ending diagonal. It is clear it is an impulse.
Cycle wave V has passed equality in length with cycle wave I, and 1.618 the length of cycle wave I. The next Fibonacci ratio is used to calculate a target. When primary wave 4 is complete and the starting point for primary wave 5 is known, then the final target may also be calculated at primary degree. At that stage, there may be two targets, or the final target may widen to a small zone.
Within cycle wave V, the third waves at all degrees may only subdivide as impulses.
Within primary wave 3, there is perfect alternation and excellent proportion between intermediate waves (2) and (4).
The maroon channel is drawn about primary degree waves. The first trend line is drawn from the ends of primary waves 1 to 3, then a parallel copy is placed upon the low of primary wave 2. The overshoot of the upper edge of this channel by the end of intermediate wave (3) looks typical. For the S&P, its third waves are usually the strongest portion of an impulse; they often exhibit enough strength to overshoot channels.
Primary wave 4 now has an overshoot on the lower edge of the channel. This is acceptable; fourth waves are not always neatly contained within channels drawn using this technique.
Primary wave 4 may find very strong support about the lower edge of the teal channel, and it looks like this is from where price bounced on the 29th of October. This channel is copied over from the monthly chart and contains the entire bull market since its beginning in March 2009. While Super Cycle wave (V) is incomplete, this channel should not be breached at the weekly chart level.
Draw the teal channel from the high of cycle wave I at 1,343.80 on the week beginning 3rd July 2011, to the high of cycle wave III at 2,079.46 on the week beginning 30th November 2014, and place a parallel copy on the low of cycle wave II at 1,074.77 on the week beginning 2nd October 2011. Draw this chart on a semi-log scale. Price is right at the lower edge of this channel. This may provide support. A small overshoot, like that seen at the end of cycle wave IV, would be entirely acceptable. If price does move below the channel, then it should reverse reasonably quickly.
Primary wave 4 may not move into primary wave 1 price territory below 2,111.05.
At this stage, the expectation is for the final target to be met in October 2019. If price gets up to this target and either the structure is incomplete or price keeps rising through it, then a new higher target would be calculated.
At this stage, the various possible structures for primary wave 4 will be published as separate daily charts, presented in order of probability.
DAILY CHART – TRIANGLE
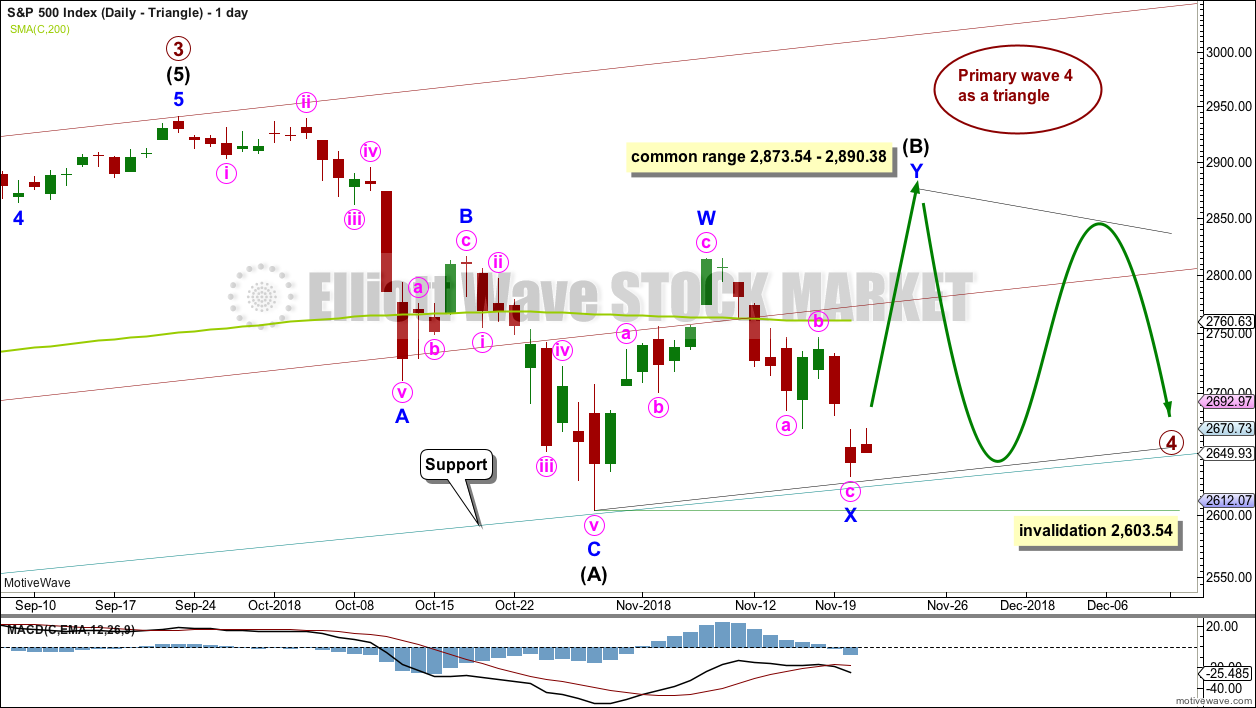
If primary wave 4 unfolds as a triangle, it would have perfect alternation with the regular flat correction of primary wave 2. It would also continue to find support about the lower edge of the teal trend channel. Triangles are fairly common structures for fourth waves. For these reasons this wave count may have a slightly higher probability than the other daily charts.
Price is almost right at the lower edge of the teal trend channel. This may provide enough support to halt the fall in price here.
If primary wave 4 is unfolding as a triangle, then within it intermediate wave (B) would most likely be incomplete. To label intermediate wave (B) over at the last swing high is possible, but it would look too shallow for a normal looking Elliott wave triangle.
Triangle sub-waves are often about 0.8 to 0.85 the length of the prior wave. This gives a target range for intermediate wave (B).
One triangle sub-wave may subdivide as a multiple; this is most often wave C, but it may also be wave B. Intermediate wave (B) may be unfolding higher as a double zigzag.
There is no upper invalidation point for this wave count. Intermediate wave (B) may make a new high above the start of intermediate wave (A) as in a running triangle. Intermediate wave (B) should exhibit clear weakness. If price does make a new high, then for this wave count it should come with weak volume and bearish divergence between price and one or both of RSI or Stochastics.
Within the triangle, intermediate wave (C) may not move beyond the end of intermediate wave (A) below 2,603.54.
HOURLY CHART – TRIANGLE
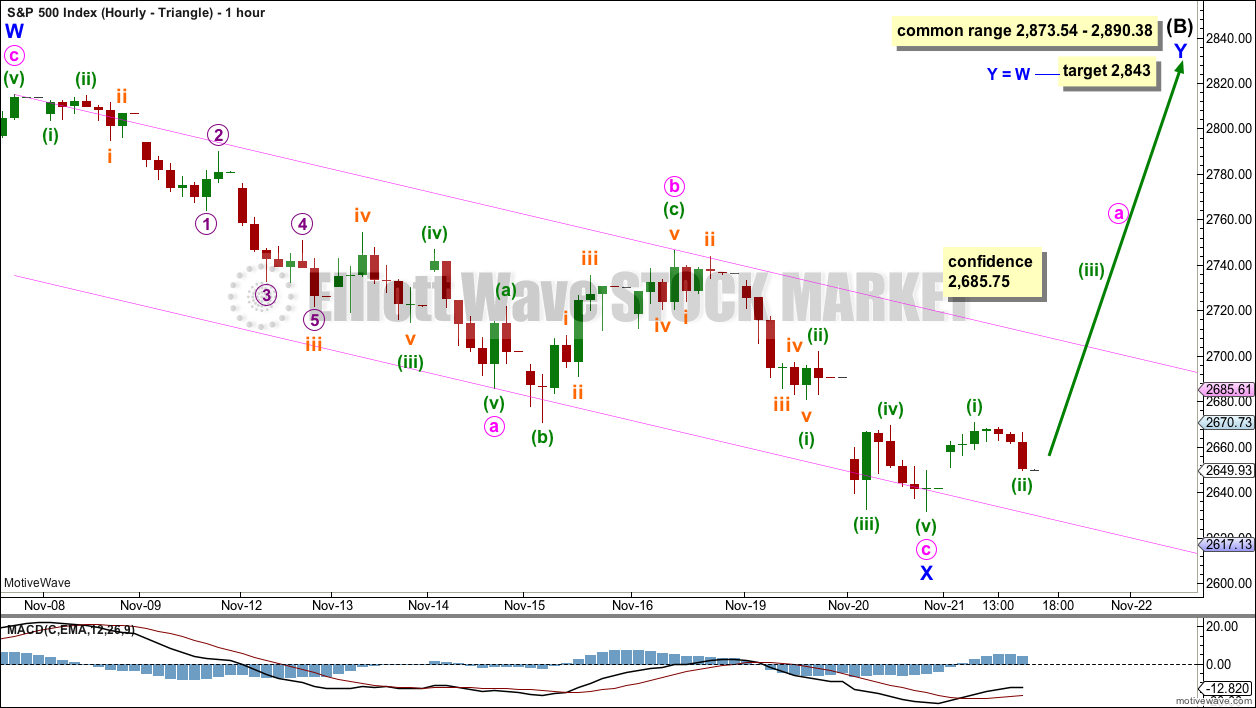
Minor wave X may be seen as a complete zigzag. Minute wave c may now be a complete five wave impulse.
Confidence that a low is most likely in place would come if price breaks above the upper edge of the pink Elliott channel drawn about minor wave X.
The target at 2,843 would see intermediate wave (B) just a little shorter than the most common length for a triangle sub-wave. This would be acceptable.
DAILY CHART – ZIGZAG
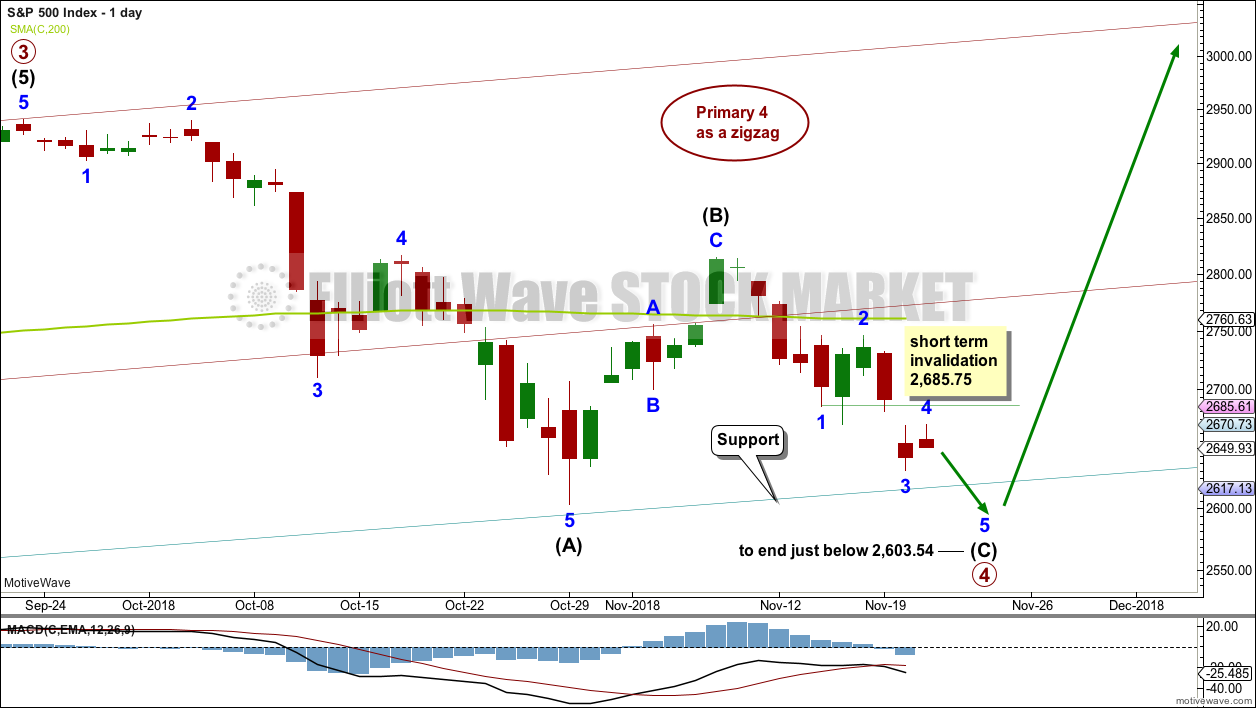
Primary wave 4 may be unfolding as a single zigzag, which is the most common type of corrective structure. This would provide perfect alternation with the flat correction of primary wave 2.
Within the zigzag, intermediate wave (B) may now be a complete structure, ending close to the 0.618 Fibonacci ratio of intermediate wave (A).
Intermediate wave (C) may now unfold lower as a five wave structure. Intermediate wave (C) would be very likely to end at least slightly below the end of intermediate wave (A) at 2,603.54 to avoid a truncation. It may end about support at 2,600.
Within intermediate wave (C), minor waves 1 through to 4 may be complete. If this labelling is correct, then minor wave 4 may not move into minor wave 1 price territory above 2,685.75. Minor wave 5 may be relatively short and brief; this structure could be complete as quickly as just one more session.
This wave count could expect a reasonably small overshoot of the teal trend channel if the labelling within intermediate wave (C) is correct.
If the lower edge of the teal channel is overshot, then it would most likely be followed by a fairly quick reversal, possibly even intraday. If the bull market remains intact, then it would be most likely that there would not be a full daily candlestick below the trend channel, and very unlikely for a full weekly candlestick to print below the channel.
DAILY CHART – COMBINATION
This wave count is judged to have only a very slightly lower probability than the triangle.
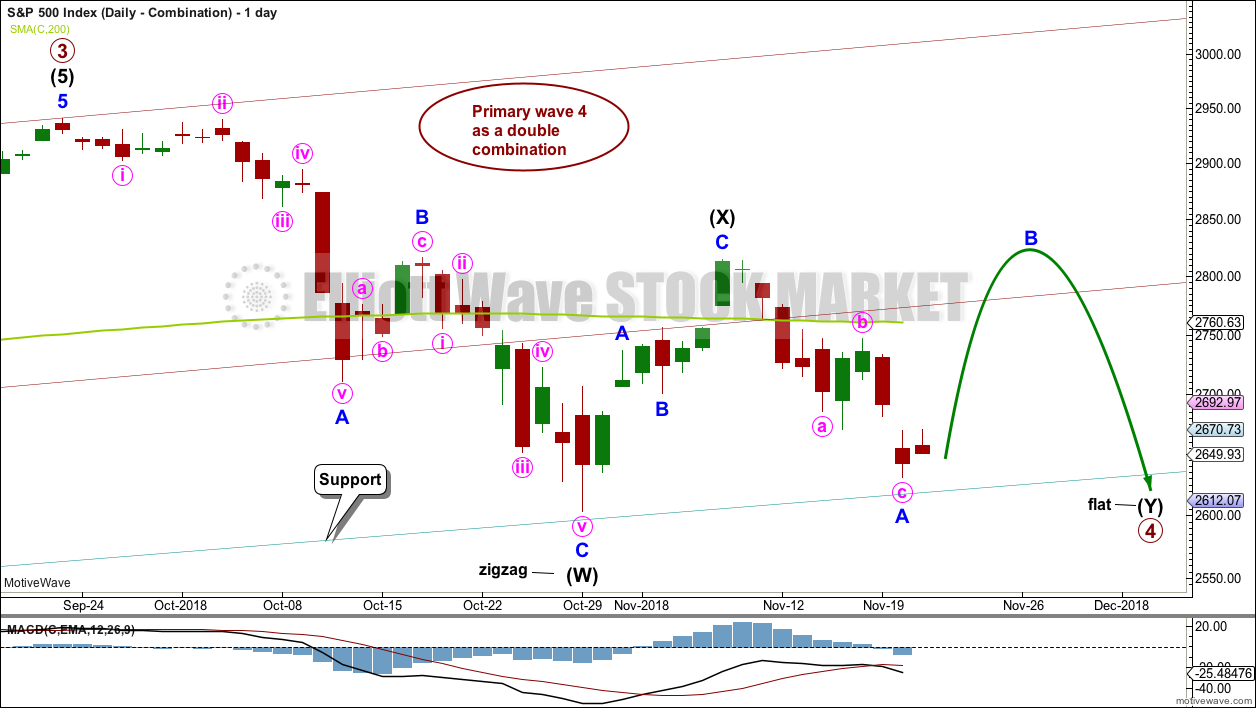
Primary wave 4 may be unfolding as a double combination. The first structure in the double may be a complete zigzag labelled intermediate wave (W). The double may be joined by a three in the opposite direction labelled intermediate wave (X). Intermediate wave (X) may be complete as a single zigzag; it is deep at 0.63 the length of intermediate wave (W), which looks reasonable.
Intermediate wave (Y) would most likely be a flat correction, which should subdivide 3-3-5. At its end, it may still find strong support about the lower edge of the teal trend channel.
At the hourly chart level, minor wave A may be a complete zigzag, in exactly the same way as minor wave X on the hourly chart published above.
Within the flat correction of intermediate wave (Y), minor wave B must retrace a minimum 0.9 length of minor wave A at 2,797.08. The common range for minor wave B is from 1 to 1.38 times the length of minor wave A giving a range from 2,815.15 to 2,884.93. Minor wave B may make a new high above the start of minor wave A at 2,815.15 as in an expanded flat.
DAILY CHART – FLAT
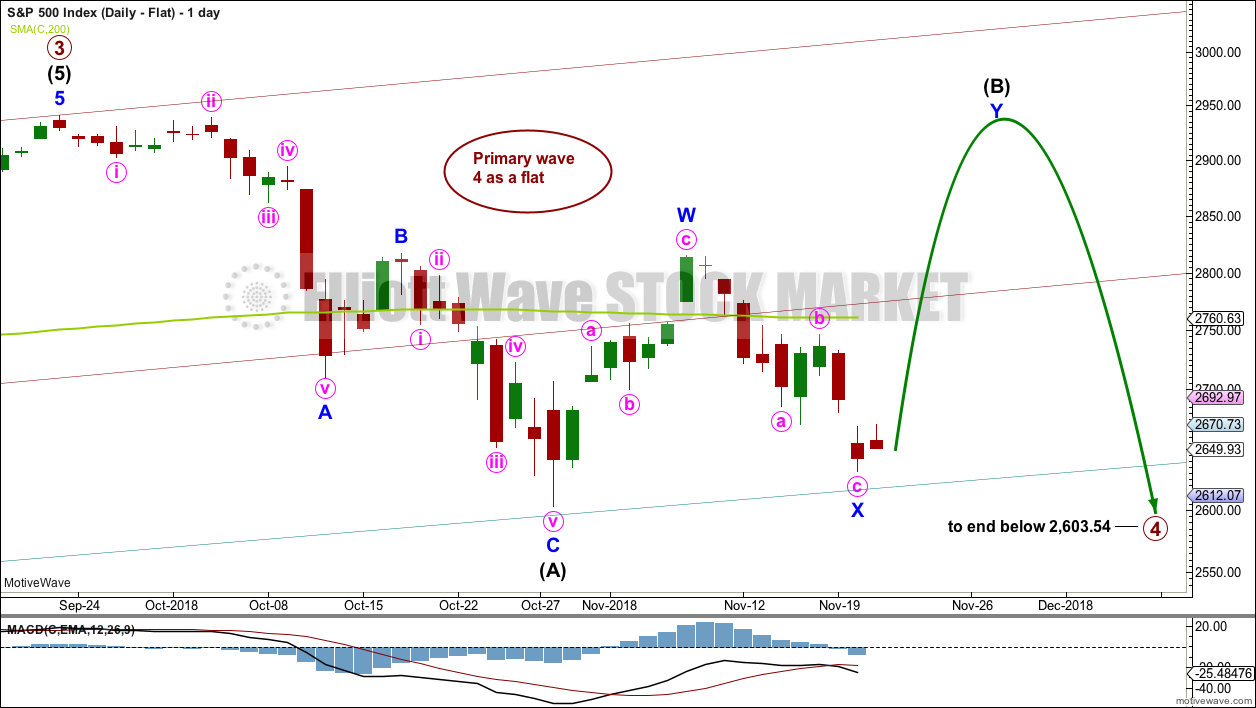
Primary wave 2 was a regular flat correction. If primary wave 4 unfolds as a flat correction, then there would be no alternation in structure between the two corrections; for this reason, this wave count is judged to have a low probability.
However, alternation is a guideline, not a rule, and it is not always seen. This wave count is possible.
If primary wave 4 is a flat correction, then within it intermediate wave (B) must move higher to retrace a minimum 0.9 length of intermediate wave (A).
When intermediate wave (B) is complete, then intermediate wave (C) should move below the end of intermediate wave (A) at 2,603.54 to avoid a truncation. This would expect a large overshoot of the teal trend line, which further reduces the probability of this wave count.
DAILY CHART – DOUBLE ZIGZAG
Primary wave 4 may also be unfolding as a double zigzag.
The first zigzag in the double may be complete, labelled intermediate wave (W). The double may joined by a complete three in the opposite direction, a zigzag labelled intermediate wave (X).
The second zigzag in the double may have begun. It is labelled intermediate wave (Y). Within intermediate wave (Y), minor wave B may not move beyond the start of minor wave A above 2,815.15.
The purpose of a second zigzag in a double is to deepen the correction when the first zigzag does not move price deep enough. To achieve this purpose intermediate wave (Y) should be expected to end reasonably below the end of intermediate wave (W) at 2,603.54. This would expect a very large overshoot of the teal trend channel; for this reason, this wave count is judged to have the lowest probability.
BULLISH ALTERNATE ELLIOTT WAVE COUNT
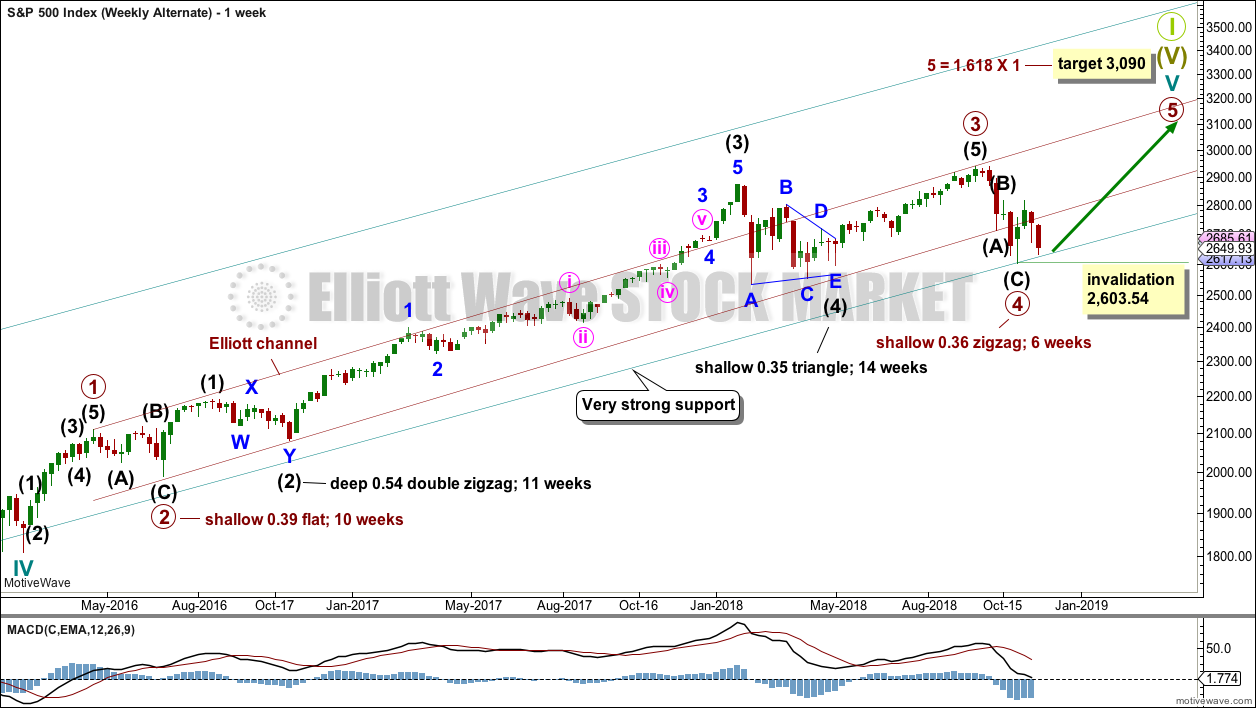
WEEKLY CHART
It is possible that primary wave 4 could be over as a relatively quick zigzag, ending about support at the lower edge of the teal channel.
The proportion between primary waves 2 and 4 is reasonable. Flat corrections tend to be longer lasting structures than zigzags. There would be perfect alternation in structure and inadequate alternation in depth. This is acceptable.
This wave count has the right look at the monthly chart level.
If primary wave 5 ends at or after the end of December 2018 and the AD line fails to make new all time highs, there would then be the minimum required four months of bearish divergence between price and the AD line. If this happens, then the conditions for the end of this bull market would be in place.
A new target is calculated for primary wave 5 to end. If primary wave 5 were to be only equal in length with primary wave 1, then it would be truncated. A truncated primary wave 5 would be unlikely as then there could be no bearish divergence with the AD line. The next Fibonacci ratio in the sequence is used to calculate a target for primary wave 5.
Within primary wave 5, no second wave correction may move beyond the start of its first wave below 2,603.54.
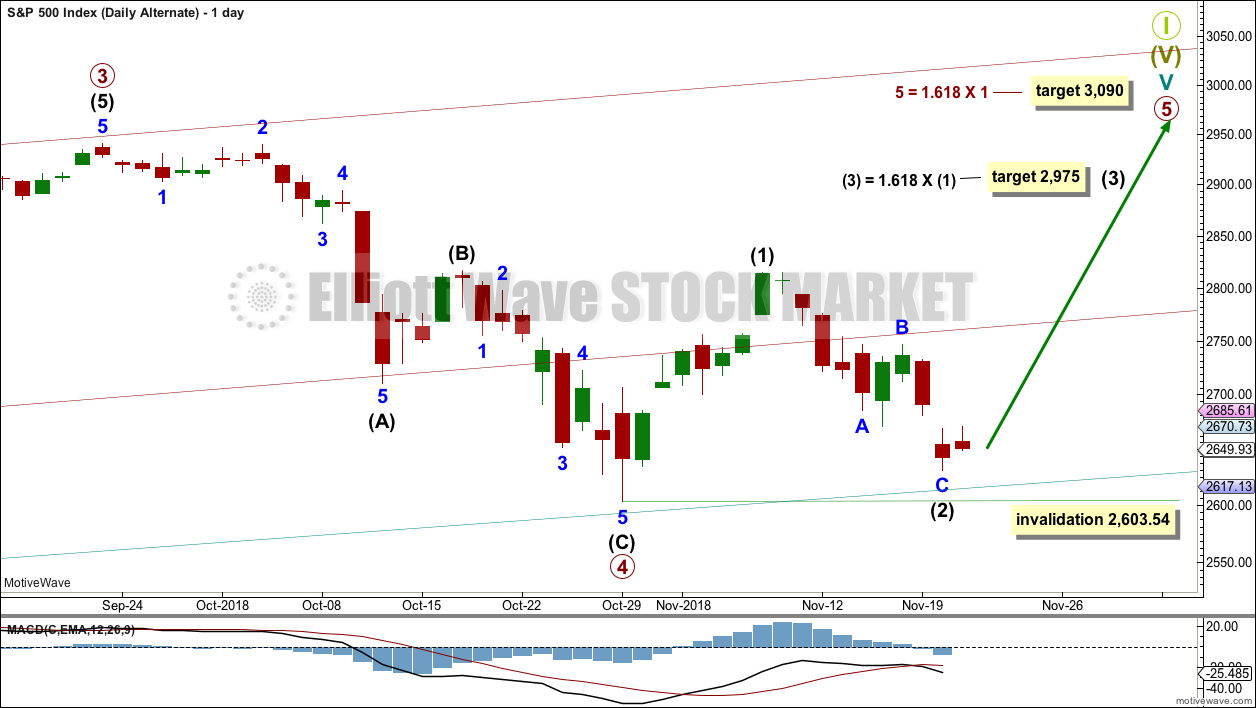
DAILY CHART
The subdivisions of primary wave 4 are seen in exactly the same way as most of the charts above except the degree of labelling is just moved up one degree.
Within primary wave 5, intermediate wave (1) may be over. Intermediate wave (2) may not move beyond the start of intermediate wave (1) below 2,603.54. Intermediate wave (2) may have ended at support at the lower edge of the teal trend channel.
Primary wave 5 may subdivide either as an impulse (more likely) or an ending diagonal (less likely). Intermediate wave (1) may be seen as either a five wave impulse or a three wave zigzag at lower time frames, and so at this stage primary wave 5 could be either an impulse or a diagonal.
Primary wave 5 at its end may be expected to exhibit reasonable weakness. At its end, it should exhibit a minimum of 4 months bearish divergence with the AD line, it may exhibit bearish divergence between price and RSI and Stochastics, and it may lack support from volume; it may not be possible to distinguish a weak fifth wave from a B wave.
TECHNICAL ANALYSIS
WEEKLY CHART
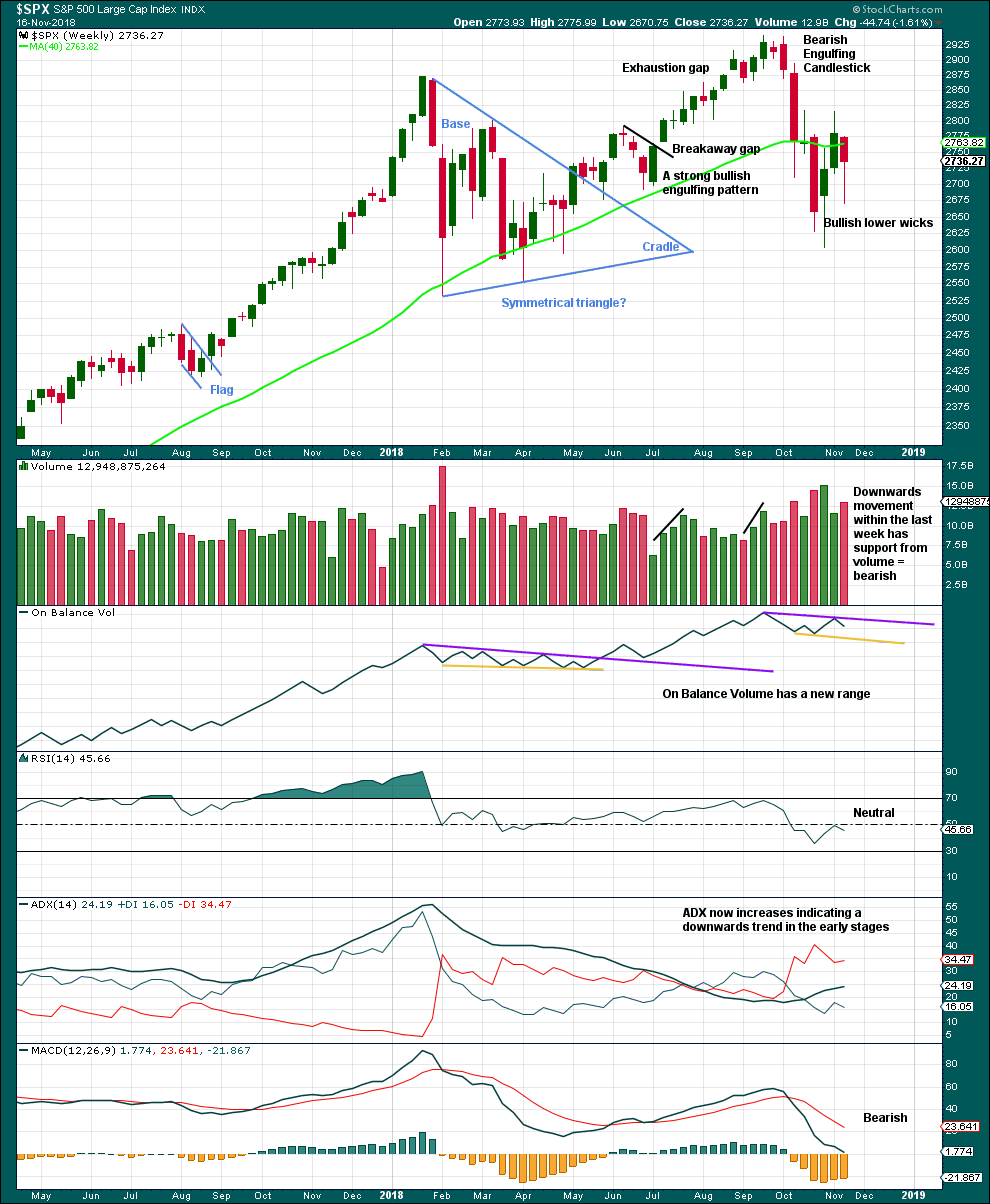
Click chart to enlarge. Chart courtesy of et=”_blank”>StockCharts.com.
Another long lower wick last week is fairly bullish. An upwards week this week looks most likely.
DAILY CHART
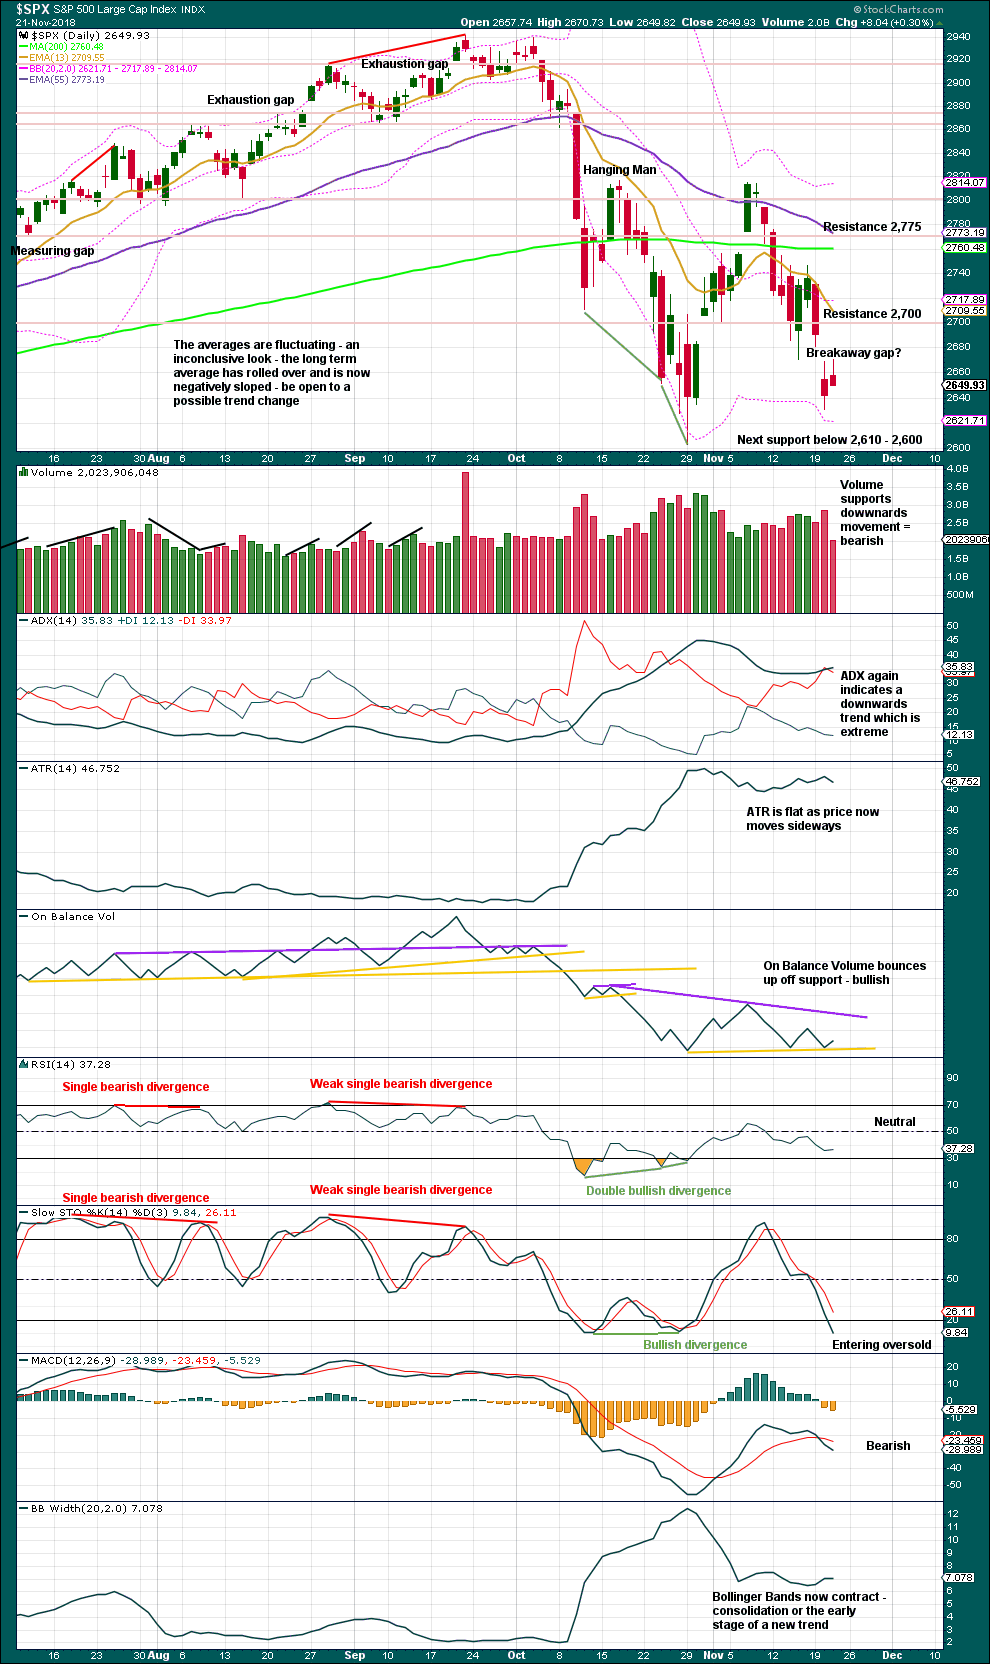
Click chart to enlarge. Chart courtesy of StockCharts.com.
The lower edge of the teal trend channel is not shown on this chart, but it should be considered as part of this technical analysis. Expect that trend line to continue to provide support, until it does not.
On Balance Volume has found support and bounced up.
The last gap may be either a pattern or breakaway gap. It remains open today, which is bearish, but price remains range bound. If price does move lower, then look for strong support about 2,610 – 2,600.
BREADTH – AD LINE
WEEKLY CHART
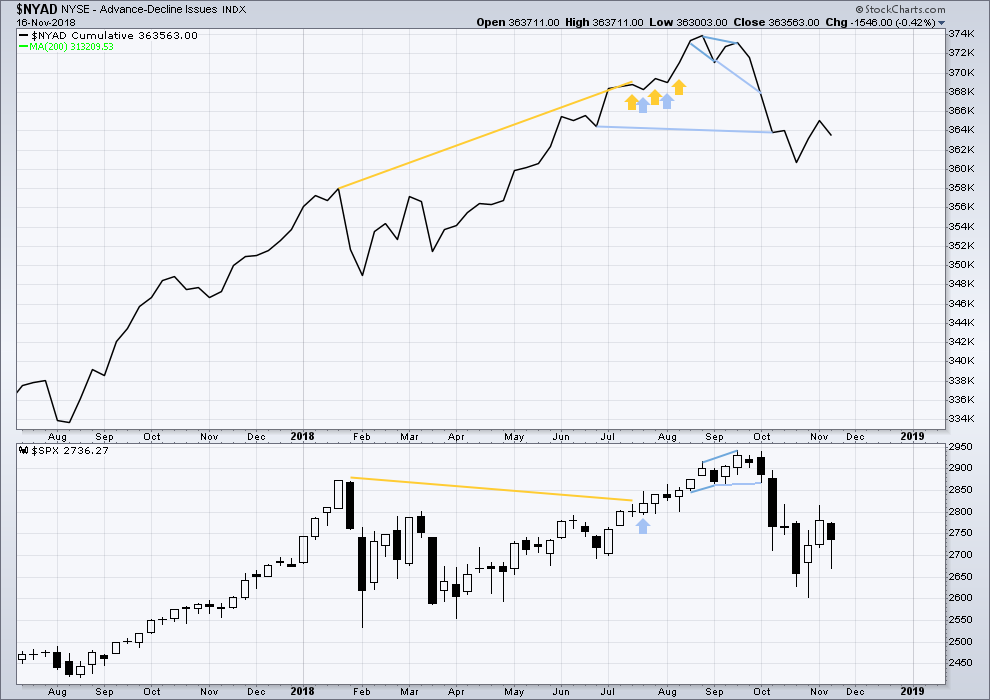
Click chart to enlarge. Chart courtesy of StockCharts.com. So that colour blind members are included, bearish signals
will be noted with blue and bullish signals with yellow.
Last week both price and the AD line have moved lower. There is no new divergence.
DAILY CHART
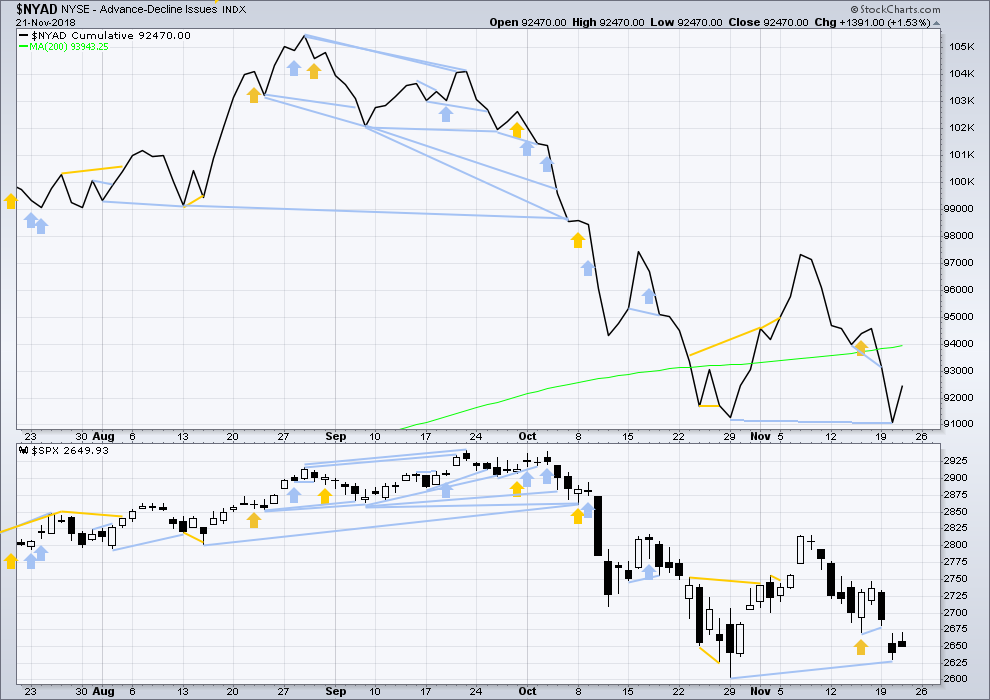
Click chart to enlarge. Chart courtesy of StockCharts.com. So that colour blind members are included, bearish signals
will be noted with blue and bullish signals with yellow.
There is normally 4-6 months divergence between price and market breadth prior to a full fledged bear market. This has been so for all major bear markets within the last 90 odd years. With no longer-term divergence yet at this point, any decline in price should be expected to be a pullback within an ongoing bull market and not necessarily the start of a bear market. New all time highs from the AD line on the 29th of August means that the beginning of any bear market may be at the end of December 2018, but it may of course be a lot longer than that. My next expectation for the end of this bull market may now be October 2019.
Breadth should be read as a leading indicator.
Bearish divergence noted in yesterday’s analysis has not been followed by any downwards movement. It may have failed, or it may yet be followed by some downwards movement.
VOLATILITY – INVERTED VIX CHART
WEEKLY CHART
Click chart to enlarge. Chart courtesy of StockCharts.com. So that colour blind members are included, bearish signals
will be noted with blue and bullish signals with yellow.
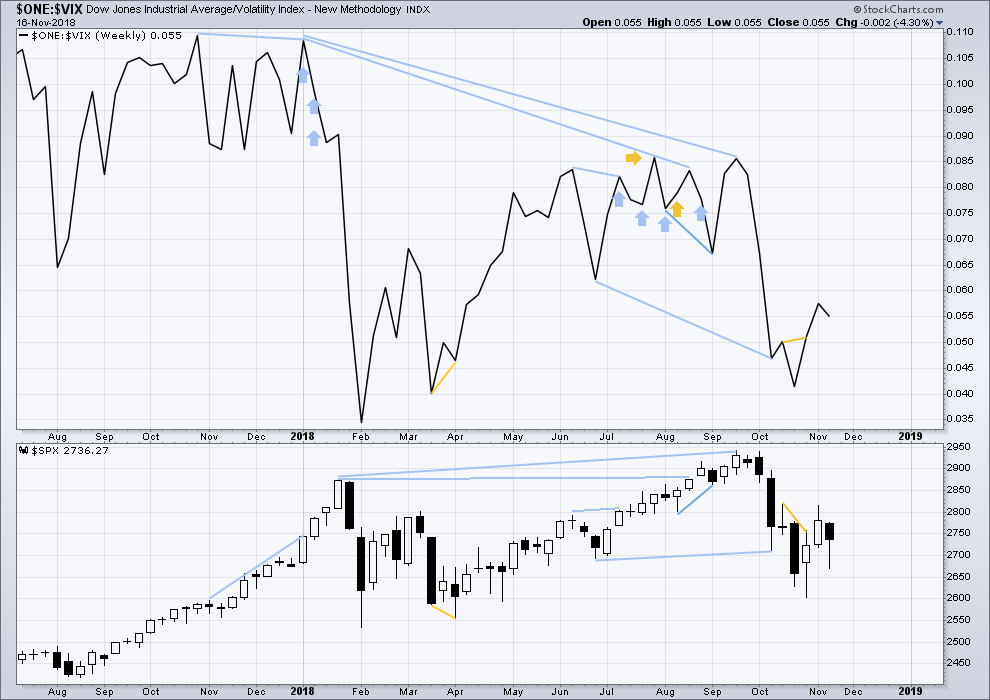
Last week both price and inverted VIX have moved lower. There is no new divergence.
DAILY CHART
Click chart to enlarge. Chart courtesy of StockCharts.com. So that colour blind members are included, bearish signals
will be noted with blue and bullish signals with yellow.
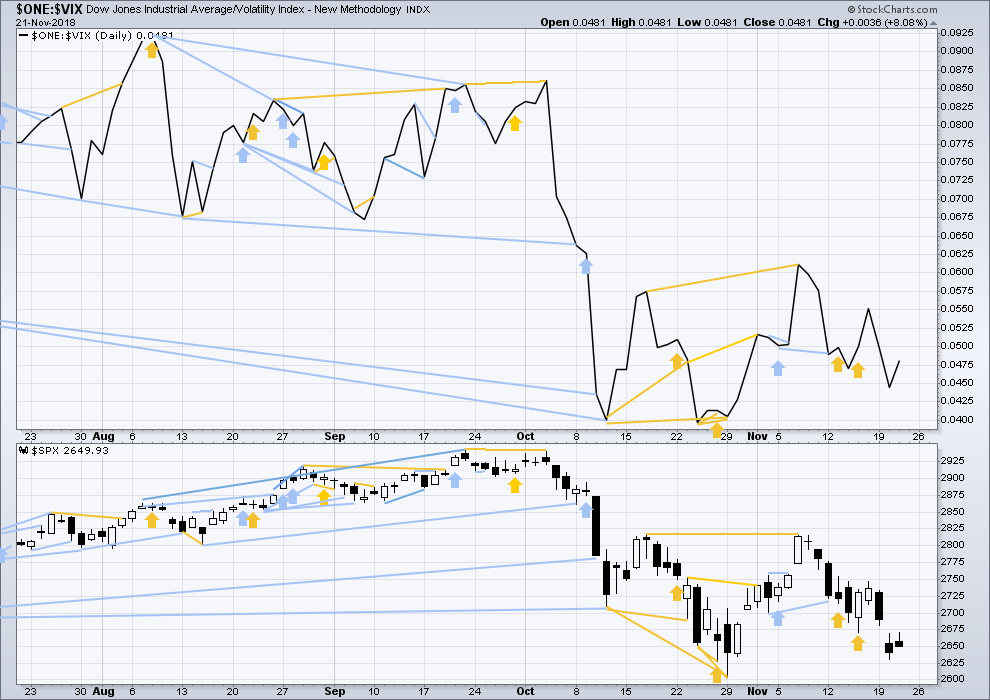
Normally, volatility should decline as price moves higher and increase as price moves lower. This means that normally inverted VIX should move in the same direction as price.
Today both price and inverted VIX moved higher. There is no short-term divergence.
DOW THEORY
The following lows need to be exceeded for Dow Theory to confirm the end of the bull market and a change to a bear market:
DJIA: 23,344.52.
DJT: 9,806.79.
S&P500: 2,532.69.
Nasdaq: 6,630.67.
Published @ 06:05 p.m. EST.
—
Careful risk management protects your trading account(s).
Follow my two Golden Rules:
1. Always trade with stops.
2. Risk only 1-5% of equity on any one trade.

A half day at the NYSE today saw me not here in time to update you before the markets close.
The zigzag count is looking the best with today’s downwards movement, but both hourly charts remain viable.
Yes indeed! 🙂
We will likely see an interim bottom on Monday according to our indicators.
Bull put spreads at the ready! Later!
Remember we close early today at 1.00 p.m. EST.
The banksters will probably dump into the close, and mount a manic rally starting in futures Sunday evening…taking the money on short term trades a getting out of Dodge…
Oil (/CL here, daily) is in free fall.
Here are my potential turn levels. I expect in general a pause/head fake at each one, just as occurred at the prior 61.8% at 55.4…until it finally bottoms. I have no idea which one that will occur at, but the market will tell us.
I agree with Rod’s count of some kind of fifth wave down unfolding.
Just as in bull markets bearish market signals can often be negated, so also in bear markets, or significant corrections. We saw a nice hammer this morning, but no VIX spike. I suspect it is an artifice.
For what it is worth, which may not be a whole lot, here is my updated SPX 5 minute chart with a lower low today at 2631.09. (The white labels are taken over from the 1 minute chart and do not correspond to Lara’s labeling pattern.)
I’m in agreement with hash_trader below: RUT is looking quite bullish here. “All aboard!!!”.
Looks quite bullish, doesn’t it??
Leading for now…. let’s see how it closes
Watching for confirming buy triggers on this hourly chart: break of the trend line, and polarity inversion to higher swing highs/higher swing lows. And my trend indicator getting to yellow (up) or green (strong up). Then I’ll double up on my long position.
US 20 years bonds are in a counter trend rally, absolutely standard behavior as this one week chart demonstrates. My 5 white lines show prior such kick back rallies (in price and time) positioned over the current one. Bonds/TLT is a hugely “symmetric” instrument this way; it’s behavior is highly repetitive and similar in price/time re: counter trend moves.
The chart shows the story. The very likely termination area for this rally is around that 61.8% (the most common retrace pct. of all markets), forming another highly symmetric “bearish symmetric” counter trend move.
I just look profit the move up so far, and am scaling in long again for more. This is a situation where I am okay trading counter-trend (both the monthly and weekly are in clear down trends, though this weekly is likely to go neutral with much more upward movement). Even the monthly may do that around the time I expect this move to top.
A good friend who owned a ton of FANG stocks has been recently thanking me effusively for convincing him to get out in September after I showed him some 5 year EMA charts. As a business owner he understands numbers and the RTM concept.
We were talking about the subsequent Trillion dollar haircut and he got this far-away look and asked:
“Do you think it’s time to get back in?”
,I knew exactly where he got that idea of a
” great buying opportunity”.
Is anyone else suspicious of co-ordinated media themes, or is it just me?! 🙂
The Fear Greed Indicator is just one small indicator and not to be given too much weight in an of itself.
I am with you Verne on all the concerns you express. I think the completion of the Cycle V wave as shown by Lara is just around the corner. But not yet. Of course, I could be totally wrong and pay a price for that view. But we have yet to get the negative divergence in breadth which has always preceded a bear market turn. Primary 4 is making a good set up for this to occur, just as Lara has indicated.
That being said, it looks like the open will be down 20+ points. Crude oil is being hammered again. It is nearing $50. Wowza!
I work hard to not hear/pa not attention to the media whatsoever re: market movement. Pure white noise!
TSLA has initiated its swing back down; I think I pointed out this potential last week. No certainty of course but the chart screams at me that price is going to the 61.8% area at 293. Or deeper, to the 78.6% area at 273. And…price is falling in a daily time frame squeeze (two red dots lower indicator), lending more support to potential of a sharp move down here.
The Media always rolls out the Buy the dip talking heads in a co-ordinated manor… always! So you’re spot on Verne!
Verne, I edited my response which included a link. As a result, it is awaiting moderation. I am posting it again in this spot.
———————————————————————————————————-
Sorry about that Verne. This is a chart over time of the Fear & Greed Indicator CNN keeps. The link is below.
https://money.cnn.com/data/fear-and-greed/
The Indicator oscillates between 0 and 100. They use seven other indicators to compile this one. It is all explained at the link given. The lower the reading, the higher the fear and the higher the number, the lower the fear among market participants. Theoretically, and I think the chart lends credence, when market conditions show extreme fear, like now, the closer we are to a bottom in equities.
Reply
Thanks Rod.
If there is truly fear in this market, I am just not seeing it, and vol price action is an area of particular interest. In fact, it is the abscence of fear that really has me worried. I see a Pavlovian BTFD ten year conditioned response despite a clear paradigm market shift. The technical damage is significant.
A few obvious ones are neck-line breaks of several H&S patterns, downward sloping 200 dsma after price moved below, and repeated challenges to 2009 anchored bull trend-lines (already violated by NDX 100).
It is possible that we could get a turn here without capitulation selling.
If that happens I would become even more bearish CNN, notwithstanding…(they do have some big problems).
Lowered my 17,000 Dow projection to 16,000 by mid-December.
Good luck!
You are really starting to scare me Ian…
And I thought I was bearish…!!! 😀
The banksters will cry “Uncle!” on any move below DJIA 20K imho..
The bounce off 19,000 will be a site of awe!
Can you provide the rationale for your projection?
I will let this chart speak for itself.
Rodney I am afraid as presented the chart is difficult to intetpret…no units! I know it is not a chart of put/call ratio or a BPI reading.
Source? 🙂
Sorry about that Verne. This is a chart over time of the Fear & Greed Indicator CNN keeps. The link is below.
https://money.cnn.com/data/fear-and-greed/
The Indicator oscillates between 0 and 100. They use seven other indicators to compile this one. It is all explained at the link given. The lower the reading, the higher the fear and the higher the number, the lower the fear among market participants. Theoretically, and I think the chart lends credence, when market conditions show extreme fear, like now, the closer we are to a bottom in equities.
NYSE is closed today for the Thanks Giving holidays. So there is no new data to analyse.
Next updated analysis will be tomorrow.
A very happy Thanks Giving to all our USA members.
Thanks! And to you as well! 🙂
Happy Thanksgiving Day to all.
Lara states that the triangle count may have seen Minor X of Intermediate B completed. Further she writes, “Confidence that a low is most likely in place would come if price breaks above the upper edge of the pink Elliott channel drawn about minor wave X.”
One smaller piece of confidence may come from the fact that price has broken out of the channel which defined the price movement of Minute c of Minor X. See the chart below. This is a small piece of evidence for the more bullish scenarios.
Happy Thanksgiving All.
Another bullish point i wanted to highlight that it seems RUT has traced out a clean 5 way up in daily from 26th Oct low and came back to retest the low yesterday in clean 3 wave down. Also had a very strong move up yesterday, could be the start of 3rd wave…
I am not sure but worth keeping an eye on, I am really curious to see how it works out.
Thanks Hash_trader. When the SPX count is uncertain, often other indices provide clarity. Lara stated yesterday that the SPX move off the recent low could be either a 3 wave pattern or 5 wave. The RUT, as you point out, is clearly a five wave pattern. I checked it on 5 minute and 1 minute along with MID (SPX mid cap) and SLY (SPX small cap). Each of then show a well defined 5 wave pattern up followed by some sort of corrective looking action. So that is one piece of evidence supporting the short term bullish counts in the SPX. Good catch.
Great chart, excellent point. Thanks Rodney!
Hi Lara
Thank you so much for your analysis and for providing a forum where so many of your members provide so many valuable insights. Both you and your members deserve a big thank you from investors like me.
Your recent optimism, appears to be based on the 10 year bull trend support, holding on during this wave 4 correction.
I am wondering if there are any rules that would be breached if for intra-day or even for a few closing days, this trend line was breached down to 2,550 or even 2,450 and then recovered to close weekly or monthly above the trend line?
If intra-day or even for a day or two the s&p can be and close below 2,600, then your views and Verne’s would not be inconsistent, would they?
Hope this is not a silly question.
Cheers from freezing Melbourne. Fernando
Thank you Fernando for the kind words.
If the S&P quickly dropped down to about 2,550 and reversed intra week, that would look okay. It would look like an overshoot on the weekly chart, a little larger than the one that ended cycle wave IV.
But 2,450… that’s a really big overshoot. I don’t think that would look right.
And I hear you on the freezing. NZ is getting it too right now.
Still, summer is on its way 🙂