Downwards movement remains above the invalidation point and within allowable limits.
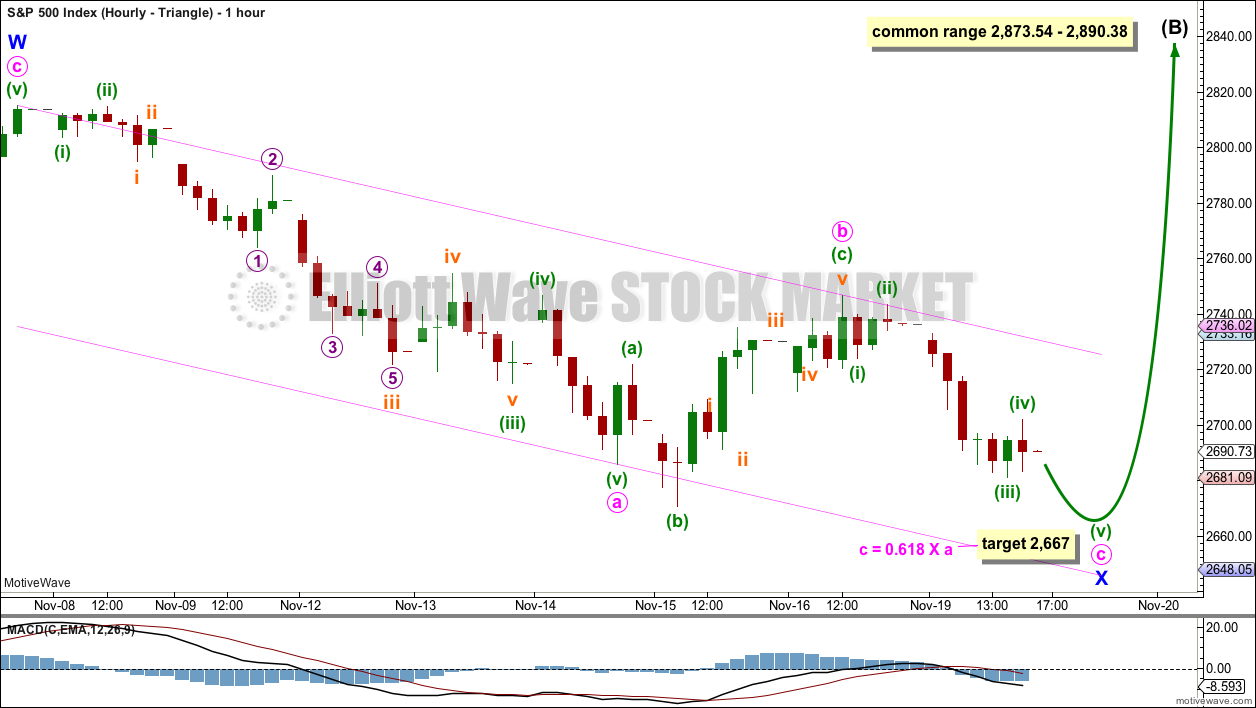
Summary: Short-term bearish divergence between price and the AD line supports an Elliott wave count which expects a slight new low before the bounce continues. A target for tomorrow is about 2,667.
Five daily charts today look at five different structures for primary wave 4, in order of probability (roughly): triangle, combination, zigzag, double zigzag, and flat.
Primary wave 4 could be over. The alternate wave count outlines this possibility.
New updates to this analysis are in bold.
The biggest picture, Grand Super Cycle analysis, is here.
Last published monthly chart is here, video is here.
ELLIOTT WAVE COUNT
WEEKLY CHART
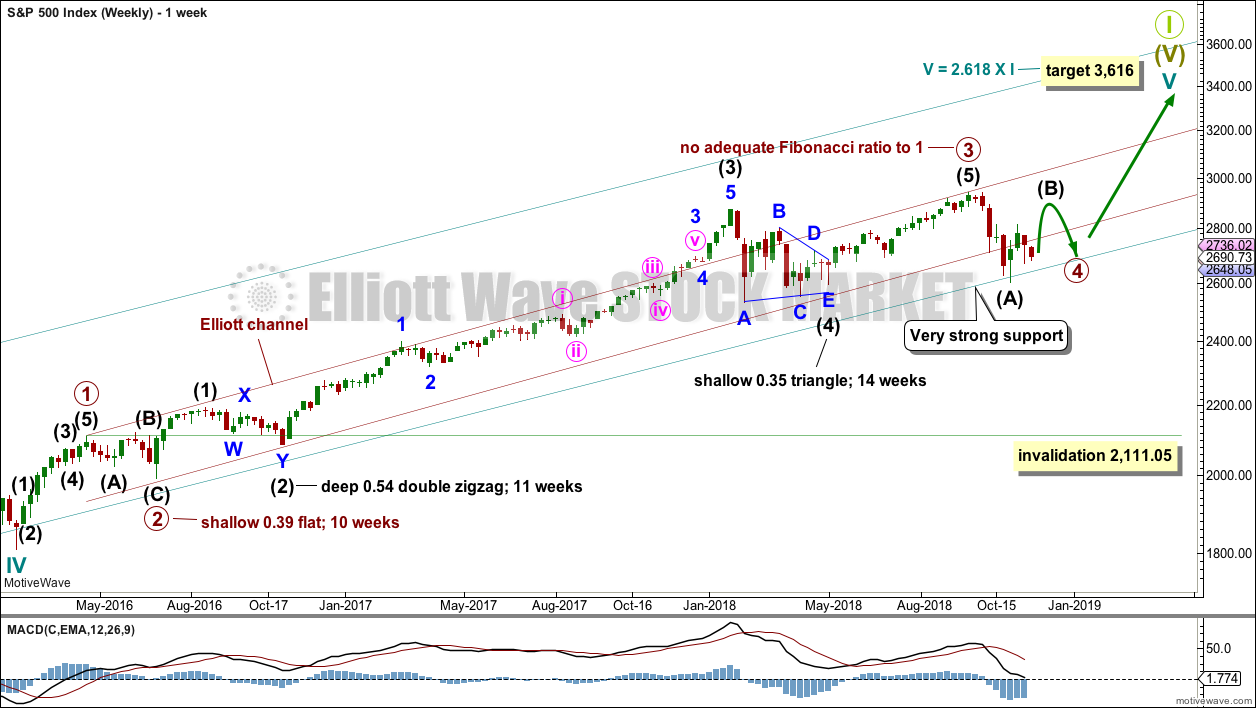
Cycle wave V must complete as a five structure, which should look clear at the weekly chart level and also now at the monthly chart level. It may only be an impulse or ending diagonal. It is clear it is an impulse.
Cycle wave V has passed equality in length with cycle wave I, and 1.618 the length of cycle wave I. The next Fibonacci ratio is used to calculate a target. When primary wave 4 is complete and the starting point for primary wave 5 is known, then the final target may also be calculated at primary degree. At that stage, there may be two targets, or the final target may widen to a small zone.
Within cycle wave V, the third waves at all degrees may only subdivide as impulses.
Within primary wave 3, there is perfect alternation and excellent proportion between intermediate waves (2) and (4).
The maroon channel is drawn about primary degree waves. The first trend line is drawn from the ends of primary waves 1 to 3, then a parallel copy is placed upon the low of primary wave 2. The overshoot of the upper edge of this channel by the end of intermediate wave (3) looks typical. For the S&P, its tghird waves are usually the strongest portion of an impulse; they often exhibit enough strength to overshoot channels.
Primary wave 4 now has an overshoot on the lower edge of the channel. This is acceptable; fourth waves are not always neatly contained within channels drawn using this technique.
Primary wave 4 may find very strong support about the lower edge of the teal channel, and it looks like this is from where price bounced on the 29th of October. This channel is copied over from the monthly chart and contains the entire bull market since its beginning in March 2009. While Super Cycle wave (V) is incomplete, this channel should not be breached at the weekly chart level.
Primary wave 4 may not move into primary wave 1 price territory below 2,111.05.
At this stage, the expectation is for the final target to be met in October 2019. If price gets up to this target and either the structure is incomplete or price keeps rising through it, then a new higher target would be calculated.
At this stage, the various possible structures for primary wave 4 will be published as separate daily charts, presented in order of probability.
DAILY CHART – TRIANGLE
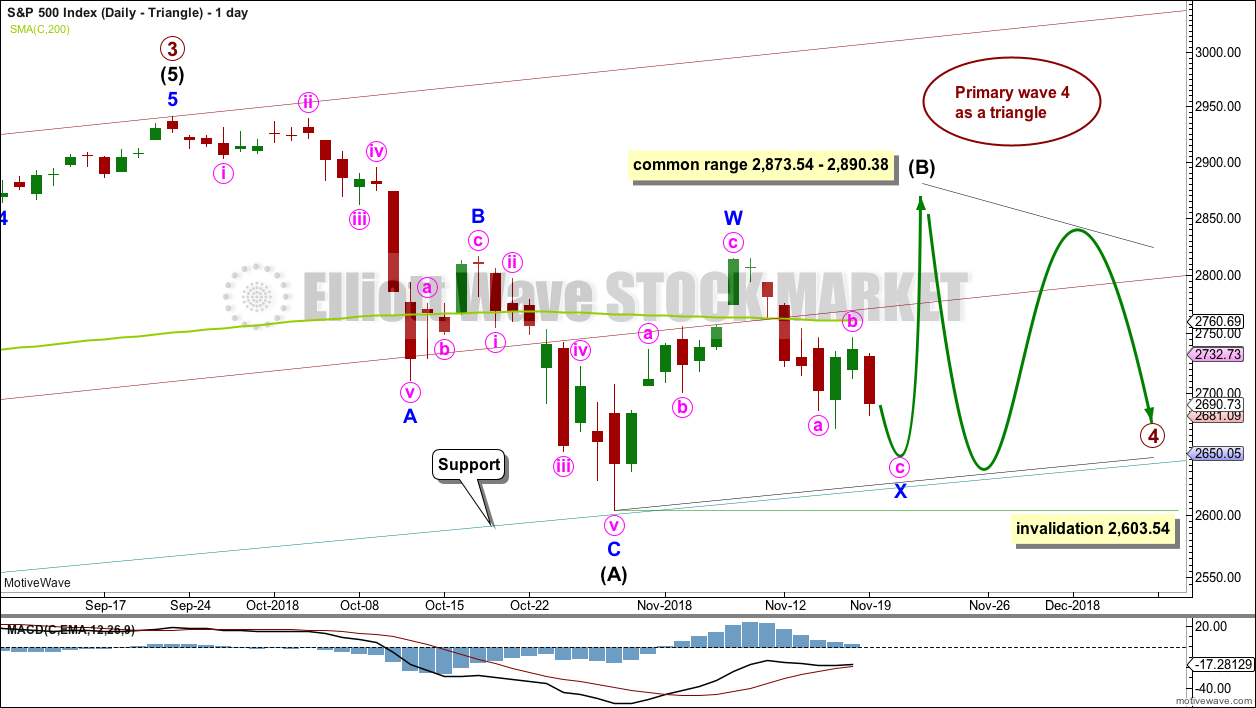
If primary wave 4 unfolds as a triangle, it would have perfect alternation with the regular flat correction of primary wave 2. It would also continue to find support about the lower edge of the teal trend channel. Triangles are fairly common structures for fourth waves. For these reasons this wave count may have a slightly higher probability than the other daily charts.
If primary wave 4 is unfolding as a triangle, then within it intermediate wave (B) would most likely be incomplete. To label intermediate wave (B) over at the last swing high is possible, but it would look too shallow for a normal looking Elliott wave triangle.
Triangle sub-waves are often about 0.8 to 0.85 the length of the prior wave. This gives a target range for intermediate wave (B).
One triangle sub-wave may subdivide as a multiple; this is most often wave C, but it may also be wave B. Intermediate wave (B) may be unfolding higher as a double zigzag. When minor wave X may again be complete, then a new target for intermediate wave (B) will again be calculated.
There is no upper invalidation point for this wave count. Intermediate wave (B) may make a new high above the start of intermediate wave (A) as in a running triangle. Intermediate wave (B) should exhibit clear weakness. If price does make a new high, then for this wave count it should come with weak volume and bearish divergence between price and one or both of RSI or Stochastics.
Within the triangle, intermediate wave (C) may not move beyond the end of intermediate wave (A) below 2,603.54.
HOURLY CHART – TRIANGLE
It looks like the zigzag for minor wave X may be moving lower. Within minor wave X, minute wave b is now labelled as an expanded flat correction.
A target is calculated for minute wave c to end. This would give a reasonably normal looking proportion between minute waves a and c. If the target is wrong, it may not be low enough. Minor wave X may end at support at the lower edge of the pink channel.
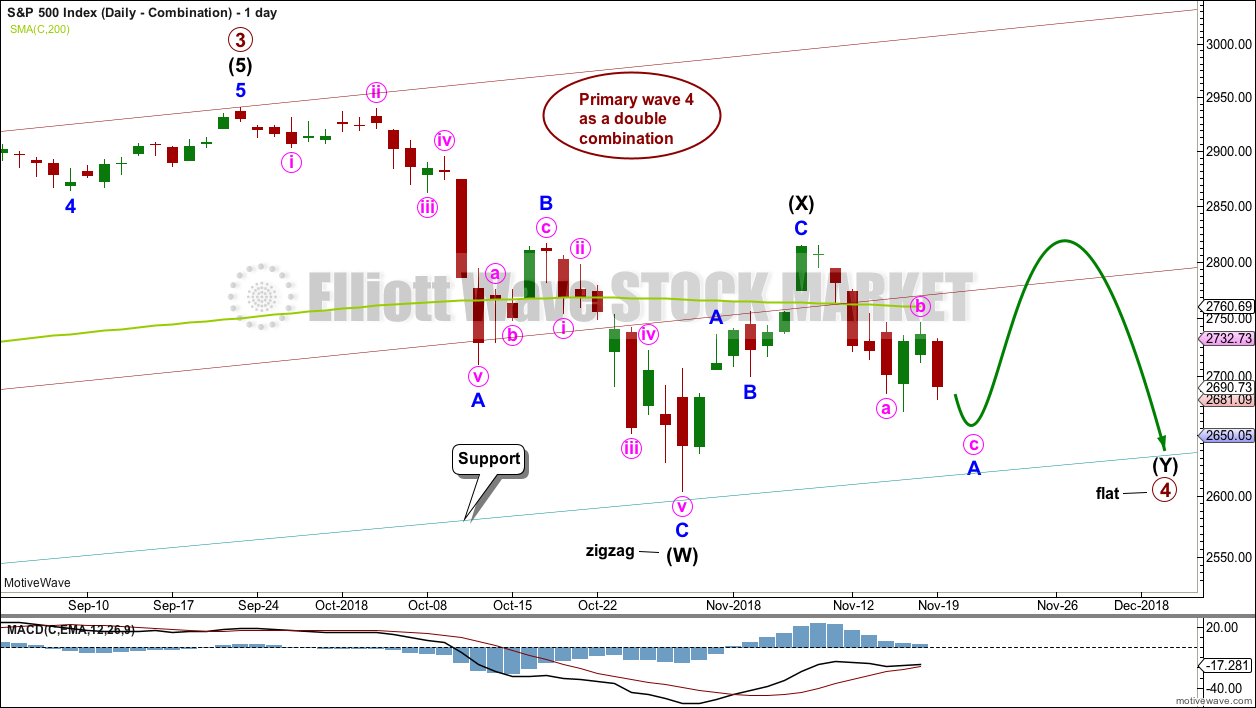
DAILY CHART – COMBINATION
This wave count is judged to have only a very slightly lower probability than the triangle.
Primary wave 4 may be unfolding as a double combination. The first structure in the double may be a complete zigzag labelled intermediate wave (W). The double may be joined by a three in the opposite direction labelled intermediate wave (X). Intermediate wave (X) may be complete as a single zigzag; it is deep at 0.63 the length of intermediate wave (W), which looks reasonable.
Intermediate wave (Y) would most likely be a flat correction, which should subdivide 3-3-5. At its end, it may still find strong support about the lower edge of the teal trend channel.
At the hourly chart level, minor wave A may be an incomplete zigzag, in exactly the same way as minor wave X on the hourly chart published above.
Within the flat correction of intermediate wave (Y), minor wave B must retrace a minimum 0.9 length of minor wave A. The common range for minor wave B is from 1 to 1.38 times the length of minor wave A. Minor wave B may make a new high above the start of minor wave A at 2,815.15 as in an expanded flat.
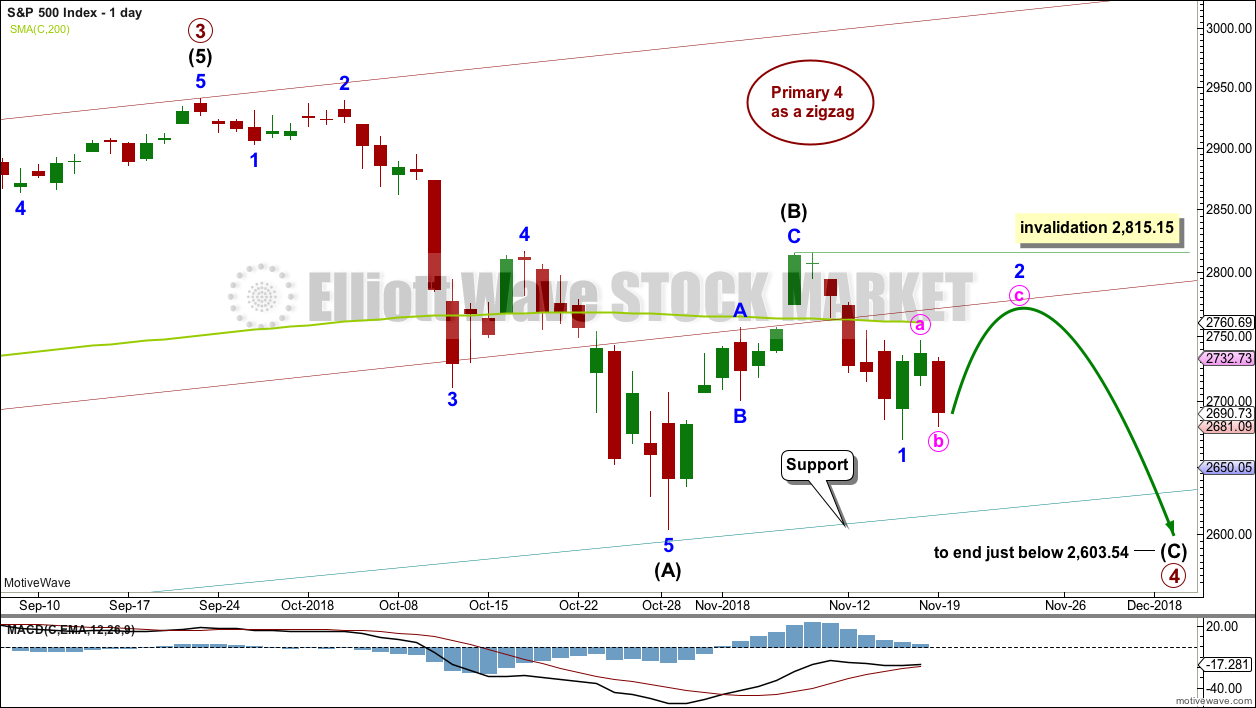
DAILY CHART – ZIGZAG
Primary wave 4 may be unfolding as a single zigzag, which is the most common type of corrective structure.
Within the zigzag, intermediate wave (B) may now be a complete structure, ending close to the 0.618 Fibonacci ratio of intermediate wave (A).
Intermediate wave (C) may now unfold lower as a five wave structure. Intermediate wave (C) would be very likely to end at least slightly below the end of intermediate wave (A) at 2,603.54 to avoid a truncation. It may end about support at 2,600.
This wave count would expect a fairly large overshoot of the teal trend channel. This reduces the probability of this wave count.
Within intermediate wave (C), minor wave 2 may not move beyond the start of minor wave 1 above 2,815.15.
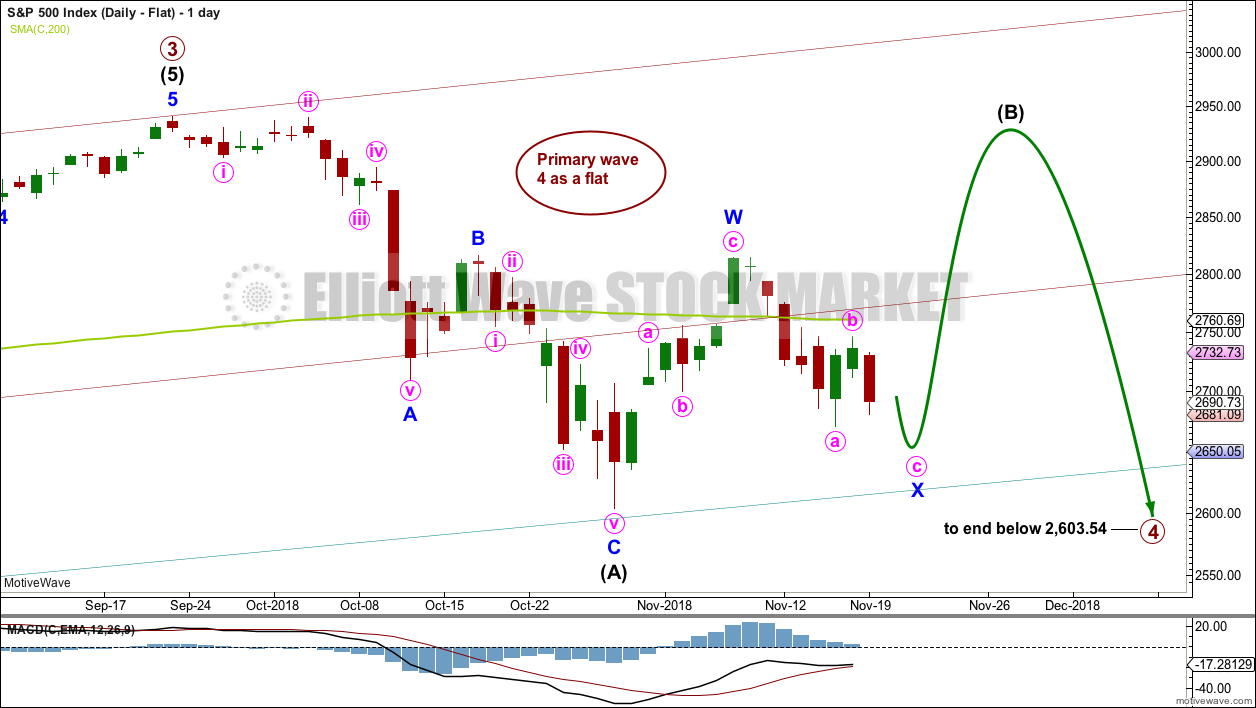
DAILY CHART – FLAT
Primary wave 2 was a regular flat correction. If primary wave 4 unfolds as a flat correction, then there would be no alternation in structure between the two corrections; for this reason, this wave count is judged to have a low probability.
However, alternation is a guideline, not a rule, and it is not always seen. This wave count is possible.
If primary wave 4 is a flat correction, then within it intermediate wave (B) must move higher to retrace a minimum 0.9 length of intermediate wave (A).
When intermediate wave (B) is complete, then intermediate wave (C) should move below the end of intermediate wave (A) at 2,603.54 to avoid a truncation. This would expect a reasonable overshoot of the teal trend line, which further reduces the probability of this wave count.
DAILY CHART – DOUBLE ZIGZAG
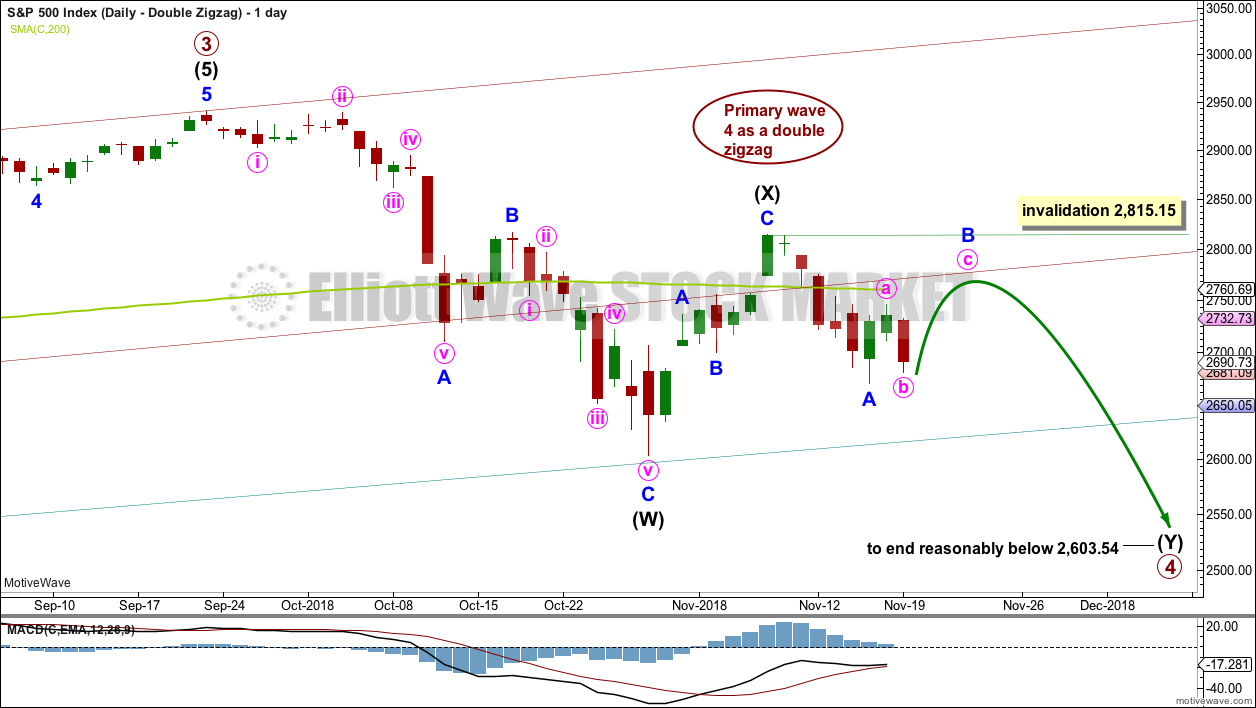
Primary wave 4 may also be unfolding as a double zigzag.
The first zigzag in the double may be complete, labelled intermediate wave (W). The double may joined by a complete three in the opposite direction, a zigzag labelled intermediate wave (X).
The second zigzag in the double may have begun. It is labelled intermediate wave (Y). Within intermediate wave (Y), minor wave B may not move beyond the start of minor wave A above 2,815.15.
The purpose of a second zigzag in a double is to deepen the correction when the first zigzag does not move price deep enough. To achieve this purpose intermediate wave (Y) should be expected to end reasonably below the end of intermediate wave (W) at 2,603.54. This would expect a very large overshoot of the teal trend channel; for this reason, this wave count is judged to have the lowest probability.
BULLISH ALTERNATE ELLIOTT WAVE COUNT
WEEKLY CHART
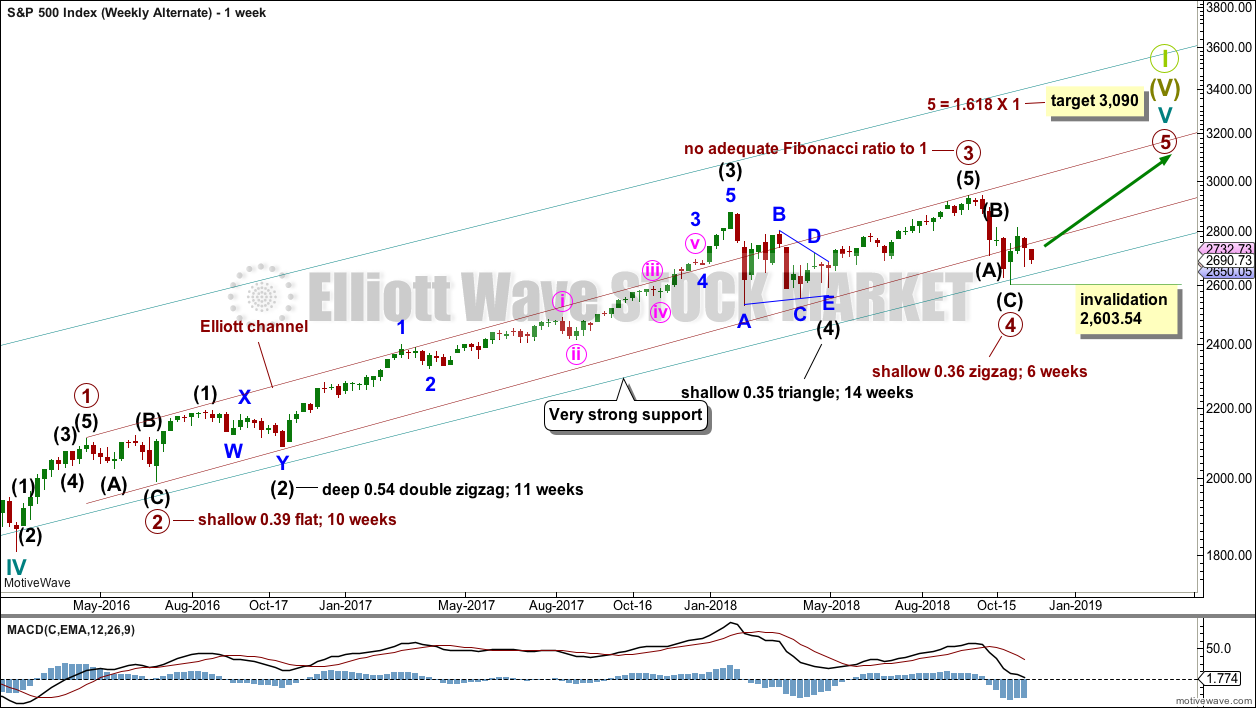
It is possible that primary wave 4 could be over as a relatively quick zigzag, ending about support at the lower edge of the teal channel.
The proportion between primary waves 2 and 4 is reasonable. Flat corrections tend to be longer lasting structures than zigzags. There would be perfect alternation in structure and inadequate alternation in depth. This is acceptable.
This wave count has the right look at the monthly chart level.
If primary wave 5 ends at or after the end of December 2018 and the AD line fails to make new all time highs, there would then be the minimum required four months of bearish divergence between price and the AD line. If this happens, then the conditions for the end of this bull market would be in place.
A new target is calculated for primary wave 5 to end. If primary wave 5 were to be only equal in length with primary wave 1, then it would be truncated. A truncated primary wave 5 would be unlikely as then there could be no bearish divergence with the AD line. The next Fibonacci ratio in the sequence is used to calculate a target for primary wave 5.
Within primary wave 5, no second wave correction may move beyond the start of its first wave below 2,603.54.
DAILY CHART
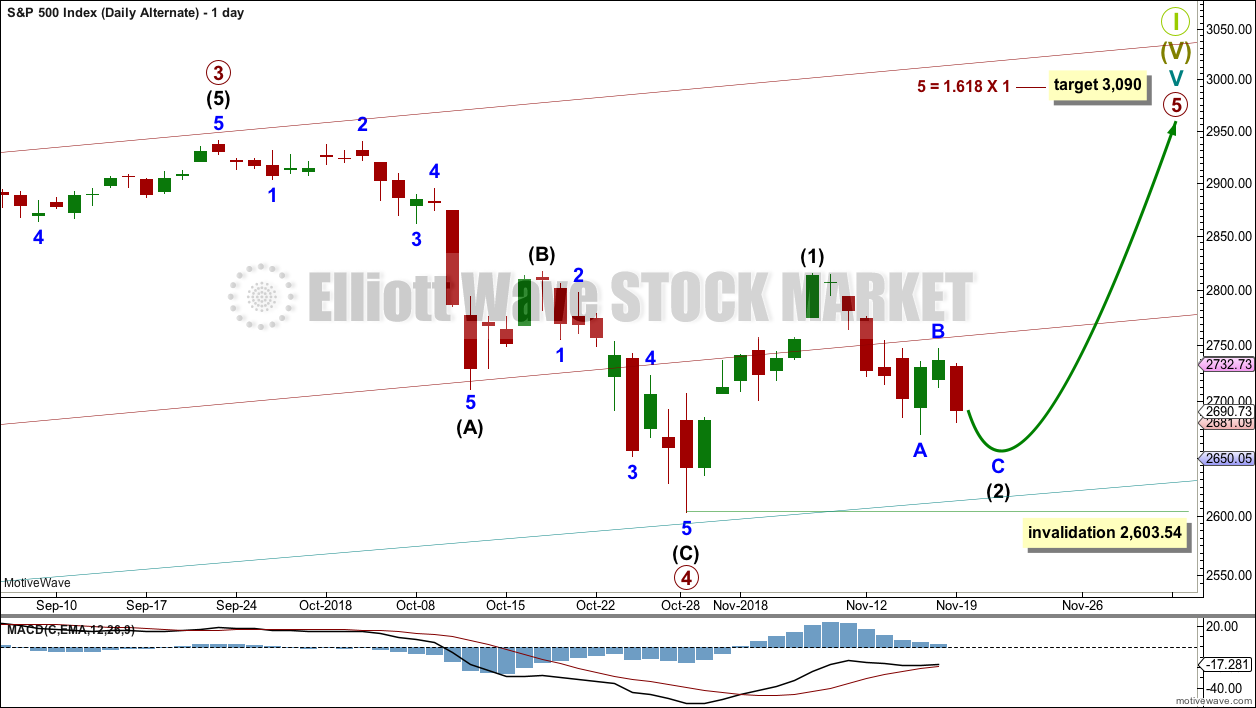
The subdivisions of primary wave 4 are seen in exactly the same way as most of the charts above except the degree of labelling is just moved up one degree.
Within primary wave 5, intermediate wave (1) may be over. Intermediate wave (2) may not move beyond the start of intermediate wave (1) below 2,603.54.
Primary wave 5 may subdivide either as an impulse (more likely) or an ending diagonal (less likely). Intermediate wave (1) may be seen as either a five wave impulse or a three wave zigzag at lower time frames, and so at this stage primary wave 5 could be either an impulse or a diagonal.
Primary wave 5 at its end may be expected to exhibit reasonable weakness. At its end, it should exhibit a minimum of 4 months bearish divergence with the AD line, it may exhibit bearish divergence between price and RSI and Stochastics, and it may lack support from volume; it may not be possible to distinguish a weak fifth wave from a B wave.
TECHNICAL ANALYSIS
WEEKLY CHART
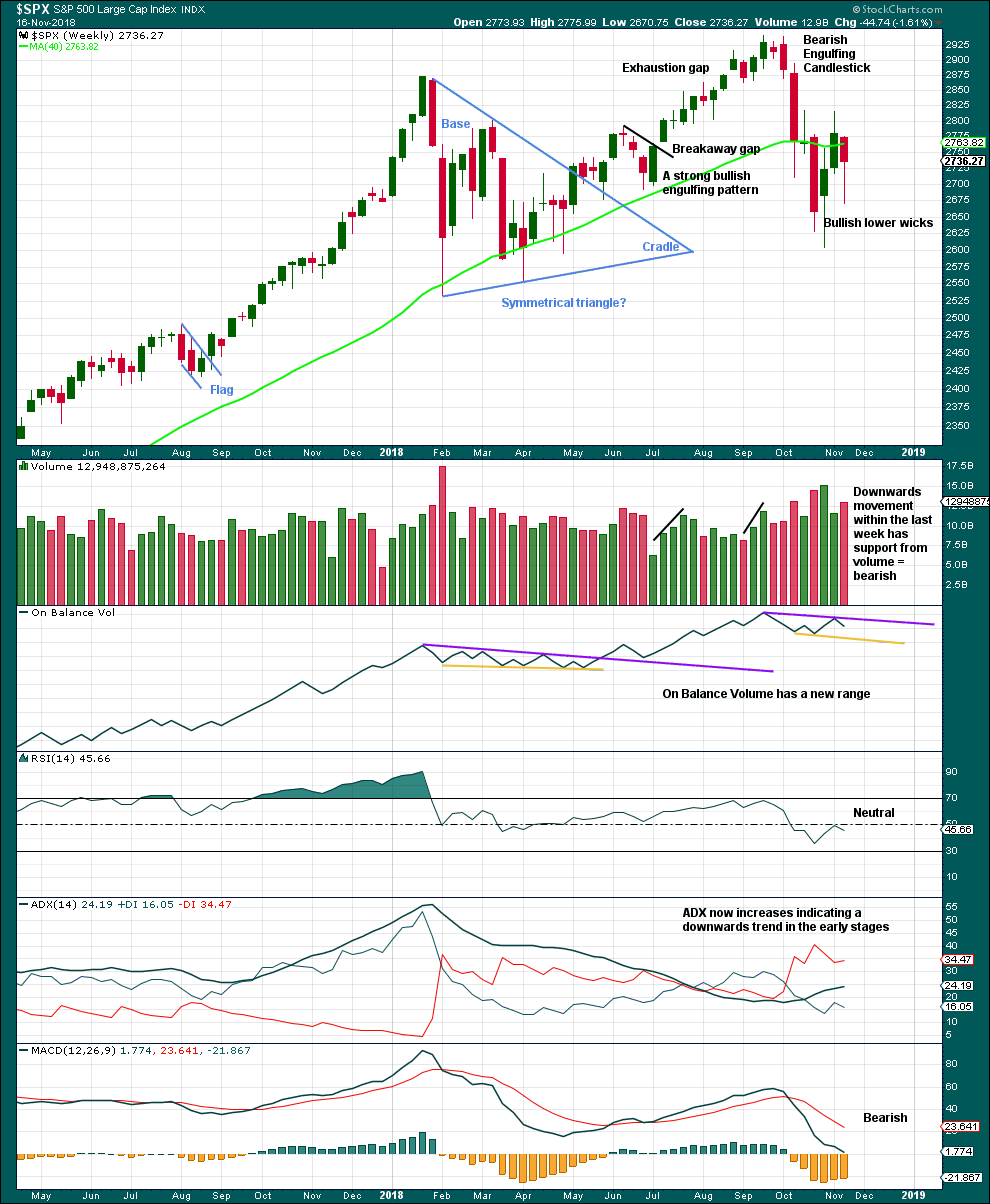
Click chart to enlarge. Chart courtesy of et=”_blank”>StockCharts.com.
Another long lower wick last week is fairly bullish. An upwards week this week looks most likely.
DAILY CHART
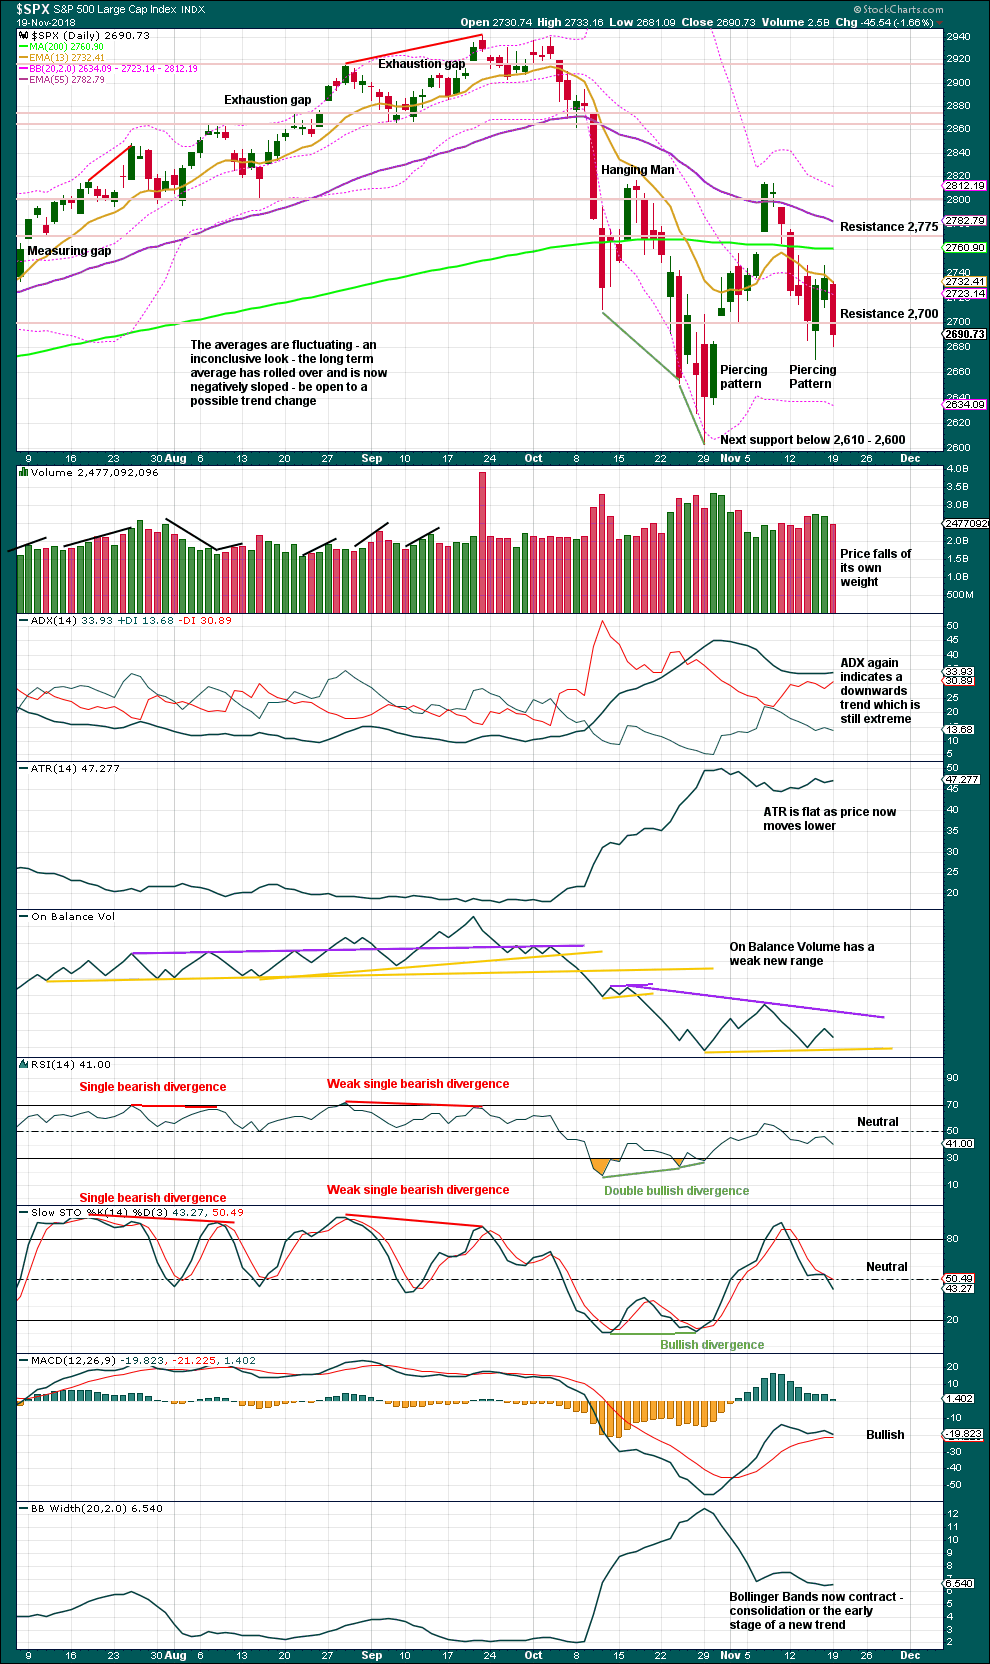
Click chart to enlarge. Chart courtesy of StockCharts.com.
With support about 2,700 broken today, look for next support about 2,610 – 2,600. A lack of volume today for downwards movement and a slightly long lower wick suggests downwards movement may be limited here.
BREADTH – AD LINE
WEEKLY CHART
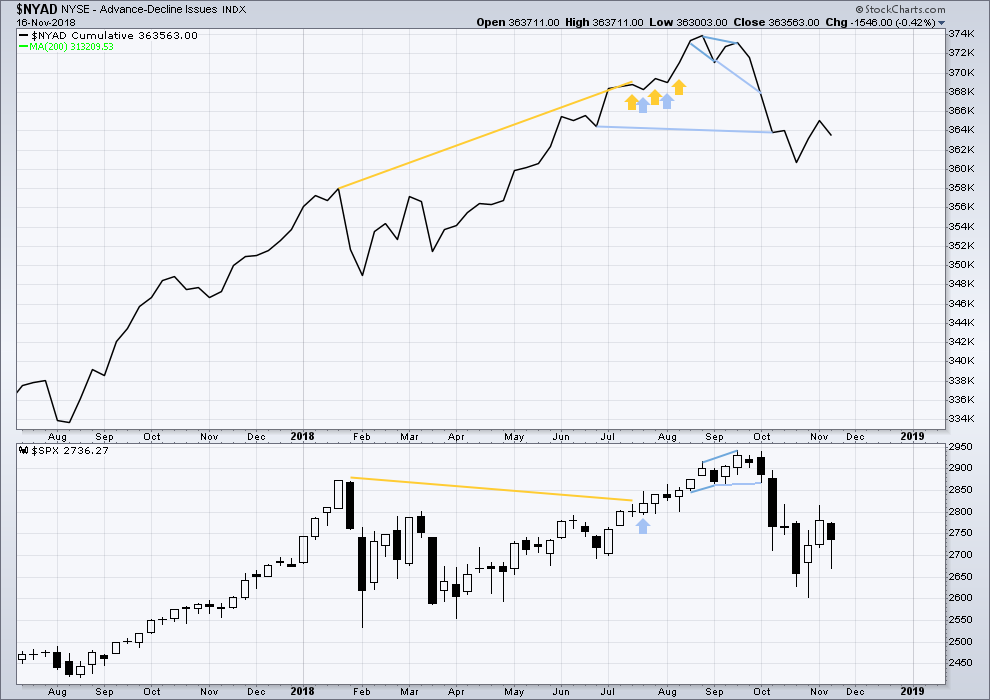
Click chart to enlarge. Chart courtesy of StockCharts.com. So that colour blind members are included, bearish signals
will be noted with blue and bullish signals with yellow.
Last week both price and the AD line have moved lower. There is no new divergence.
DAILY CHART
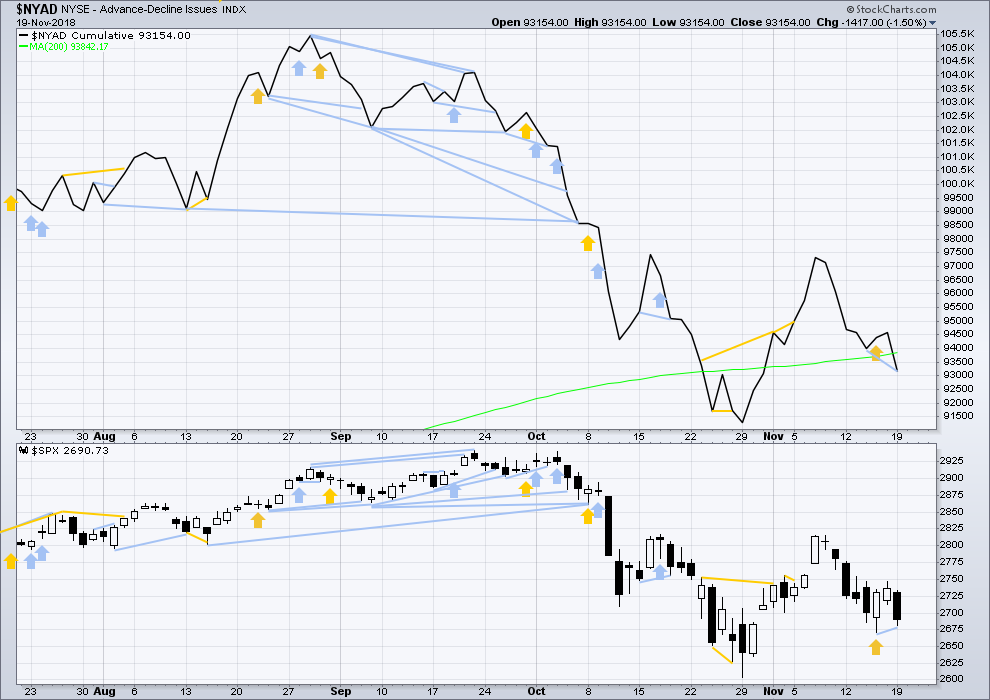
Click chart to enlarge. Chart courtesy of StockCharts.com. So that colour blind members are included, bearish signals
will be noted with blue and bullish signals with yellow.
There is normally 4-6 months divergence between price and market breadth prior to a full fledged bear market. This has been so for all major bear markets within the last 90 odd years. With no longer term divergence yet at this point, any decline in price should be expected to be a pullback within an ongoing bull market and not necessarily the start of a bear market. New all time highs from the AD line on the 29th of August means that the beginning of any bear market may be at the end of December 2018, but it may of course be a lot longer than that. My next expectation for the end of this bull market may now be October 2019.
Breadth should be read as a leading indicator.
Today the AD line has made a new short term swing low, but price has not. Market breadth is falling faster than price today. This divergence is bearish for the short term and supports the hourly Elliott wave count.
VOLATILITY – INVERTED VIX CHART
WEEKLY CHART
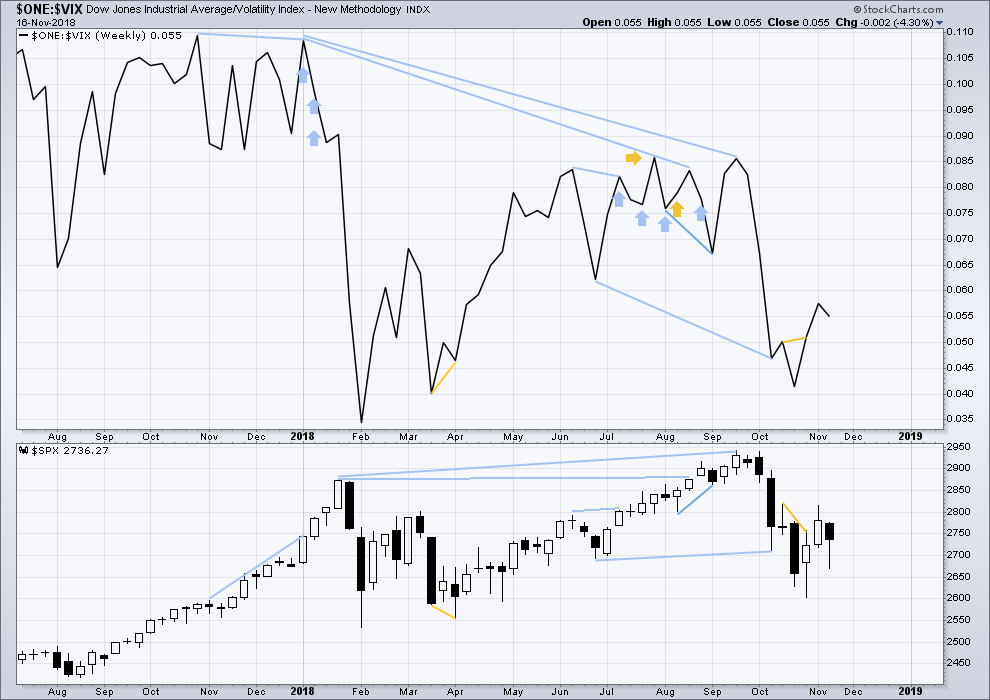
Click chart to enlarge. Chart courtesy of StockCharts.com. So that colour blind members are included, bearish signals
will be noted with blue and bullish signals with yellow.
Last week both price and inverted VIX have moved lower. There is no new divergence.
DAILY CHART
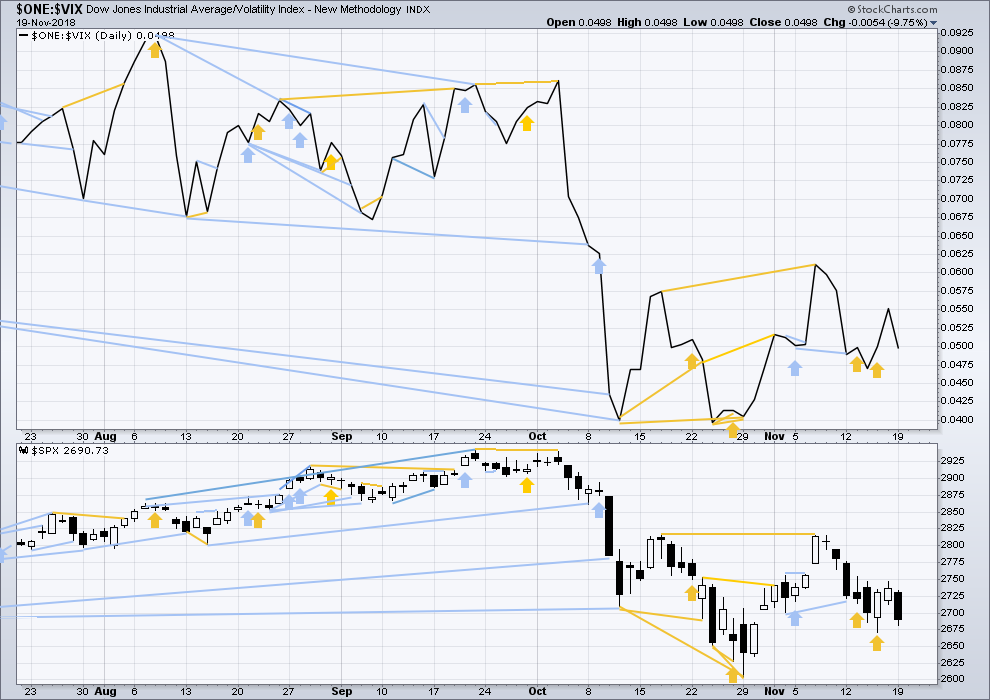
Click chart to enlarge. Chart courtesy of StockCharts.com. So that colour blind members are included, bearish signals
will be noted with blue and bullish signals with yellow.
Normally, volatility should decline as price moves higher and increase as price moves lower. This means that normally inverted VIX should move in the same direction as price.
On Monday both price and inverted VIX have moved lower. There is no new divergence.
DOW THEORY
The following lows need to be exceeded for Dow Theory to confirm the end of the bull market and a change to a bear market:
DJIA: 23,344.52.
DJT: 9,806.79.
S&P500: 2,532.69.
Nasdaq: 6,630.67.
Published @ 06:43 p.m. EST.
—
Careful risk management protects your trading account(s).
Follow my two Golden Rules:
1. Always trade with stops.
2. Risk only 1-5% of equity on any one trade.

A not so good sign.
A few exchanges are starting seize up, with delayed bids and executions.
Please be careful out there.
We have yet to see the margin call dump on the impulsive decline below the critical pivots. Remember brokerage products are NOT FDIC insured.
Do not keep positions open overnight that you cannot afford to loose.
I know that sounds dramatic but I am deadly serious…!
Reasonable concerns.
That said, I think we are quite a ways from the meltdown of the financial system. As in, wait until the end of the GSC. THEN…yes indeed! But here? I don’t think so. Could always be wrong! And in case I am…my overall positions represents only about 5% of my trading account at this moment. This is a time to get/be small, not large, that I agree with tremendously.
Google double bottom?
Hourly chart updated with an updated target
reminds me of an old Neil Young song, “Down, and down, and down, we go…”
We haven’t quite had panic selling yet. It may be coming soon though.
AMAT has come down from 62 to 32 and has turned at the 61.8% and today is actually showing strength. I’ve sold puts just underneath.
Wow is oil crushed.
Oil and Bitcoin…
I also like PANW…though it does have earnings in about 7 days.
Down from 240 to 160, now at 167. Tagged the 61.8% at 158. Only reasonable way to trade it give the crazy skew and cost of options is to sell puts. I used Mar 160’s.
One of the few large caps that has been and is “steady on” at the weekly TF is UNH. Weekly trend right now is neutral, and in the 2nd week of selling off inside the shadow of a very large up bar 3 weeks ago. Bull call spread 260/270 Mar for me here.
I also note that RUT has now double bottomed.
One might argue that SPX has also double bottomed just 30 points or so shy. The breakout above 2814 SPX will be the confirmation. If confirmed, a big if, then the classic TA target is above 3000.
V has double bottomed off overlapped 100% and 61.8% fibos at 129.5. And bounced hard back up today.
I have NDX current turned at a low at a 78.6% and swing low support from back on April 25th.
On the 5 minute chart for SPX, from yesterday’s high, we have five waves down which could complete minuette (v), or minute c, of Minor X.
We are rolling a monster 10X pivot trade on SPY 270 puts to 260 strikes one week out…..looking for “Volocaust II”…
Have wonderful Thanksgiving everyone!
Strap in! 🙂
Looks like this could be a full blown wave 3
Looks to me like the momentum algos have shifted to the downside… selling every bounce.
Mine went long at yesterday’s close and stopped out
Although, right now is starting to feel like a capitulation. I think it’s time to figure out an entry point. Thoughts on if 2650 by the end of day will hold?
Did bounce off of 2632.
Too early…!
You’re right… hear comes the flush!
2 hours before a major holiday getaway for the big buck folks!
What if Lara’s 2617 above does not hold?
Still no fear. Look for a break of the Feb lows before venturing in imho…
is that the cash market because futures went down to 2650?
Mkt opens at Lara’s tgt. My fibo view…
mkt bounce and hold for the moment of the 78.6% at 2648.6. Likely to get tested…at the very least.
2631 a 1.27% extension is next. If through that (likely?) then down to 2603, where minute a = minute c, and a double bottom may be formed.
Well well well, market has turned for the moment at 2632.5, just a tad above that 1.27% extension that I have at 2631.5. Is the blood bath over? I don’t know. After this kind of route, I think a solid double bottom would be much more “stable” and properly concluding.
No “stability” until we take out the Feb lows imho…
Hi Joe.
I sure wish you had e-mailed me last week. I guess you missed my post.
Market stays around here and we will likely see this right at open:
“A target for tomorrow is about 2,667.”
Look at the big picture.
Think H&S….
Very surprising so few are seeing this….
Everyone seen it. All I’ve seen over FinTwit for a week now.
I don’t tweet, and do not watch television…not usually good places for trading intel….
Don’t have cable, don’t tweet, but do follow bunches to get a feel where people are at. This morning, it feels very panicky out there.
Verne, Are you seeing an inverse H&S or something else?
If an inverse H&S, I agree with jmdrew in that it has been all over the news both internet and TV. I mentioned it last week, but with such widespread attention, I was beginning to think it was not going to pan out. With today’s opening plunge, I think it wrecks the pattern.
Both, actually. Picture is from noon, yesterday. (and neither had confirmed at that time).
I actually thought it was a regular H&S Rodney, and pointing to much more downside. We loaded our biggest position this year last Friday in anticipation of a third down. I wanted to send Joe our trades to ensure he ended the year in the black! 😉
Damn. Where can I apply to this list. lol
I see that now. The only thing is that a H&S should come at the end of an upwards move. This H&S is the upwards move. In any event, if the H&S you propose is correct, we are looking at a target of roughly 2530.
Yep! 🙂
We plan to exit at 2550….
I can’t find any H&S top in the SPX. Not one that is legitimate in my book.
I sure can see an ABC structured P4 in process though, with C going to far lower prices soon. But I recognize that’s only one of several possibilities here. Correction madness!!
Lara’s target for a low is where minute c down is 0.618 the length of minute a down.
It’s interesting to note that if minute c down is 1.0 the length of minute a down…the bottom is exactly at the intermediate A bottom at 2603. Fractal market magic. Can awareness of such likely ratios help refine identification of the minute b high? I.e, back when minute b was rising, “what swing high price will cause a minute c back down to land exactly at the I4 low and form a double bottom? Maybe that’s a good spot to look for a turn…”. Gotta add this to my toolbox…
Bingo!
Bango!
Ba-da Bing, Ba-da Boom!!! 😀