To end the week, upwards movement has continued as expected.
Summary: A low looks to be in place at least for the short to mid term. A target for the next wave up is now 2,882 or 3,013 (alternate wave count).
Five daily charts today look at five different structures for primary wave 4, in order of probability (roughly): triangle, combination, zigzag, double zigzag, and flat.
Primary wave 4 could be over. The alternate wave count outlines this possibility.
New updates to this analysis are in bold.
The biggest picture, Grand Super Cycle analysis, is here.
Last published monthly chart is here, video is here.
ELLIOTT WAVE COUNT
WEEKLY CHART
Cycle wave V must complete as a five structure, which should look clear at the weekly chart level and also now at the monthly chart level. It may only be an impulse or ending diagonal. It is clear it is an impulse.
Cycle wave V has passed equality in length with cycle wave I, and 1.618 the length of cycle wave I. The next Fibonacci ratio is used to calculate a target. When primary wave 4 is complete and the starting point for primary wave 5 is known, then the final target may also be calculated at primary degree. At that stage, there may be two targets, or the final target may widen to a small zone.
Within cycle wave V, the third waves at all degrees may only subdivide as impulses.
Within primary wave 3, there is perfect alternation and excellent proportion between intermediate waves (2) and (4).
The maroon channel is drawn about primary degree waves. The first trend line is drawn from the ends of primary waves 1 to 3, then a parallel copy is placed upon the low of primary wave 2. The overshoot of the upper edge of this channel by the end of intermediate wave (3) looks typical. For the S&P, its tghird waves are usually the strongest portion of an impulse; they often exhibit enough strength to overshoot channels.
Primary wave 4 now has an overshoot on the lower edge of the channel. This is acceptable; fourth waves are not always neatly contained within channels drawn using this technique.
Primary wave 4 may find very strong support about the lower edge of the teal channel, and it looks like this is from where price bounced on the 29th of October. This channel is copied over from the monthly chart and contains the entire bull market since its beginning in March 2009. While Super Cycle wave (V) is incomplete, this channel should not be breached at the weekly chart level.
Primary wave 4 may not move into primary wave 1 price territory below 2,111.05.
At this stage, the expectation is for the final target to be met in October 2019. If price gets up to this target and either the structure is incomplete or price keeps rising through it, then a new higher target would be calculated.
At this stage, the various possible structures for primary wave 4 will be published as separate daily charts, presented in order of probability.
DAILY CHART – TRIANGLE
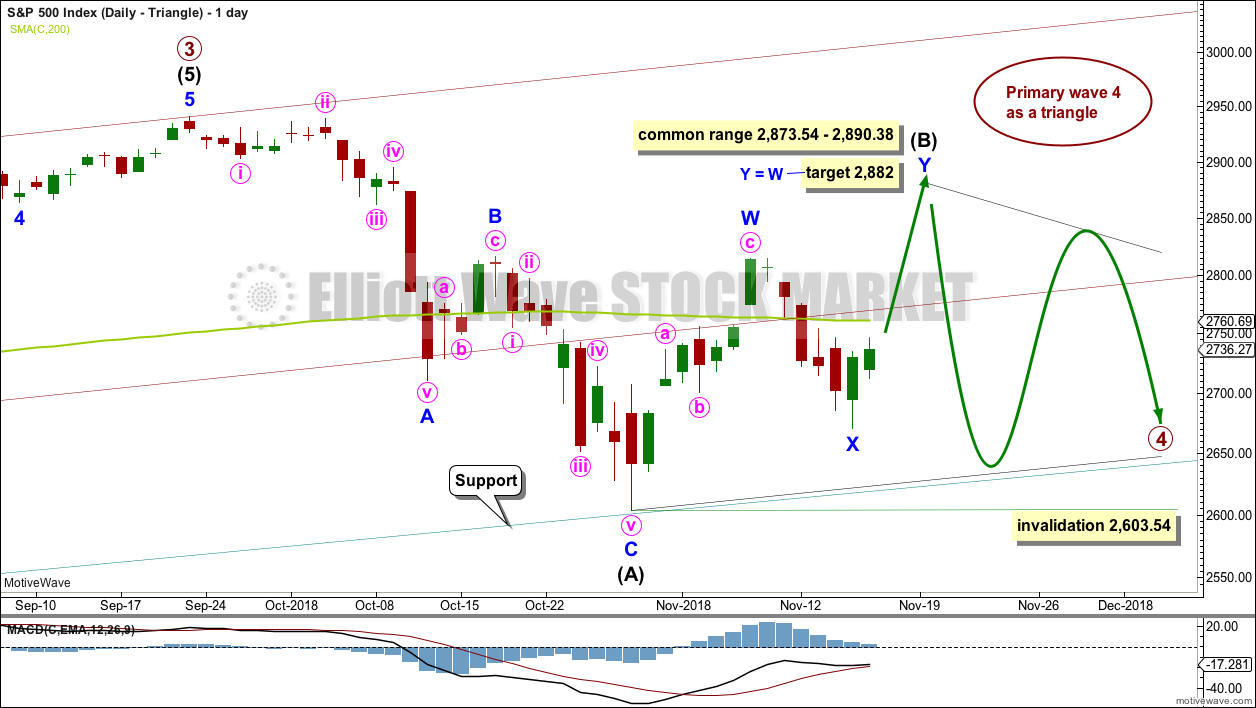
If primary wave 4 unfolds as a triangle, it would have perfect alternation with the regular flat correction of primary wave 2. It would also continue to find support about the lower edge of the teal trend channel. Triangles are fairly common structures for fourth waves. For these reasons this wave count may have a slightly higher probability than the other daily charts.
If primary wave 4 is unfolding as a triangle, then within it intermediate wave (B) would most likely be incomplete. To label intermediate wave (B) over at the last swing high is possible, but it would look too shallow for a normal looking Elliott wave triangle.
Triangle sub-waves are often about 0.8 to 0.85 the length of the prior wave. This gives a target range for intermediate wave (B).
One triangle sub-wave may subdivide as a multiple; this is most often wave C, but it may also be wave B. Intermediate wave (B) may be unfolding higher as a double zigzag. A target is calculated for intermediate wave (B) to end.
There is no upper invalidation point for this wave count. Intermediate wave (B) may make a new high above the start of intermediate wave (A) as in a running triangle. Intermediate wave (B) should exhibit clear weakness. If price does make a new high, then for this wave count it should come with weak volume and bearish divergence between price and one or both of RSI or Stochastics.
Within the triangle, intermediate wave (C) may not move beyond the end of intermediate wave (A) below 2,603.54.
HOURLY CHART – TRIANGLE
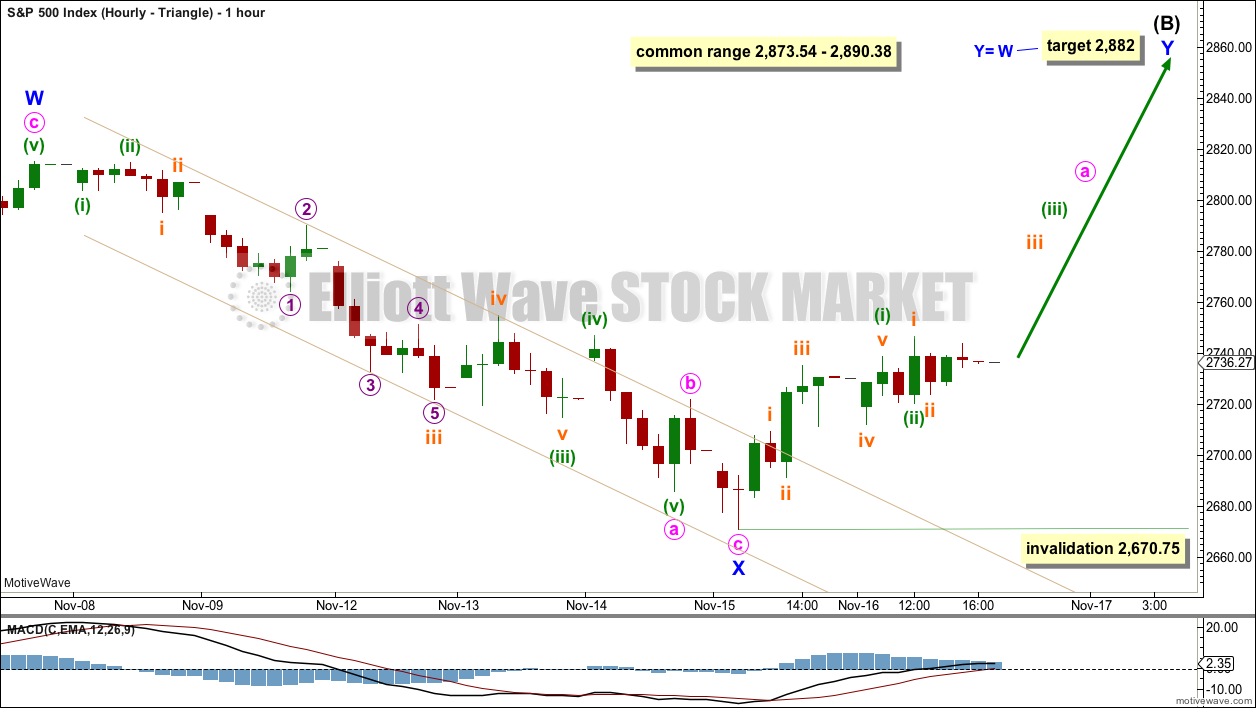
Now that the narrow best fit channel about minor wave X is breached by clearly upwards movement, it looks like minor wave X should be over and minor wave Y should be underway.
Minor wave Y should subdivide as a zigzag. Within minor wave Y, minute wave a would be incomplete. Minute wave a must subdivide as a five wave structure. Within minute wave a, minuette wave (ii) may not move beyond the start of minuette wave (i) below 2,670.75.
There may now be two first and second waves complete. This wave count now expects to see an increase in upwards momentum next week.
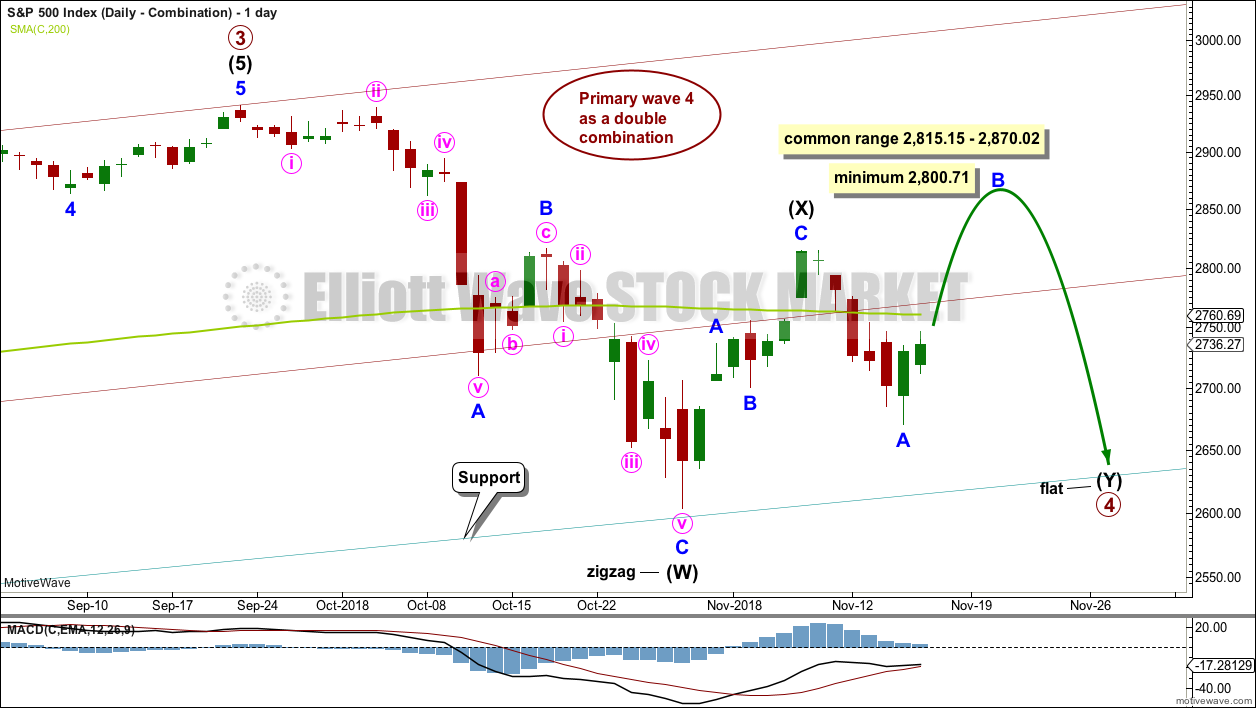
DAILY CHART – COMBINATION
This wave count is judged to have only a very slightly lower probability than the triangle.
Primary wave 4 may be unfolding as a double combination. The first structure in the double may be a complete zigzag labelled intermediate wave (W). The double may be joined by a three in the opposite direction labelled intermediate wave (X). Intermediate wave (X) may be complete as a single zigzag; it is deep at 0.63 the length of intermediate wave (W), which looks reasonable.
Intermediate wave (Y) would most likely be a flat correction, which should subdivide 3-3-5. At its end, it may still find strong support about the lower edge of the teal trend channel.
At the hourly chart level, minor wave A may be a complete zigzag, in exactly the same way as minor wave X on the hourly chart published above.
Within the flat correction of intermediate wave (Y), minor wave B must retrace a minimum 0.9 length of minor wave A. The common range for minor wave B is from 1 to 1.38 times the length of minor wave A. Minor wave B may make a new high above the start of minor wave A at 2,815.15 as in an expanded flat.
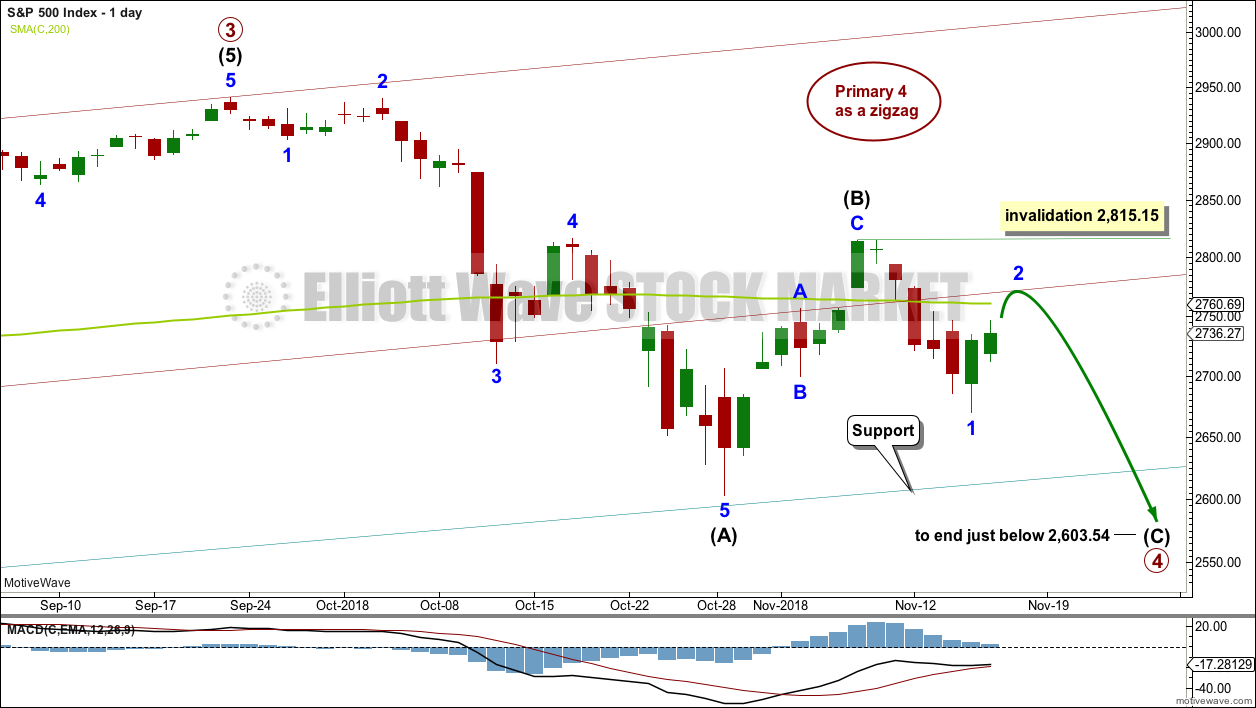
DAILY CHART – ZIGZAG
Primary wave 4 may be unfolding as a single zigzag, which is the most common type of corrective structure.
Within the zigzag, intermediate wave (B) may now be a complete structure, ending close to the 0.618 Fibonacci ratio of intermediate wave (A).
Intermediate wave (C) may now unfold lower as a five wave structure. Intermediate wave (C) would be very likely to end at least slightly below the end of intermediate wave (A) at 2,603.54 to avoid a truncation. It may end about support at 2,600.
This wave count would expect a fairly large overshoot of the teal trend channel. This reduces the probability of this wave count.
Within intermediate wave (C), minor wave 2 may not move beyond the start of minor wave 1 above 2,815.15.
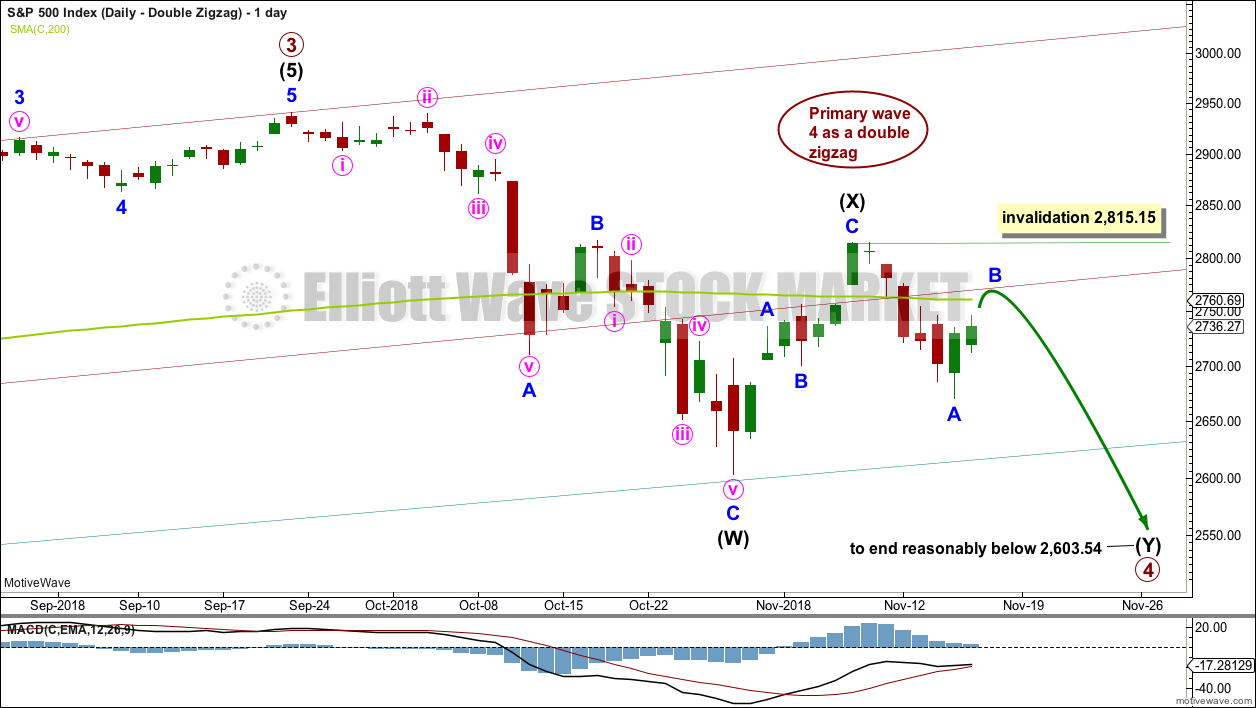
DAILY CHART – DOUBLE ZIGZAG
Primary wave 4 may also be unfolding as a double zigzag.
The first zigzag in the double may be complete, labelled intermediate wave (W). The double may joined by a complete three in the opposite direction, a zigzag labelled intermediate wave (X).
The second zigzag in the double may have begun. It is labelled intermediate wave (Y). Within intermediate wave (Y), minor wave B may not move beyond the start of minor wave A above 2,815.15.
The purpose of a second zigzag in a double is to deepen the correction when the first zigzag does not move price deep enough. To achieve this purpose intermediate wave (Y) should be expected to end reasonably below the end of intermediate wave (W) at 2,603.54. This would expect a very large overshoot of the teal trend channel; for this reason, this wave count is judged to have the lowest probability.
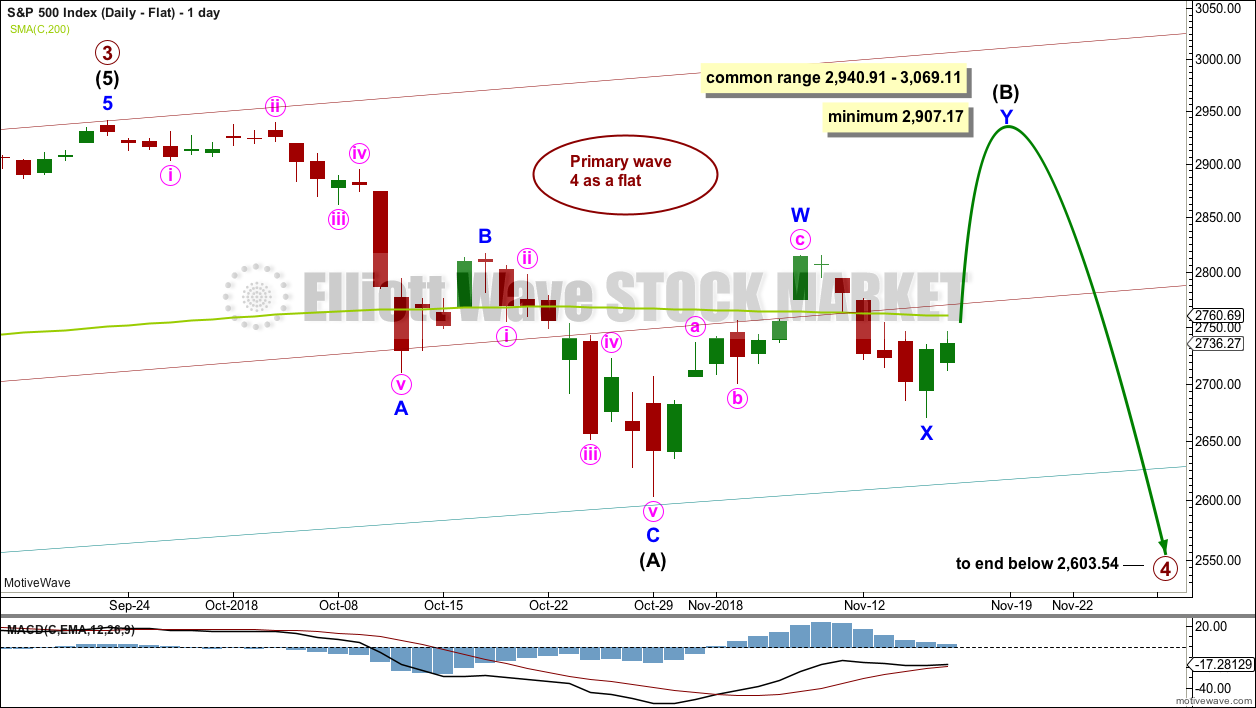
DAILY CHART – FLAT
Primary wave 2 was a regular flat correction. If primary wave 4 unfolds as a flat correction, then there would be no alternation in structure between the two corrections; for this reason, this wave count is judged to have a low probability.
However, alternation is a guideline, not a rule, and it is not always seen. This wave count is possible.
If primary wave 4 is a flat correction, then within it intermediate wave (B) must move higher to retrace a minimum 0.9 length of intermediate wave (A).
When intermediate wave (B) is complete, then intermediate wave (C) should move below the end of intermediate wave (A) at 2,603.54 to avoid a truncation. This would expect a reasonable overshoot of the teal trend line, which further reduces the probability of this wave count.
BULLISH ALTERNATE ELLIOTT WAVE COUNT
WEEKLY CHART
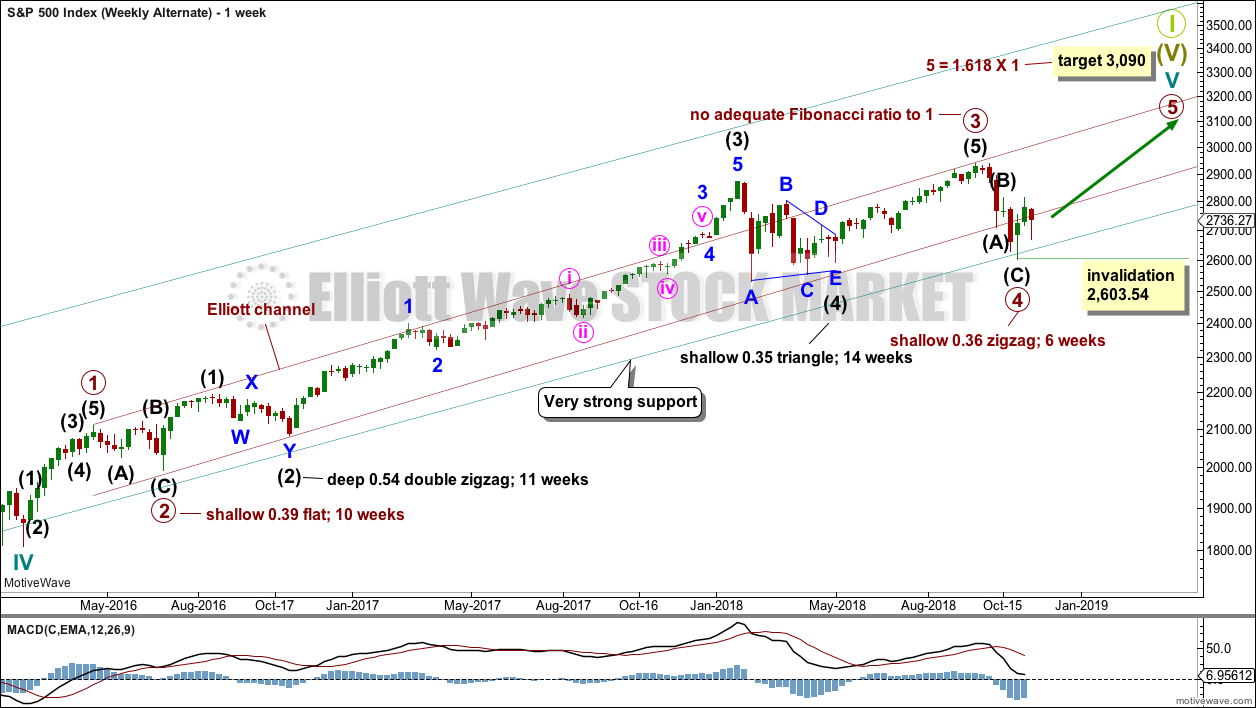
It is possible that primary wave 4 could be over as a relatively quick zigzag, ending about support at the lower edge of the teal channel.
The proportion between primary waves 2 and 4 is reasonable. Flat corrections tend to be longer lasting structures than zigzags. There would be perfect alternation in structure and inadequate alternation in depth. This is acceptable.
This wave count has the right look at the monthly chart level.
If primary wave 5 ends at or after the end of December 2018 and the AD line fails to make new all time highs, there would then be the minimum required four months of bearish divergence between price and the AD line. If this happens, then the conditions for the end of this bull market would be in place.
A new target is calculated for primary wave 5 to end. If primary wave 5 were to be only equal in length with primary wave 1, then it would be truncated. A truncated primary wave 5 would be unlikely as then there could be no bearish divergence with the AD line. The next Fibonacci ratio in the sequence is used to calculate a target for primary wave 5.
Within primary wave 5, no second wave correction may move beyond the start of its first wave below 2,603.54.
DAILY CHART
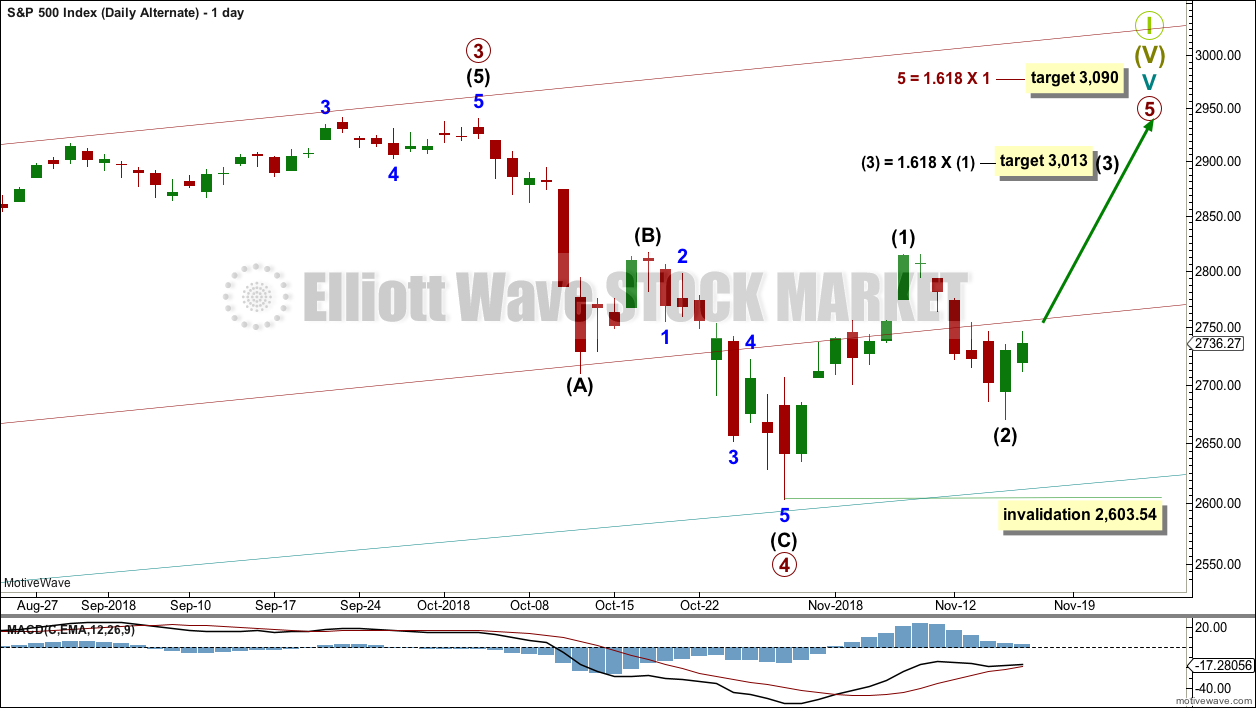
The subdivisions of primary wave 4 are seen in exactly the same way as most of the charts above except the degree of labelling is just moved up one degree.
Within primary wave 5, intermediate wave (1) may be over. Intermediate wave (2) may not move beyond the start of intermediate wave (1) below 2,603.54.
Primary wave 5 may subdivide either as an impulse (more likely) or an ending diagonal (less likely). Intermediate wave (1) may be seen as either a five wave impulse or a three wave zigzag at lower time frames, and so at this stage primary wave 5 could be either an impulse or a diagonal.
Primary wave 5 at its end may be expected to exhibit reasonable weakness. At its end, it should exhibit a minimum of 4 months bearish divergence with the AD line, it may exhibit bearish divergence between price and RSI and Stochastics, and it may lack support from volume; it may not be possible to distinguish a weak fifth wave from a B wave.
TECHNICAL ANALYSIS
WEEKLY CHART
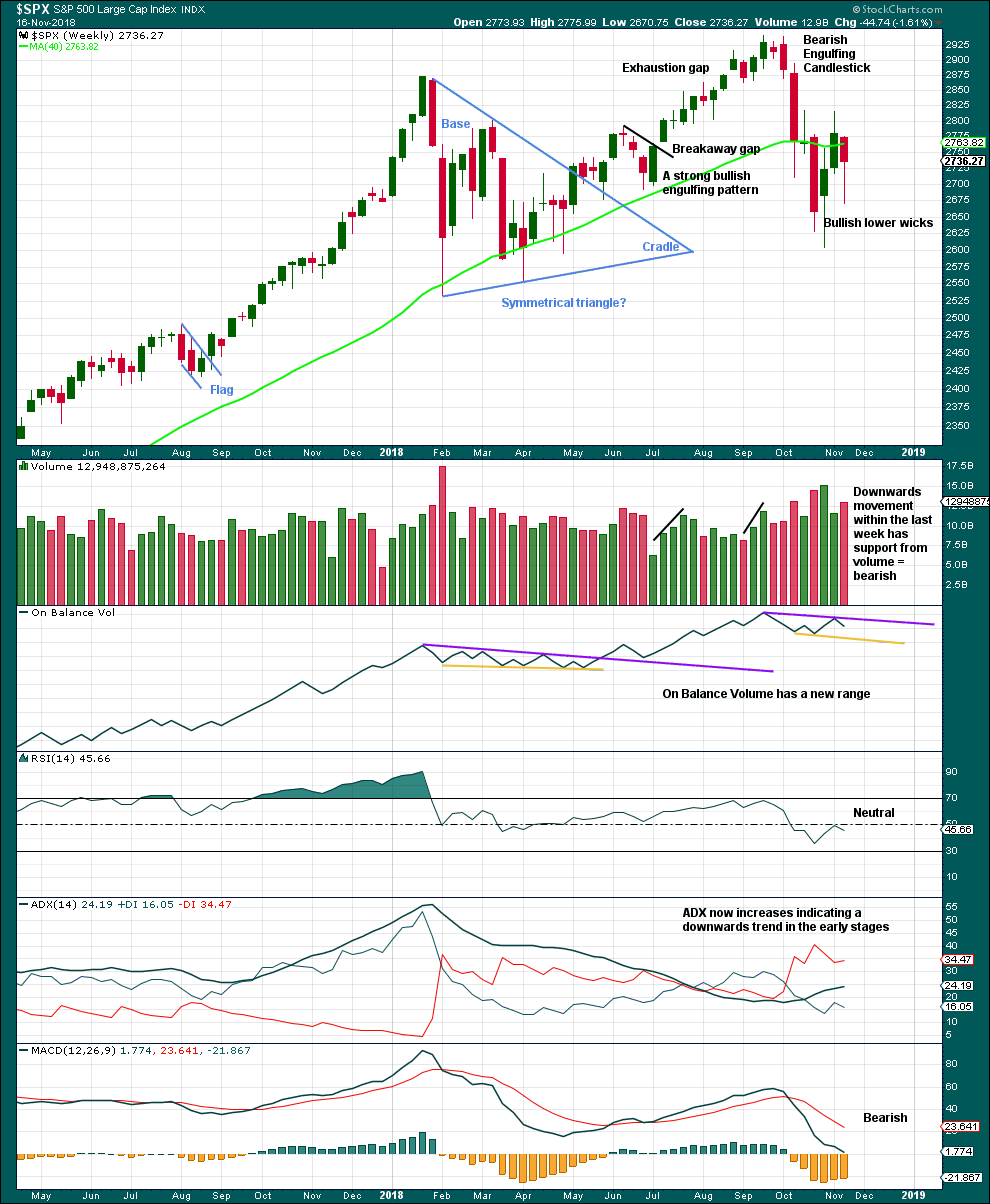
Click chart to enlarge. Chart courtesy of et=”_blank”>StockCharts.com.
Another long lower wick this week is fairly bullish. An upwards week next week looks most likely.
DAILY CHART
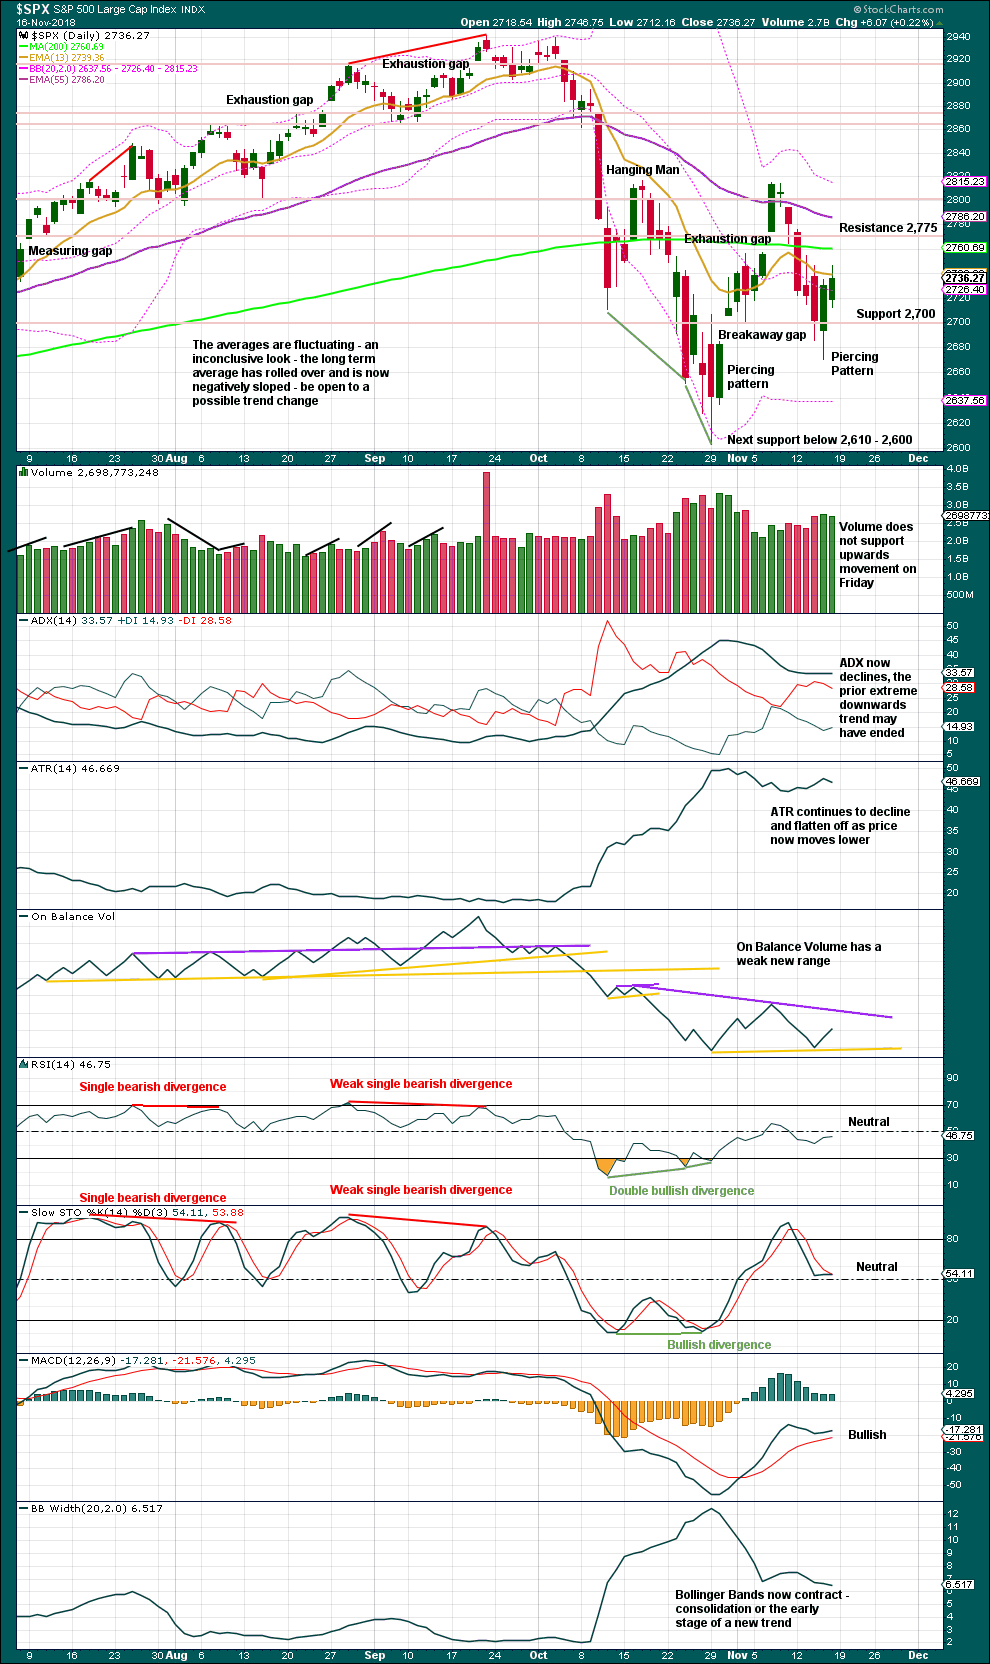
Click chart to enlarge. Chart courtesy of StockCharts.com.
Look for resistance above about 2,775 and above that about 2,800.
A lack of volume for Friday’s upwards movement is not of any concern for bullish wave counts. In current market conditions price can rise in light and declining volume for a reasonable length of time.
BREADTH – AD LINE
WEEKLY CHART
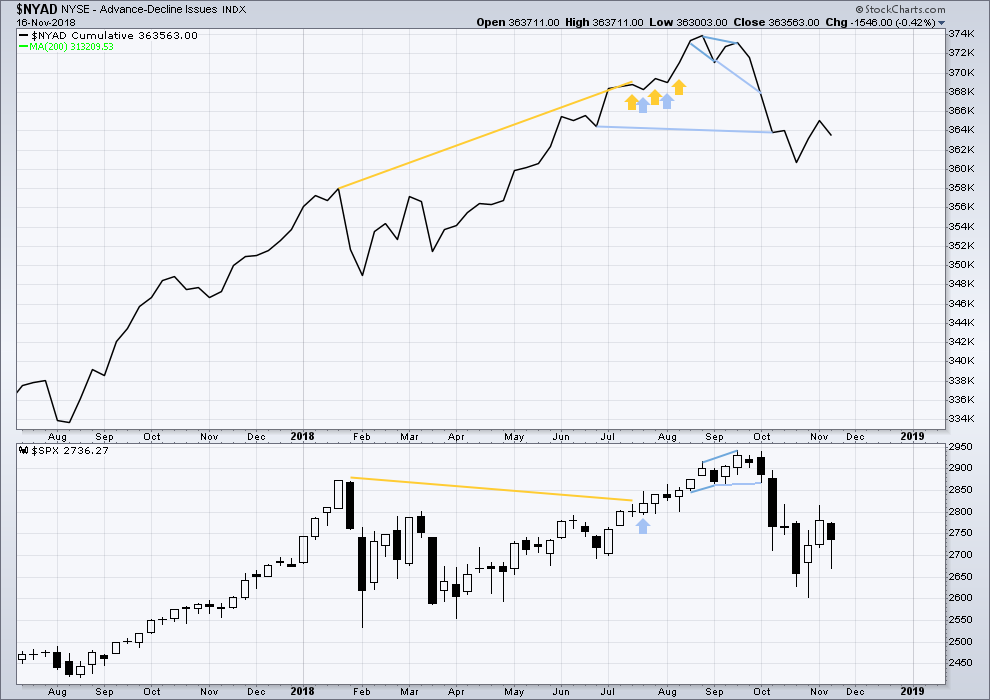
Click chart to enlarge. Chart courtesy of StockCharts.com. So that colour blind members are included, bearish signals
will be noted with blue and bullish signals with yellow.
This week both price and the AD line have moved lower. There is no new divergence.
DAILY CHART
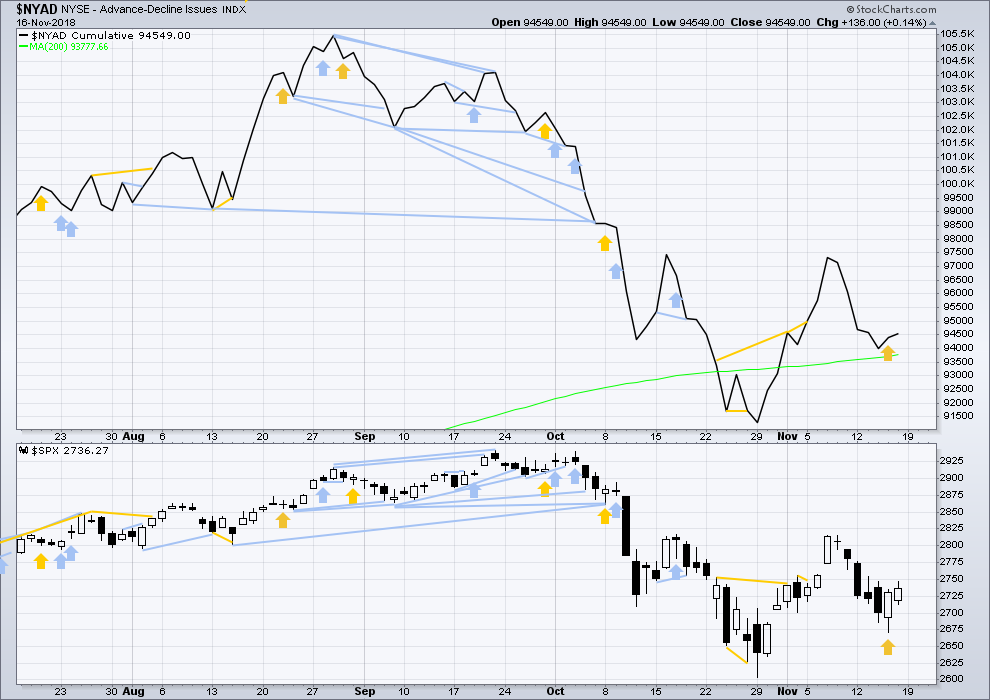
Click chart to enlarge. Chart courtesy of StockCharts.com. So that colour blind members are included, bearish signals
will be noted with blue and bullish signals with yellow.
There is normally 4-6 months divergence between price and market breadth prior to a full fledged bear market. This has been so for all major bear markets within the last 90 odd years. With no longer term divergence yet at this point, any decline in price should be expected to be a pullback within an ongoing bull market and not necessarily the start of a bear market. New all time highs from the AD line on the 29th of August means that the beginning of any bear market may be at the end of December 2018, but it may of course be a lot longer than that. My next expectation for the end of this bull market may now be October 2019.
Breadth should be read as a leading indicator.
On Friday both price and the AD line moved higher. There is no new divergence.
All of small, mid and large caps have bullish candlestick reversal patterns at Thursday’s low, and all have moved higher on Friday.
VOLATILITY – INVERTED VIX CHART
WEEKLY CHART
Click chart to enlarge. Chart courtesy of StockCharts.com. So that colour blind members are included, bearish signals
will be noted with blue and bullish signals with yellow.
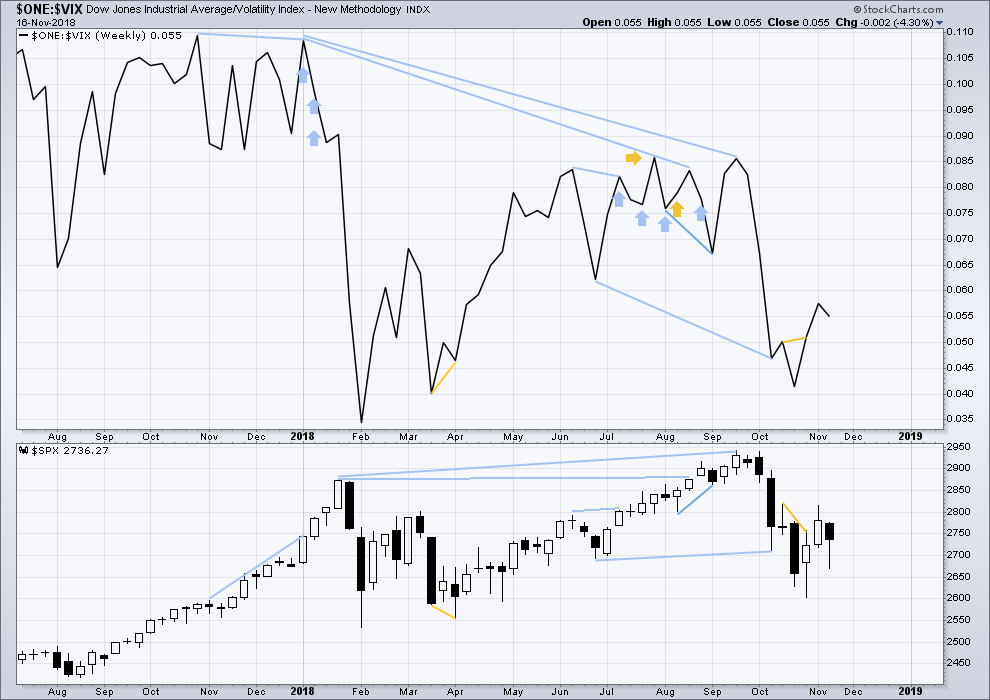
This week both price and inverted VIX have moved lower. There is no new divergence.
DAILY CHART
Click chart to enlarge. Chart courtesy of StockCharts.com. So that colour blind members are included, bearish signals
will be noted with blue and bullish signals with yellow.
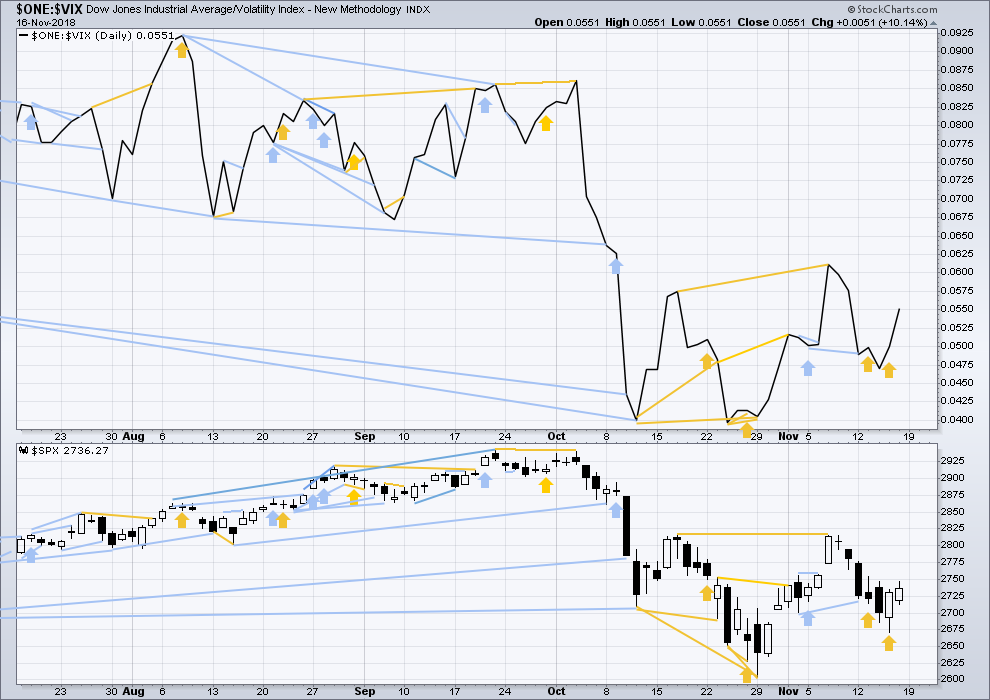
Normally, volatility should decline as price moves higher and increase as price moves lower. This means that normally inverted VIX should move in the same direction as price.
On Friday both price and inverted VIX have moved higher. There is no new divergence.
DOW THEORY
The following lows need to be exceeded for Dow Theory to confirm the end of the bull market and a change to a bear market:
DJIA: 23,344.52.
DJT: 9,806.79.
S&P500: 2,532.69.
Nasdaq: 6,630.67.
Published @ 11:20 p.m. EST on November 17, 2018.
—
Careful risk management protects your trading account(s).
Follow my two Golden Rules:
1. Always trade with stops.
2. Risk only 1-5% of equity on any one trade.


Get ready for many more stories like this.
I think I can say this much without getting into serious trouble.
They have been covering up more catastrophic failures since Volocaust I last February.
Only the most extremely gullible could not have known this.
The bankster cabal always tries to cover for the well-connected (remember Corzine?) and stealthily pass the consequences of their own recklessness on to an unsuspecting public.
This market is now the most leveraged in history and some critical inflection points have been already hit. I suspect it is much worse than anyone fully comprehends.
Trade carefully!
https://slopeofhope.com/2018/11/one-funds-instant-destruction.html
thanks for this post….
12:1 short vs long. From what I hear, he traded MUCH differently than advertised. He will be sued into oblivion.
Wow! Thank you, Verne.
Wow… I have never seen anything like that. Thought he was going to cry or worse. How can selling options against shares lose that much money???
Anyone buying PCG?
Good morning everybody.
I think this is what may be happening today. This resolves the problem that minor X has in my analysis above of a long minute a and short minute c.
For this idea minute c would be a more normal length to minute a.
It does look much better. I made a small adjustment to my stops. Thanks.
I’ll believe this sell off is over if/when SPX > 2700 again. Bears have been fading every little move up HARD. “Impressive.” NFLX had held at 270…for now.
Some serious blood out there. SQ down 9.5%. SPLK down 10%. CRM down 7.3%. BA down another 5% after getting destroyed last week too. V, once a leader that was invincible, down 3.6%.
So will this bring out the buyers? Maybe…
Yep! DJIA 25K, SPX 2.7K remain key.
That is the level they have to reclaim to avoid margin call cascade selling….
Is there a bit of a divergence here between VIX and SPX? VIX is up…but not as much as I would expect. Implying this down move is “just” backing/filling, not the start of a big C wave to far lower prices. But I’m not a huge VIX watcher so I might be mistaken.
I happened to check that earlier this morning when SPX was down about 10 or so. It was the same as you note now. But I am not sure I cold say that anomaly means anything significant.
The hourly triangle count (hourly only) will be invalidated at 2670.75. If that happens the probability of other alternate counts increases on the daily time frame.
2685 low and at 2690.52…. so what’s the next spot?
Turn initiated off the 78.6% at 2687. If it doesn’t hold and breaks below 2684 (a 61.8% fibo), then the next potential turn spot is the 100% at 2670.7. IMO.
Next potential turn spot for SPX a pair of fibo’s at 2784/2787.
Rat-a-tat-a-tat-a-tat!! Nothing like watching the massive destruction of paper wealth! The monsters of tech down 3.6%, with FB and NFLX leading the way at -5 and -4.2% respectively. Bam!!
I loaded AAPL, NFLX, NVDA and ES contracts at 2711
If NFLX can’t hold at 270.5 (a 61.8%) and form a double bottom there…then it’s headed to 229.2, the 78.6%. In my opinion. Careful.
agreed
Early last week, I stated that I think we goes sideways for two weeks before we begin the real up move in earnest. Still looking for that to start next week.
NDX double bottom now off a 78.6% at 6812. RUT off a 61.8% at 1506. SPX scribbling on the 50% at 2709. All markets showing signs of a turn but the jury is still certainly out.
This is the EW count I have so far. Probably should disregard degree of labeling. Note, the wave (5) of 1 is an ending diagonal. I think it fits all rules. Anyways, just some food for thought.
4th wave of a C wave ED possible….
Typo – I should have said “(v) green of 1 is an ED”. I think you all get the idea.
Futures gaps are rare, and worthy of note. They are not what one would expect to the downside at the start of a third wave higher.
A simultaneous impulsive break of DJIA 25K and SPX 2.7K opens the door for a break of the Feb and March lows. Have a great trading week!
I’m trying to stay highly cognizant here that a zig-zag down is one possible roadmap very much in play. I.e., we don’t have overwhelming EW support in one direction as we very often do. A P4 that breaks that long term channel might be “appropriate” in the context of the very late states of the GSC, signaling the grand top approach a year or so out.
Today/tomorrow should be highly informative.
Anyone for a revisit of 2700? Just happens to also be the 61.8% retrace of the Thurs low to Fri high. Shock and awe.
2709 – 50%
2700 – 61.8%
2684 – 78.6%
2671 – 100%
Any might turn it.
Ian’s call on Friday of a B wave top and C down launching just might have been spot on.
Or, this is more backing/filling before eventually completing a B wave up. Possible the “smart money” (banksters with loads of bullets) cleaning out the weak hands before driving the market up going into the holiday.
Aren’t corrections fun? Lol!!!!
Hey SPX 2909 the 50% and stalling…lessee if it holds.
#1
Either you were up early or you got in very late. In either case, very early morning. I am hoping your air quality from the fires is improving. We are entering an inversion and air stagnation period this week. Weather service issued an air quality advisory.
Have a good day Kevin.
Naw, it was only 10:20 pm Saturday night here on the Edge of Western Civilization! Watched “Catch Me if You Can” with DiCaprio and Hanks, fantastic movie, highly recommended.
Air quality here a tad better but still unhealthy at about 130 (I think it’s PPM units). Last three days were horrific, 230-250, though closer to the fire area it’s even much worse (as in, evacuate if you value your health).
If everyone can join us in a rain dance, much appreciated! The weather elliotwave-itician says the main count shows 30-50% chances of rain in NorCal Tues-Sat. Slap on your favorite tunes and boogie to help induce some tears from heaven here. (Yes, the heaven’s weep at how badly most of us dance, that’s our leverage!)
Hope the approaching weather reaches up there and clears things out for you too Rodney.
Air has finally improved. I’m on PCH north of the Getty Villa and was luck to not be affected by the fires. A few of our friends lost everything but the foundation.