
Upwards movement overall was expected for the week, which is what has happened.
Summary: For the short term, another upwards wave to 2,835 may begin on Monday. After that some sideways movement or a deeper pullback may begin.
Overall, this bounce is expected to be incomplete. It may continue for another one to few weeks and may end somewhere between 2,873.54 to 2,890.38.
The larger picture still expects a primary degree fourth wave is unfolding, which may continue for another few weeks. It is still impossible to tell which of many Elliott wave structures it may be, so flexibility for short-term expectations is essential.
New updates to this analysis are in bold.
The biggest picture, Grand Super Cycle analysis, is here.
Last published monthly chart is here, video is here.
ELLIOTT WAVE COUNT
WEEKLY CHART
Click chart to enlarge.
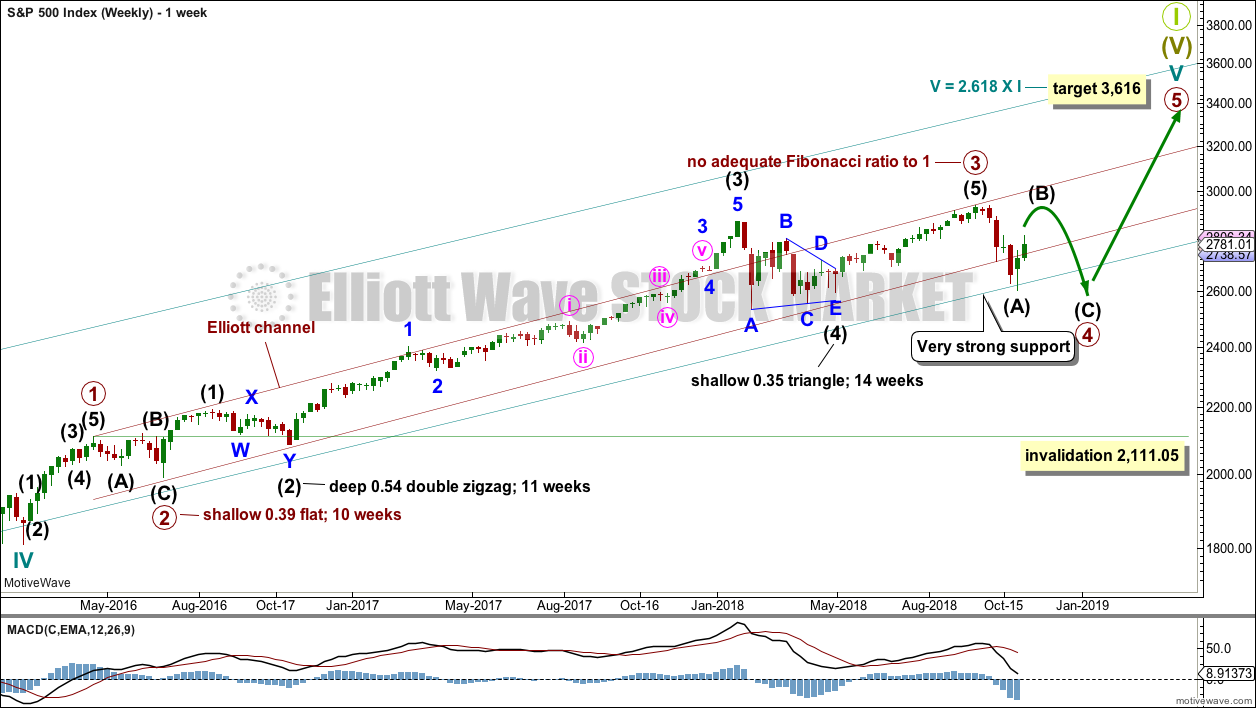
Cycle wave V must complete as a five structure, which should look clear at the weekly chart level and also now at the monthly chart level. It may only be an impulse or ending diagonal. It is clear it is an impulse.
Cycle wave V has passed equality in length with cycle wave I, and 1.618 the length of cycle wave I. The next Fibonacci ratio is used to calculate a target. When primary wave 4 is complete and the starting point for primary wave 5 is known, then the final target may also be calculated at primary degree. At that stage, there may be two targets, or the final target may widen to a small zone.
Within cycle wave V, the third waves at all degrees may only subdivide as impulses.
Within primary wave 3, there is perfect alternation and excellent proportion between intermediate waves (2) and (4).
The maroon channel is drawn about primary degree waves. The first trend line is drawn from the ends of primary waves 1 to 3, then a parallel copy is placed upon the low of primary wave 2. The overshoot of the upper edge of this channel by the end of intermediate wave (3) looks typical. For the S&P, its third waves are usually the strongest portion of an impulse; they often exhibit enough strength to overshoot channels.
Primary wave 4 now has an overshoot on the lower edge of the channel. This is acceptable; fourth waves are not always neatly contained within channels drawn using this technique.
Primary wave 4 may find very strong support about the lower edge of the teal channel, and it looks like this is from where price may be bouncing. This channel is copied over from the monthly chart and contains the entire bull market since its beginning in March 2009. While Super Cycle wave (V) is incomplete, this channel should not be breached at the weekly chart level.
Primary wave 4 may not move into primary wave 1 price territory below 2,111.05.
At this stage, the expectation is for the final target to be met in October 2019. If price gets up to this target and either the structure is incomplete or price keeps rising through it, then a new higher target would be calculated.
DAILY CHART
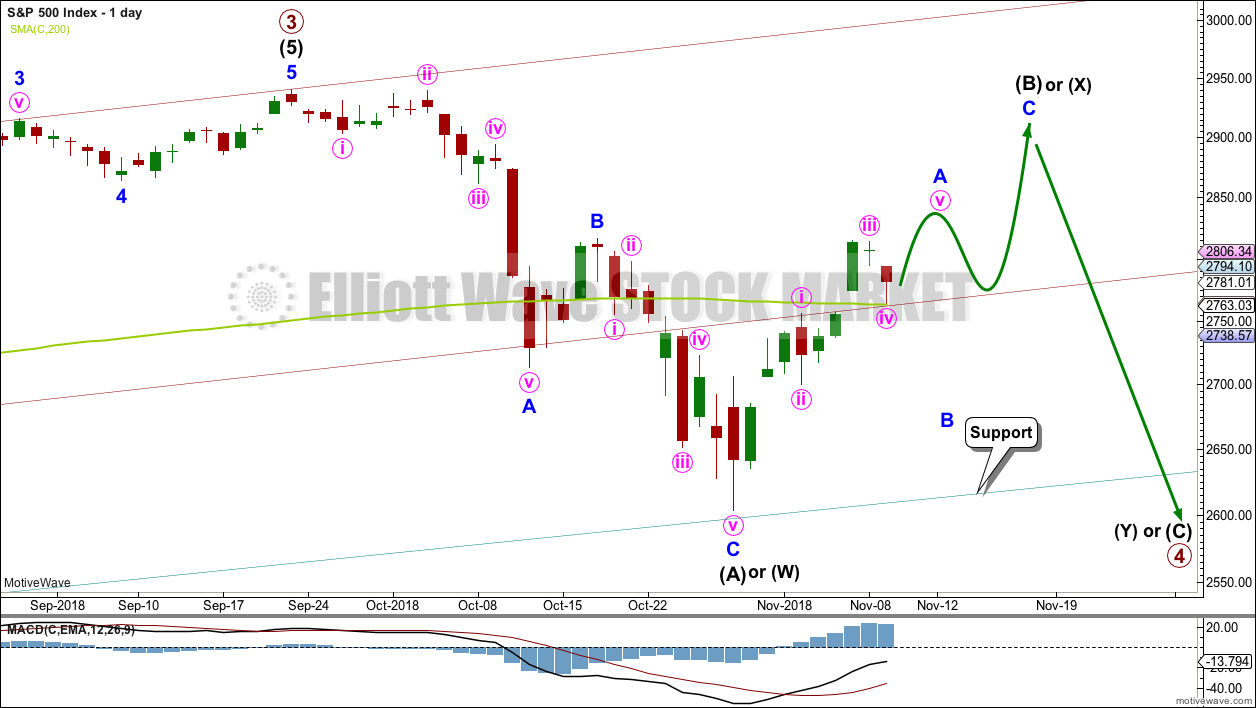
Click chart to enlarge.
Primary wave 4 would most likely end somewhere within the price territory of the fourth wave of one lesser degree. Intermediate wave (4) has its price territory from 2,872.87 to 2,532.69. Within this range sit the 0.236 Fibonacci ratio at 2,717 and the 0.382 Fibonacci ratio at 2,578.
The 0.382 Fibonacci ratio would expect an overshoot of the teal channel. This may be too low; price may find support at the lower edge of the channel. However, as primary wave 4 should be expected to exhibit reasonable strength, it may be able to overshoot the channel and that would look reasonable. This possibility is now more seriously considered.
Primary wave 2 unfolded as a shallow regular flat correction lasting 10 weeks.
Intermediate wave (A) may be seen as a complete zigzag. A zigzag down to start primary wave 4 may also be labelled intermediate wave (W).
If intermediate wave (A) or (W) subdivide as a zigzag, then primary wave 4 may unfold as a double zigzag, double combination, flat or triangle. Of all these possible structures a flat correction would be least likely as that would not offer structural alternation with the flat correction of primary wave 2.
A double zigzag will be considered below in a second alternate wave count.
A triangle would be fairly likely even though intermediate wave (4) was a triangle. This does not reduce the probability of primary wave 4 also subdividing as a triangle.
A double combination should always be considered if a triangle is possible, and this would also offer reasonable alternation with primary wave 2.
A triangle, combination or flat would all expect a high bounce for intermediate wave (B) or (X). Intermediate wave (B) or (X) would most likely subdivide as a zigzag.
Within a triangle for primary wave 4, intermediate wave (B) would most likely be about 0.8 to 0.85 the length of intermediate wave (A) giving a target range from 2,873.54 to 2,890.38. Intermediate wave (B) of a running triangle may make a new high above the start of intermediate wave (A). The target calculated would see intermediate wave (B) about 0.74 the length of intermediate wave (A); although this would be a little shorter than the most common length, it would still be acceptable.
Within a double combination for primary wave 4, intermediate wave (W) may be the first complete structure in a double. Intermediate wave (X) may be a very high bounce and may make a new high above the start of intermediate wave (W). There is no minimum requirement for the length of intermediate wave (X), and no maximum limit. The target calculated for intermediate wave (X) would see it as a reasonably high bounce; this would give a combination the right look.
When intermediate wave (B) or (X) is complete, then intermediate wave (C) or (Y) downwards may complete primary wave 4. If primary wave 4 is a triangle, then intermediate waves (C), (D) and (E) would be required to complete it.
For both of the more likely options of a triangle or combination for primary wave 4, price may continue to find support about the lower edge of the teal trend channel. This would give the wave count the right look at the monthly time frame.
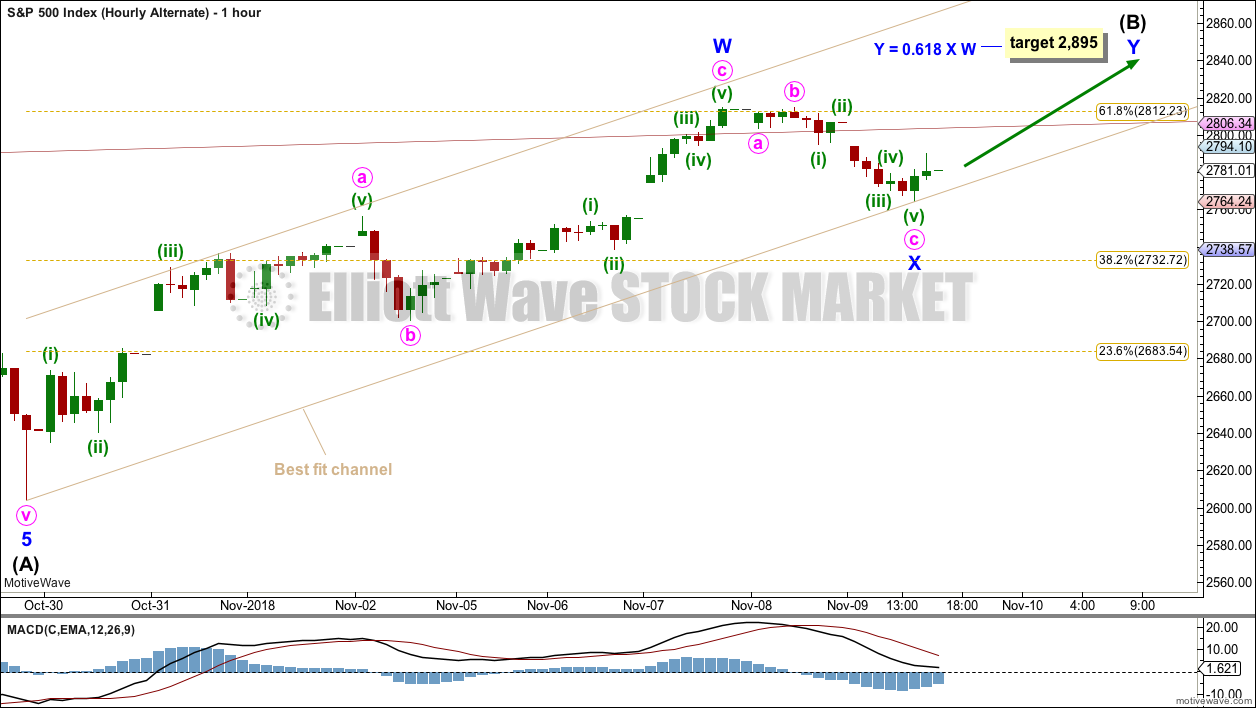
HOURLY CHART
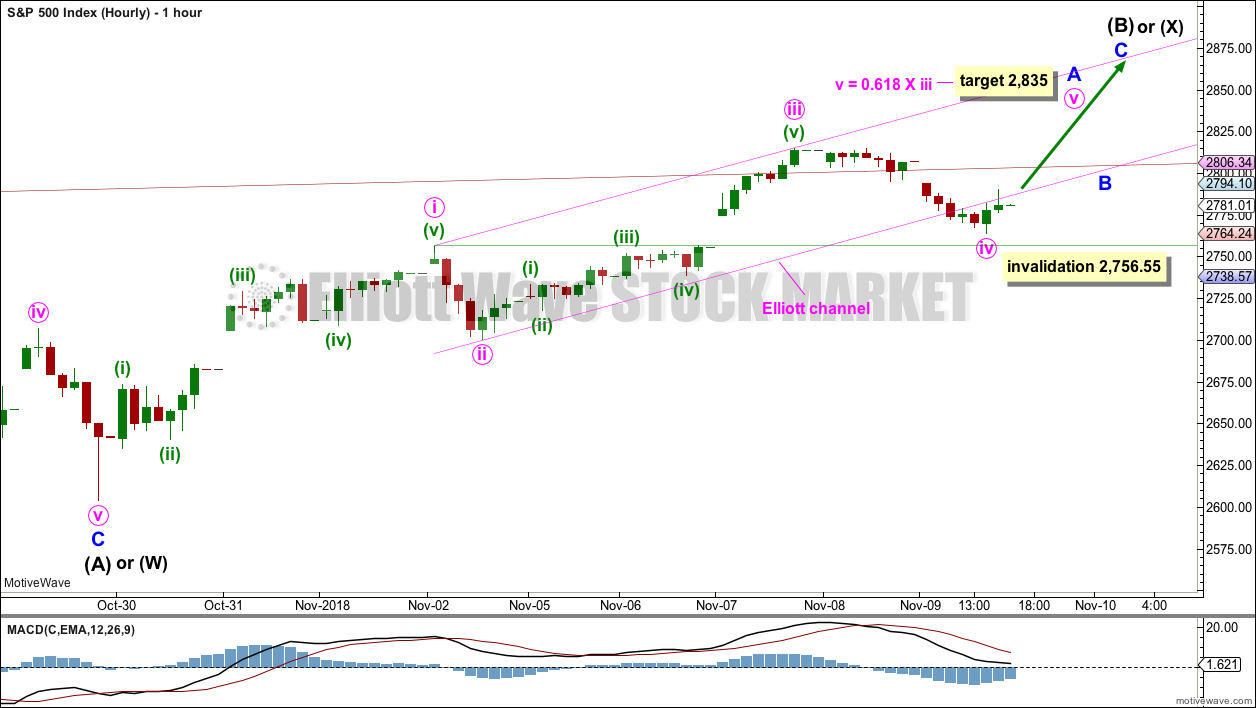
Click chart to enlarge.
Intermediate wave (B) or (X) would most likely subdivide as a single or multiple zigzag to achieve a high bounce.
This main wave count will continue to consider the possibility that a single zigzag upwards may be completing. The alternate below will consider the possibility that a double zigzag upwards may be completing. Both ideas work in exactly the same way for both wave counts.
Within a possible zigzag unfolding upwards, minor wave A may be an incomplete impulse. There is no Fibonacci ratio between minute waves iii and i, and minute wave iii is shorter than minute wave i. This limits minute wave v to no longer than equality in length with minute wave iii at 2,878.96, so that minute wave iii is not the shortest actionary wave within the impulse.
Minute wave iv has overshot the pink Elliott channel. Fourth waves are not always neatly contained within these channels.
Minute wave iv may not move into minute wave i price territory below 2,756.55.
When minor wave A is a complete five wave impulse, then minor wave B may unfold lower and may not move beyond the start of minor wave A.
If intermediate wave (A) or (W) has subdivided as a three, then intermediate wave (B) or (X) may make a new price extreme beyond the start of intermediate wave (A) or (W) above 2,940.91. There is no upper invalidation point for this main wave count for this reason.
ALTERNATE WAVE COUNT
DAILY CHART
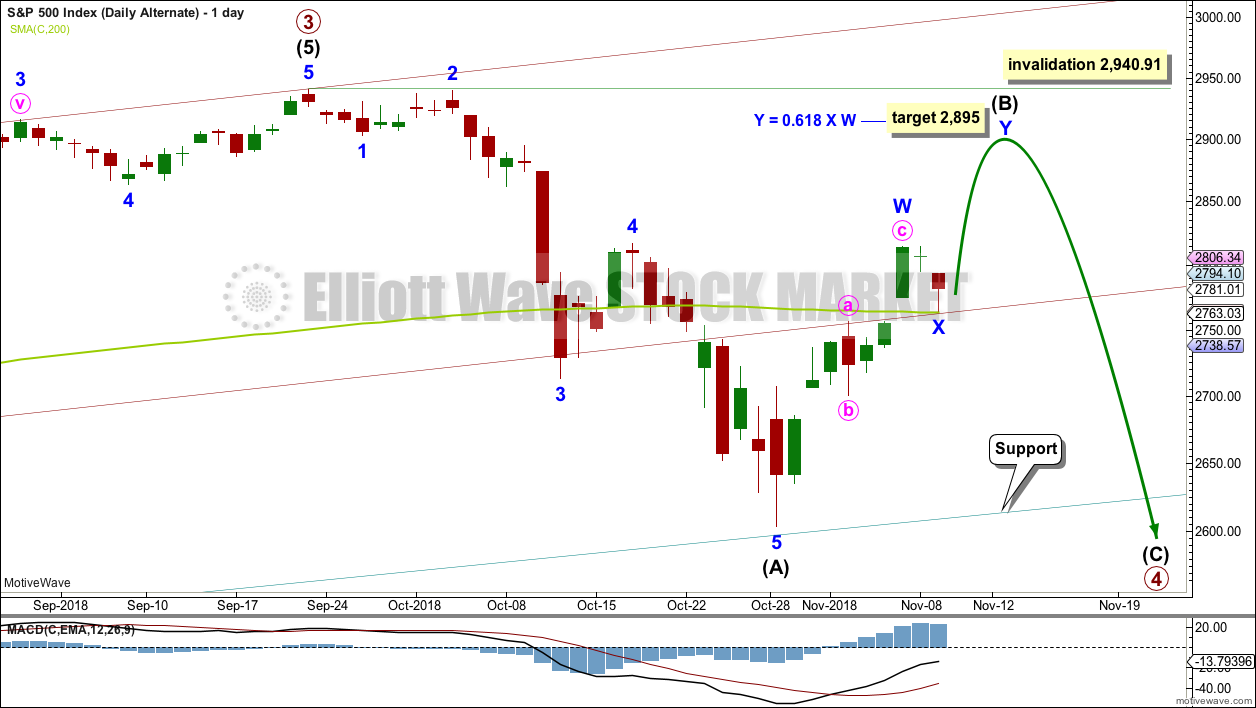
Click chart to enlarge.
It is also possible to see the downwards wave labelled intermediate wave (A) as a complete impulse. If intermediate wave (A) is a five wave structure, then intermediate wave (B) may not move beyond its start above 2,940.91.
Primary wave 4 may be a zigzag to provide structural alternation with the flat correction of primary wave 2; intermediate wave (A) within a zigzag must subdivide as a five wave structure. When intermediate waves (A) and (B) are complete, then intermediate wave (C) would most likely end below the end of intermediate wave (A) to avoid a truncation. This would see the end of primary wave 4 substantially overshoot the lower edge of the teal channel, which would be unlikely and is why this alternate wave count is judged to have a lower probability than the main wave count.
Primary wave 4 may not move into primary wave 1 price territory below 2,111.05.
HOURLY CHART
Click chart to enlarge.
Intermediate wave (B) may be unfolding as a double zigzag.
The first zigzag in a double may be complete, labelled minor wave W. The double may be joined by a three in the opposite direction labelled minor wave X. It is possible also that minor wave X may be incomplete; it could move lower. There is no lower invalidation point for this wave count because there is no rule stating a limit for X waves within multiples.
Double zigzags normally have a strong slope against the prior trend. To achieve a strong slope their X waves are normally brief and shallow.
The target for intermediate wave (B) to complete would see it very deep in relation to intermediate wave (A). This is entirely possible.
If intermediate wave (A) has subdivided as a five, then intermediate wave (B) may not move beyond its start above 2,940.91.
SECOND ALTERNATE WAVE COUNT
DAILY CHART
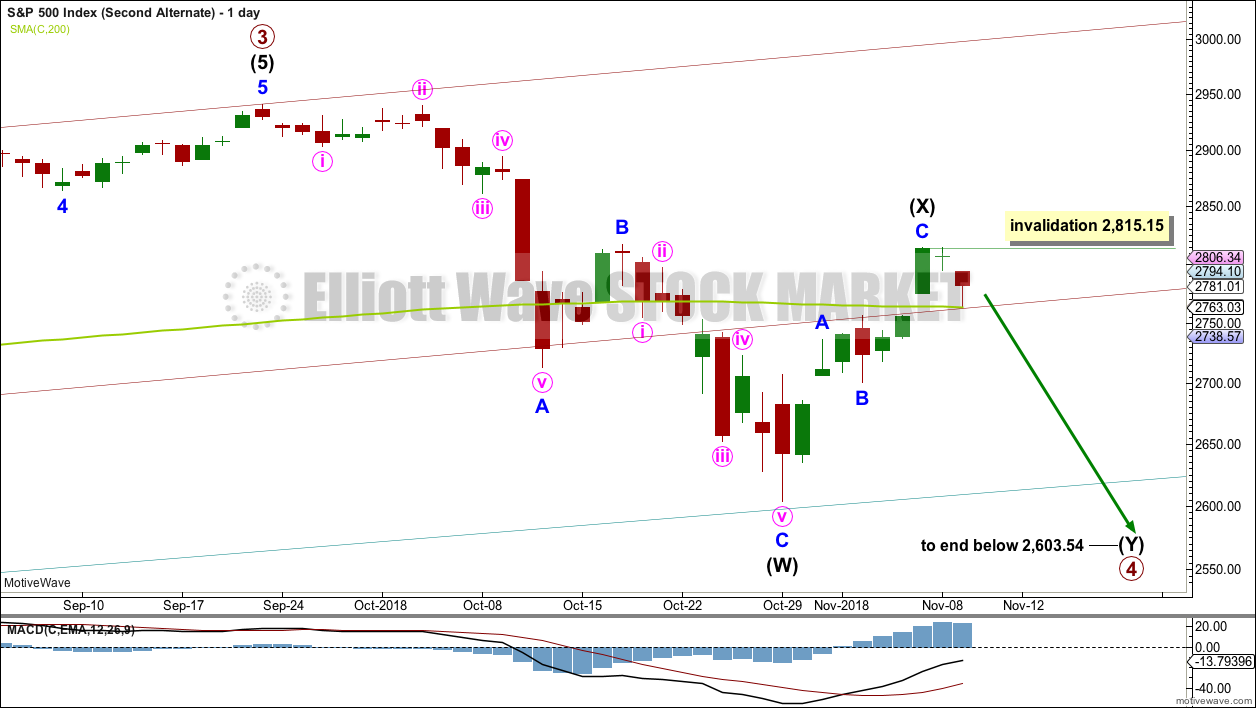
Click chart to enlarge.
This second alternate wave count considers the possibility that primary wave 4 may unfold as a double zigzag. This would provide alternation with the flat correction of primary wave 2.
Double zigzags normally have a strong slope against the prior trend. To achieve a slope their X waves are normally relatively brief and shallow, and wave Y ends reasonably or substantially beyond the end of wave W. Double zigzags are very common structures.
Here, intermediate wave (X) may be complete, but it is not particularly brief and it is not shallow. This is possible, but the probability is reduced.
The second zigzag in a double exists to deepen the correction when the first does not move price deep enough. Intermediate wave (Y) would require now a substantial breach of the teal trend channel, which has been held since 2009, to deepen the correction. The probability of this is low while the bull market continues.
This alternate wave count has a very low probability. But low probability does not mean no probability. It is provided so that we may have an explanation and a guide if price begins to fall strongly next week.
TECHNICAL ANALYSIS
WEEKLY CHART
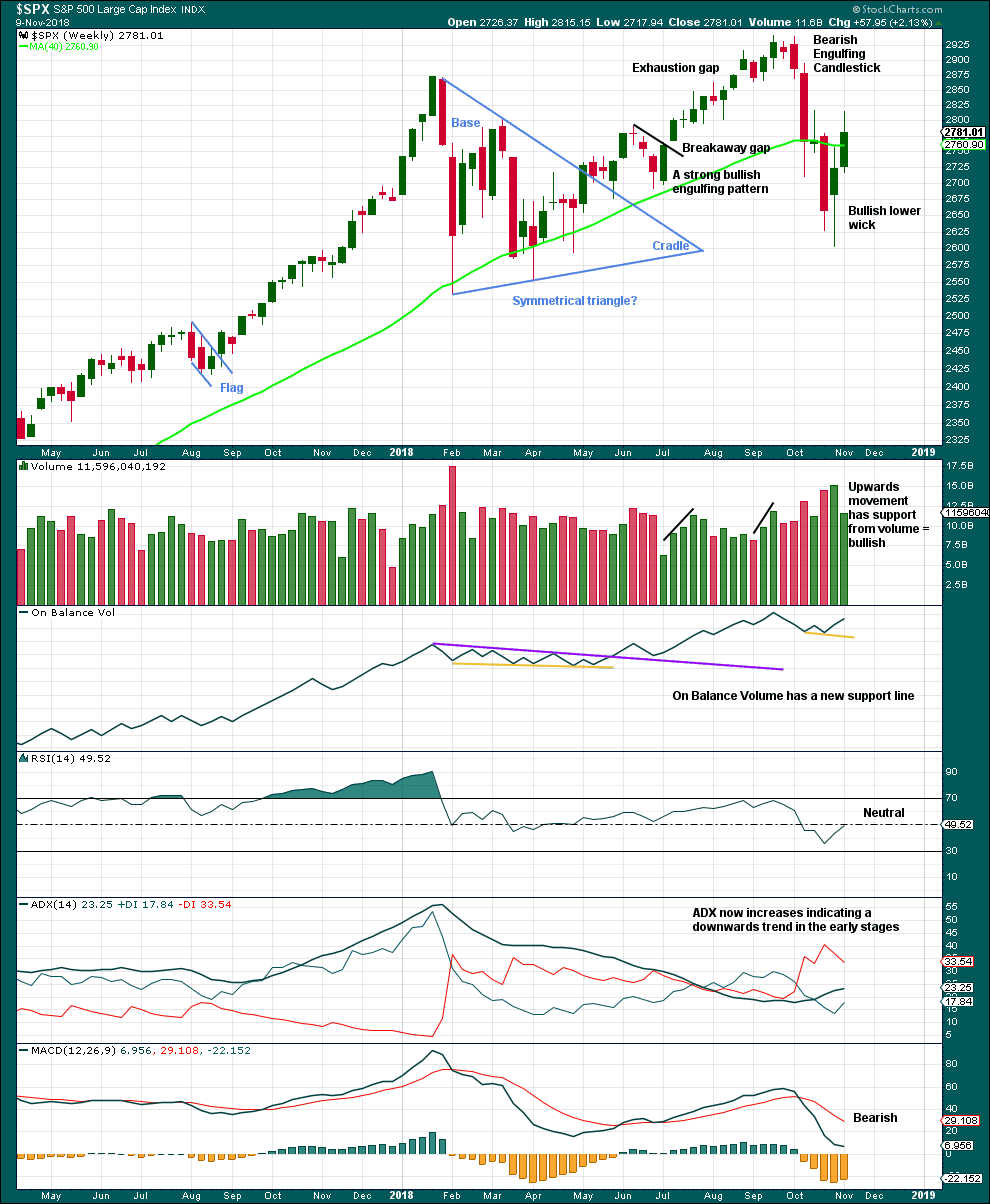
Click chart to enlarge. Chart courtesy of et=”_blank”>StockCharts.com.
Weakness in volume and a long upper wick suggest this upwards week may be a counter trend bounce. Overall, this supports the Elliott wave count.
DAILY CHART
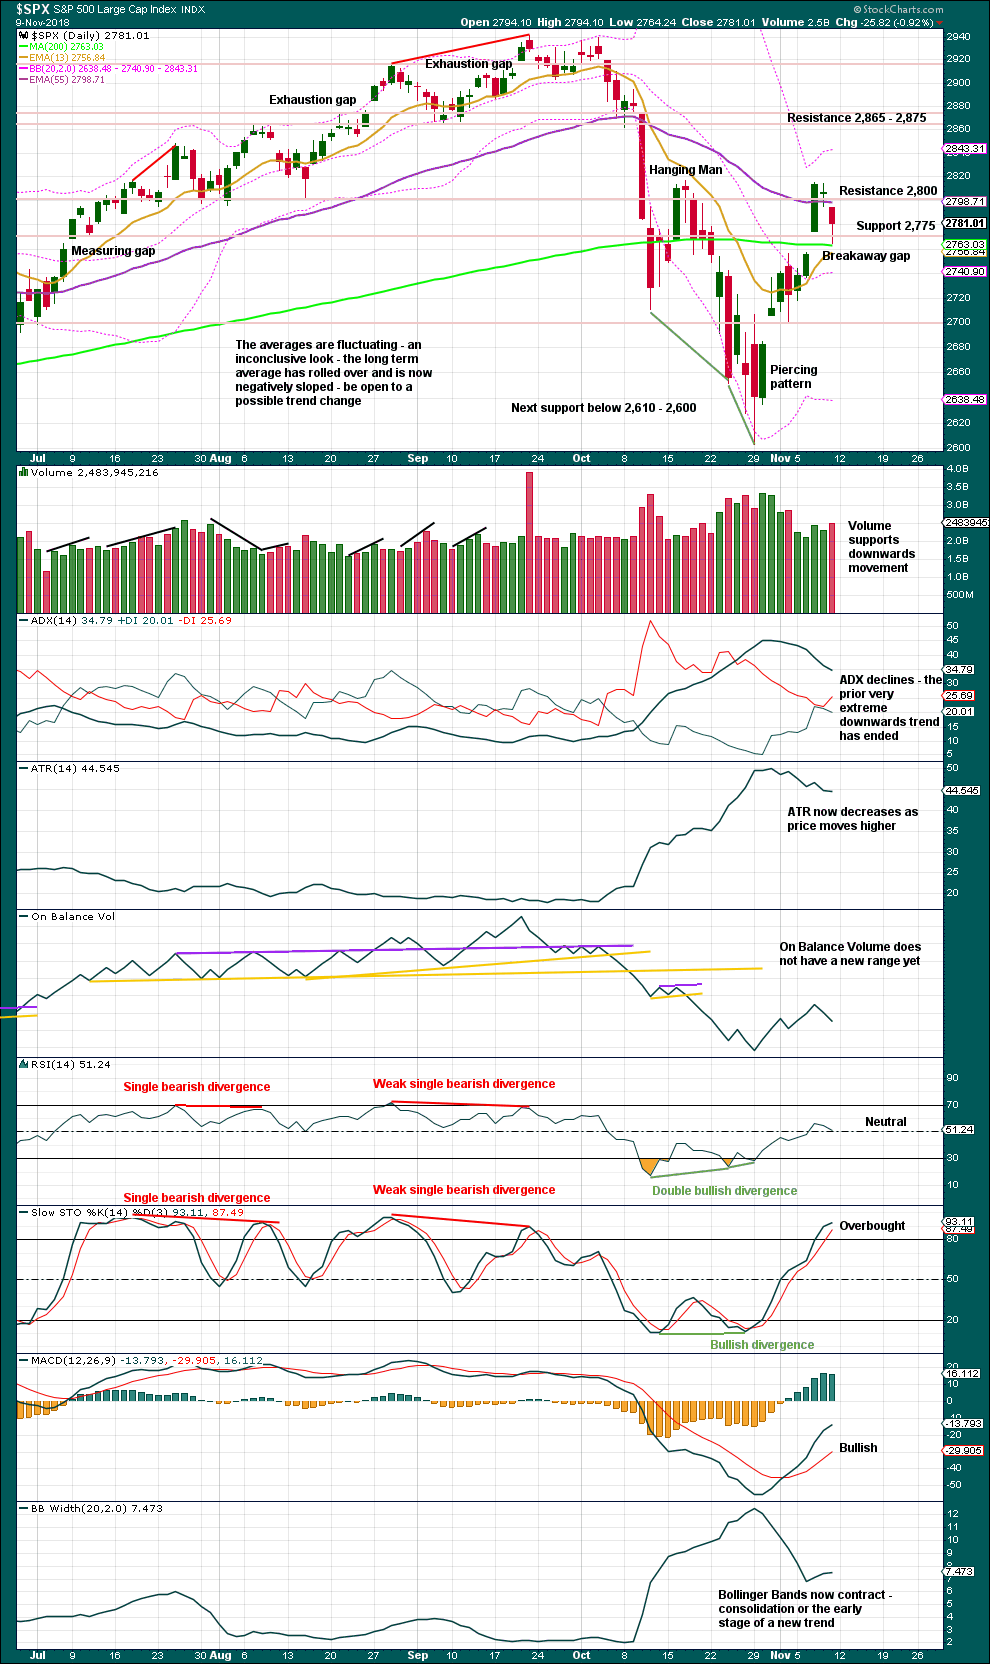
Click chart to enlarge. Chart courtesy of StockCharts.com.
The last breakaway gap remains open, and it has its lower edge at 2,756.82; Friday looks like a test of support there, which has held. The long lower wick for Friday looks bullish.
If resistance about 2,800 can again be overcome, then look for upwards movement to find next resistance about 2,865 – 2,875. This chart best supports the main Elliott wave count and the fist alternate Elliott wave count.
BREADTH – AD LINE
WEEKLY CHART
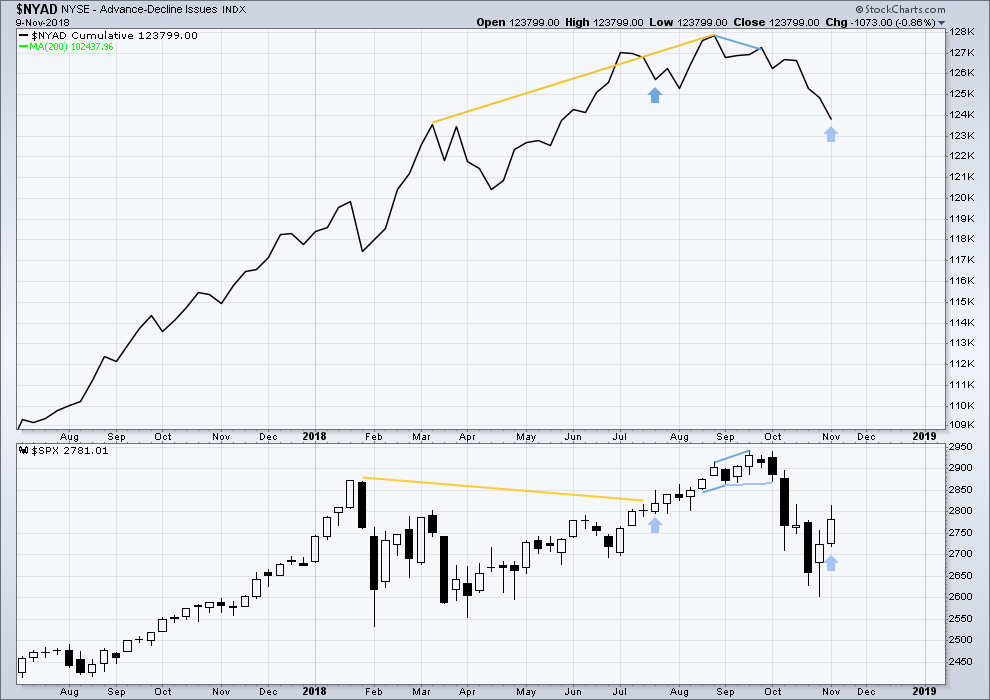
Click chart to enlarge. Chart courtesy of StockCharts.com.
This week price moved higher, but the AD line moved lower. This divergence is bearish and supports the second alternate Elliott wave count.
However, noted on this chart, there is one other instance of the same single week bearish divergence that was not followed by a downwards week.
DAILY CHART
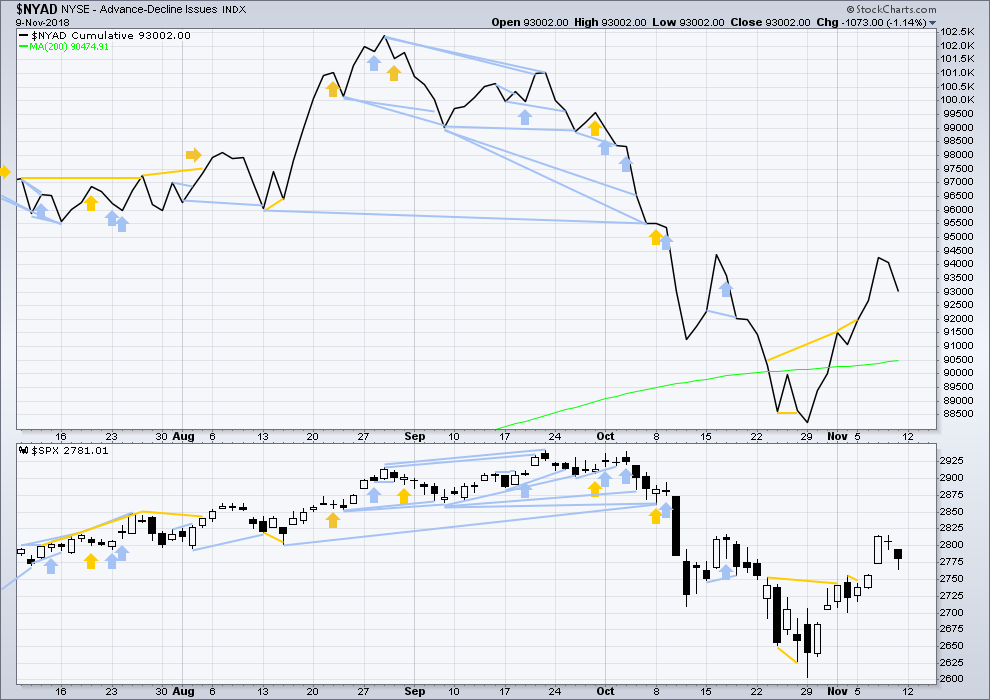
Click chart to enlarge. Chart courtesy of StockCharts.com.
There is normally 4-6 months divergence between price and market breadth prior to a full fledged bear market. This has been so for all major bear markets within the last 90 odd years. With no longer term divergence yet at this point, any decline in price should be expected to be a pullback within an ongoing bull market and not necessarily the start of a bear market. New all time highs from the AD line on the 29th of August means that the beginning of any bear market may be at the end of December 2018, but it may of course be a lot longer than that. My next expectation for the end of this bull market may now be October 2019.
Breadth should be read as a leading indicator.
Downwards movement within this last session has support from a decline in market breadth. There is no new short term divergence.
VOLATILITY – INVERTED VIX CHART
WEEKLY CHART
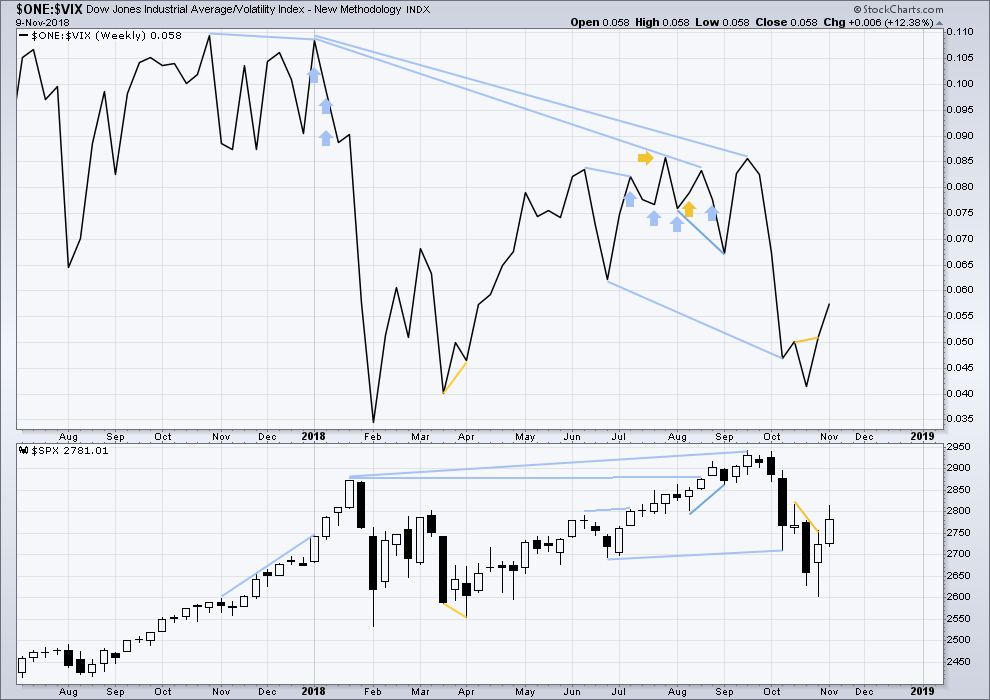
Click chart to enlarge. Chart courtesy of StockCharts.com. So that colour blind members are included, bearish signals
will be noted with blue and bullish signals with yellow.
This week price moved higher with inverted VIX. The rise in price this week comes with a normal corresponding decline in VIX.
DAILY CHART
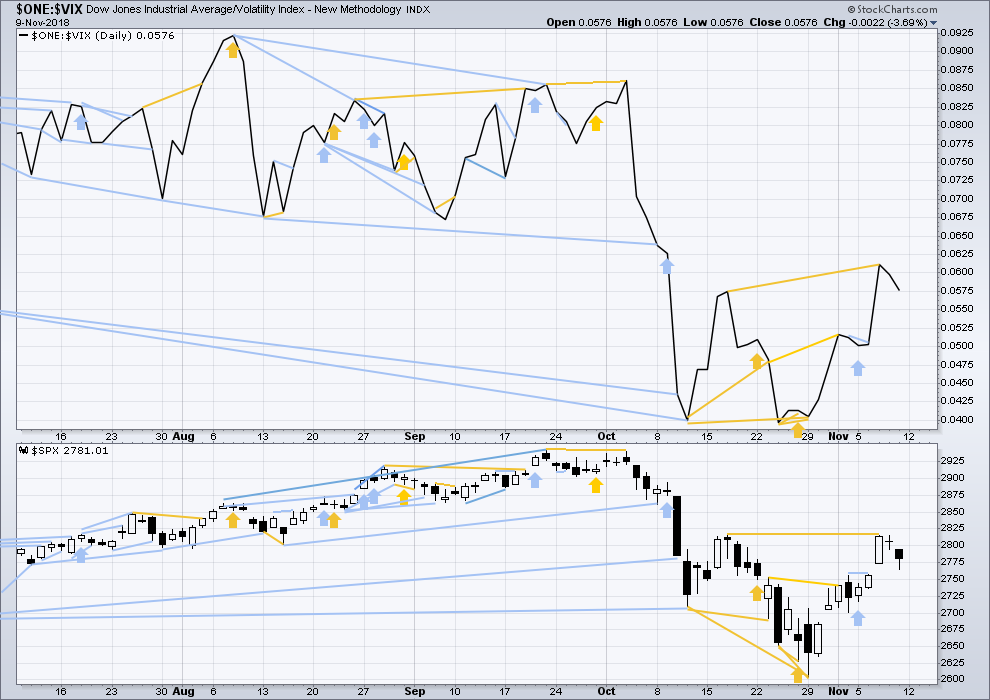
Click chart to enlarge. Chart courtesy of StockCharts.com. So that colour blind members are included, bearish signals
will be noted with blue and bullish signals with yellow.
Normally, volatility should decline as price moves higher and increase as price moves lower. This means that normally inverted VIX should move in the same direction as price.
The fall in price during Friday’s session has support from a decline in inverted VIX. There is no new short term divergence.
DOW THEORY
The following lows need to be exceeded for Dow Theory to confirm the end of the bull market and a change to a bear market:
DJIA: 23,344.52.
DJT: 9,806.79.
S&P500: 2,532.69.
Nasdaq: 6,630.67.
Published @ 04:32 p.m. EST on November 10, 2018.
—
Careful risk management protects your trading account(s).
Follow my two Golden Rules:
1. Always trade with stops.
2. Risk only 1-5% of equity on any one trade.
This may be of interest to some. If we make it down toward 2700 tomorrow and it seems like downward movement is stalling, I will most likely be buying long positions. Measured move of the inverse H&S pattern is 3000+.
Remember people, the comments guidelines refer to your Grandmother. If you wouldn’t say it to her like that, or it you wouldn’t say it at all, then please do not say it here.
Let us all be the most exceptionally polite and respectful that we can be, and make this forum the best place to hang out and share trades and analysis.
Thank you.
Thank you mamma bear. Because of you, this forum is already the best place to hang out and share trades and analysis despite any shenanigans we may experience from time to time. Tomorrow I will start a much less volatile topic for discussion. Perhaps something like ‘illegal immigration to the USA”. Just a joke. Just a joke. Lighten up and laugh. Life is far to short to do otherwise.
Beers or spirits are on me tonight.
You’re short?
expanding triangle ? more downside to come?
Watching RTY here and thinking pretty much the same thing.
Hi everyone!
I was wondering if anyone had any trading thoughts regarding the Us dollar.
Long or short?
All comments welcome
Thank You
Nothing… I got out of everything this morning!
I am done with all of this! Keep losing… Yea I won a few big ones but gave it all back+++ on the follow on trades. What a bad year for me… yet again.
Kevin, take it easy. If you want people to be sensitive to you, you need to learn to accommodate others as well. Layoff Joseph will you.
May I recommend using tighter stops on your positions?
Giving “all back” is usually a sign of way too aggressive directional trades (too large position sizes, or stops not tight enough). I was expecting a bounce this morning and instead had to exit hedging short puts of a SPY 274/275 bull put spread. The trade was still profitable despite my being wrong about short term market direction as I more than made up the loss on the short 275 puts with gains on the long 274 puts.
Trading is war. You have to be prepared to defend your position, or change it swiftly when Mr. Market does the unexpected. Always have a number that says you are wrong, and action should be taken long before you “give back” all your trading capital.
I sincerely hopes that helps a bit Joseph. Simple guidelines, but far too many market participants ignore them, and spend precious time either treading water, or depleting their trading capital.
I did not like the fact that we failed to take out the 2700 pivot today, which SHOULD have happened with a major C wave down.
Mostly in cash now short term and waiting for Mr. Market to show his cards.
Best of fortunes in future trades…a big wave down is coming…. 🙂
Kevin, I’ve deleted your comment because it could have been interpreted as not very nice. Which means your reply is also deleted Jack.
not fair to those of us that miss it.
Updated alternate hourly wave count:
It looks fairly clear that a zigzag up to the last high is complete. It may be either the first zigzag in a double for intermediate wave (B) as this alternate wave count outlines, or it may have been a zigzag complete for a single zigzag for intermediate wave (B) as the second alternate outlines.
It’s impossible to tell which of the two ideas is correct. Because within a double zigzag there is no rule stating a maximum length for minor wave X. However, if minor wave X becomes deeper than the 0.618 Fibonacci ratio of minor wave W then the probability that it’s an X wave within a double zigzag would be so low I may discard the idea.
And so 2,864.17 is not a hard and fast price point to differentiate the two wave counts, but it will be used as a guide to which may be more likely.
I hope this reasoning makes sense. I’m trying to determine how to judge probability in the next few days and so far this seems reasonable to me.
Lara, quick question on the labeling of the X wave. How did you determine where the minute a and b where placed. Minute a seems incredibly short and would take a very low time frame to make the internals work.
True. It worked when the move began, but now minute c looks too long in relation to minute a.
I’m relabelling it, but first, some time on the five minute chart.
Yep. It pains me greatly to see discussion of climate change in this forum.
Because it’s such a divisive topic and not immediately relevant to markets today, any further comments about it will be deleted.
Man, I’ve got to agree with Lara….. lets focus our energy on trading
I second that. Lara is right. Please see what Peter said. He is exactly on point.
I beg to differ, with all due respect.
As long as discussions remain cordial and not personal, exploring topics other than the markets makes the forum an interesting place to hang out. I think folk today are way too thin-skinned over people having differing points of view. Points made politely are not necessarily divisive, and can point out flawed reasoning.
We are all adults, or are we?
Just my two cents… 🙂
As I said, I have no further comment on the subject.
My meta-level comment is this: this is a trading forum. The coming grand super cycle wave II will go to zero, as a function of this issue. So that makes it pertinent, and to my mind, critically important for people to understand. Hence, my comments in reaction to the “it’s just politics” responses.
Over and out.
Normally I would agree. And yes, we’re all adults here.
This topic has been covered well here before. It continues to be divisive.
You and other members are welcome and free to disagree with me. But I think the decision must stand.
I agree with you Verne. But, the owner of the site has already communicated her wishes. Is like this, I am a big fan of the constitution, especially the second amendment. However, if a business owner/property owner asks me not to carry on her/his property, I comply. That simple. This is the way I see it.
Samsondguy:
I have deleted your comment.
I have repeatedly asked you to provide a chart which outlines your wave count. I have also asked you to refer to specific degrees of labelling. You have again posted a comment which makes statements with no reference to Elliott wave degrees (except major, which is not one) nor does it provide a chart.
You have not acknowledged my requests nor acknowledged the replies of anyone else here.
If you post another comment in this vein and refuse to engage in comments by making no replies, then your comment privileges will be removed.
Samsoundguy, Thanks for the input. But I really cannot follow your comment. It is more than difficult to understand without some sort of chart / graphic. If you are able to put all this on a chart, it would make your input many times more valuable. As it is, it does not really help me but rather confuses me. So keep posting but please make the adjustment to using charts for these more complex and lengthy ideas. Thanks in advance.
Got to add my opinion to global warming discussion this AM.
Climate change is real, has been for millions of years. Global warming may or may not be true but certainly climate is not being changed by human hiccups and cow farts.
The real reason for global warming hysteria begun by Gore and Company a decade ago is simply power, control and money. For decades TPTB used oil to control the world but as peak oil hoax lost credibility TPTB needed another long-lasting worldwide control mechanism. Enter global warming. Disaster imminent ! UN and global carbon tax, carbon credit trading required to save the world. Believe or die. NYC to be under water in 10 years! Trillions to be made by select globalists.
NOT!
Had to squeeze that opinion in before a stern warning (reasonable) to knock off all the global warming, stick to EW analysis.
Yep.
Yes, I agree, I think this could be Minor B in Inter B?
Looks like we are going to close that open gap. If we do and once again surrender the pivots on a closing basis I think that spells trouble for the bulls.
And Minute wave i is just ticks below the gap at 2756.55. If it is touched or passed to the downside, it is invalidated. Then I think we will be looking at Alternate 1 or 2. Alternate 2 would indicate we are headed to new lows below 2600 and completion of Primary 4.
That did not take long. The gap is filled I think making it an exhaustion gap. Minute 1 is violated on the main count. Alternate counts are now in play. Which one will ultimately win out is the question.
The main count can still be valid if Minor A is moved to the most recent high of 2815 or so. I believe the up move from 2600 to 2815 can be counted as a completed five waves up. It is not ideal and thus Lara has counted it as three waves up. But I think it may still be valid as 5 waves. Lara will need to confirm this possibility.
Climate… the real story: https://www.cato.org/people/patrick-michaels
https://www.cato.org/publications/working-paper/climate-models-climate-reality-closer-look-lukewarming-world
https://www.cato.org/publications/public-comments/comments-fourth-national-climate-assessment
Thanks Joe. Very good, not to mention interesting, reading. Maybe I don’t need to purchase real estate in the Arctic after all.
I am afraid, however, that this debate will never reach consensus and be settled among the American people or the international community.
So true Rodney. So-called climate change is not a scientific debate but a political one. If anyone doubts that just look at the political allegiance of the pro and con side of the argument. It is the most amazing behavior I have ever seen from otherwise reasonably intelligent folk. As an avid reader of Wheeler, I knew many years ago all the clamor about global warming was propagada. I understood the true nature of the con when Gore and his buddies created the carbon credit exchanges. You can usually figure out what is going on by following the money.
Listen folks, we are ending a 500 year cycle and entering a cooling period. These cycles are extremely well documented and if you know anything at all about the history of climate changes over the millenia, it should be abudantly clear what tripe has been dished out on the subject the last several years. Just my two cents.
Okay, I’ll tip my hand here…
For those, like me, who take the Hebrew/Christian Scriptures seriously, we have this to consider, from Genesis 8:22 (NASB translation):
“While the earth remains, Seedtime and harvest, And cold and heat, And summer and winter, And day and night Shall not cease.”
Amen, brother!
In my experience, very very few people who present arguments about climate change actually carefully read peer-reviewed scientific papers on the subject.
I have. I also know a few folk on both sides of the argument who are competent principal investigators. NONE of them make dogmatic statements regarding the clarity of the science, including anthropogenic causation. The ” data massaging” of a number of NOAA papers is well documented. Go read the statistical method work-up of their papers and you cannot miss it.
The Vostoc data, done by scientists with no agenda imho, demolishes the C02 causation thesis. Read the analysis.
I stand by my view on the political component of this topic.
Every single person I know who pushes the climate change agenda is liberal in their political viewpoint.
Every sceptic or open to either viewpoint is conservative or libertarian.
That of course is just my own experience.
The facts are already settling the matter my friend. And they will just keep on a-rollin’ in. Just as they have since the 1970’s. It’s simple science, based on real data, real events happening all the time, and real understanding of co2 pollution of an atmosphere, and a real understanding of what happened when co2 levels got that high in the past. Not good things.
This is not political issue. This is a scientifically backed real world issue. Facts still matter in the real world, and can and will kill you. The first and most critical fact to understand is that we are adding 110 million tons of co2 to the atmosphere every day, and the rate is rising not falling. The second scientific fact to understand is that we know perfectly well what happens when the co2 density rises like this (for whatever reasons): the atmosphere will retain more heat, and get hotter. We know this because (a) exactly this process has played out on the planet before, and (b) we know the science of gases and thermodynamics to predict what happens, and we can model it and proof it on top of the geological record evidence. These are facts; this is what just relative basic science, with no politics, tells us with certainty. These are the facts that Shell oil scientists told the Shell executives starting in the early 1960’s (those communications have been leaked, and are fact), which in turn led to the most evil disinformation campaign in the history of mankind on earth: merely striving to assure their short term business success, at a potential cost (identified by their own scientists in the leaded memos) of the habitability of most of the planet.
The UN scientific analysis just cited that at 2 degree C rise (expected now by 2040), the impact on humanity will “only” be in the tens of millions dead (okay we all die: EARLY death). But 2 degree C rise is laughably 100% certain, because nothing is being done and we are polluting at an ever increasing rate. 4 degree C by 2100 is the very high probability area we are headed to based on the leading edge science and our lack of any action in the foreseeable future. New factors discovered but not properly and fully accounted for yet in the models indicate that it’s going to be yet worse and yet faster: the rising albedo of the earth, the melting of the permafrost, and just in the last few week a discovery that the ocean has been consuming much more heat that we understood (helping to slow the atmosphere temperature rise, but providing evidence that overall heat levels are already higher than we’ve been accounting for; the ability of the ocean to mitigate is is already below what we thought it would be at this point). What we know for a scientific fact is the temperate is going to go up lots, and incredibly fast. And of course, we have piles of data showing it’s already happening, and the rate of increase is increasing. Maybe something comes up as a serious mitigation that has been overlooked or misunderstood. But not yet. Not in the serious science world.
The science is clear: 4 degree C and the world is hugely modified. We know this because the earth has been that hot before, and for the exact same reason: more co2 in the atmosphere, and we know from the geologic record what it was like. Science, nothing to do with politics. The central belt of the planet will not be habitable at those average temperature levels (heat, drought), and that will extend quite far north and south. That’s simple science folks; we know what heat/humidity conditions allow for human and plant life, and what results in a largely dead dessert. The last time the earth was this hot, the seas were 100’s of feet higher and there was not a Greenland or Antarctica icecap; both of those are VERY MUCH IN PROCESS of melting down this moment (absolute scientific fact people, not politics). When you hear talk of 10 feet of sea rise, just laugh, because those #’s do NOT account for the vast volume of water in those ice caps coming to the ocean. Such a # is 10-50x vs. what’s actually going to happen over the next 80 years. More critically, the last time the earth heated like this, an ecological reset occurred: 97% of the diversity of life on earth perished. If that doesn’t give you pause, I don’t know what will. Maybe it’ll be a lot less this time: maybe only 50%? 30%? Even at those numbers, the toll is apocalyptic, for the simple reason that this implies vast areas where humanity thrives due to local agriculture will be dead zones. And the vast numbers of humanity in those zones will have to flee. Human kind has never experience migrations of this size, and then throw in our political status as a kind of gasoline on top of millions, possibly billions being forced to migrate, or die in place.
The attempts to make this a political issue are nothing more than efforts by the industries that will be impacted if we insist that our global atmosphere is a critical commons required for survival of life as we know it on this planet, and therefore we (humanity) cannot continue to utilize it as a free dumping grounds for 110 million tons of co2, every day. (BTW, it’s both oil/gas/coal and meat as food industries that are driving the vast amount of the pollution.) They don’t want to have their profits impacted, and like good capitalists focused on their fiduciary duty to maximize shareholder value, they are fighting that tooth and nail including outrageous propaganda through shill “scientists”. “Create confusion, obfuscate, foment discord” is the strategy to slow down awareness and action, and boy is it working.
I’ve done my fiduciary duty here. Consider yourself warned. The science is crystal clear. I encourage all to study that science via the many reports coming from reputable scientific organizations objectively. Investigate the scientific communities take on the legitimacy of anyone/everything making claims about this, because the disinformation is thick and constant; oil/gas is not playing games here. Any real solution requires that their industry dies. They are fighting for their corporate lives.
Stay alert for further corroborating (or not) evidence. Think about the growing size and frequency and devastating economic impact of super storms hitting world wide, think about the CA wildfires right now, largest in history, after the hottest summer in history. How much hotter and drier until the Amazon burns? That’s probably 20-30 years away, but it will happen with certainty.
And lastly, think long term and strategically. Think about what happens if in fact we are headed to a future like 262 million years ago (the fact of what we are doing and the science says we are), and its coming over the next 80 years. Think about how populations will be forced to respond, and the resulting…situation, as they either up and move…or die in place (no food, no water). Getting caught up in that is not likely to be beneficial to your down stream families health and happiness.
Or…don’t. I’ve done my job here, over and out, I won’t comment on it again. I sincerely hope I’m dead wrong. I have no such hope, I can say perfectly honestly; I can only legitimately hope that some mitigating factors cause it all to happen over a longer time period, perhaps 200 years instead of 80. I hope everyone is able to find a safe place to live for their family in the future. Best of luck.
Biased Garbage into climate models that don’t work = Garbage Out! All your posts are the results of Garbage Out!
Government Grants have institutionalized the Garbage Out ! This huge group of so called Scientists have to justify there exitance to continue to receive said Grants therefore you continue to get models that don’t work and the Garbage they produce!
As I recall the Garbage they were producing in the 1970’s was that we were to Freeze Over not heat up! Then they switched to Global Warming… when that didn’t produce the desired warming according to the models at the rate the models spewed…. the language was changed to simply Climate Change… well they found the perfect language to brain wash the most people by calling it Climate Change!
Why? Because you can’t disprove climate change it such a broad term… The Fact is the Earth’s Climate always changes it has for Billions of years. It’s just the normal cycle of the Planet… No Human is going to stop or change that cycle!
The Russian model has been the most accurate… a FACT! All the others are garbage! Russia… Russia… Russia…!!!
Come on… you can say… 1, 2 , 3… Russia… Russia… Russia…!!!
I am at a complete loss to understand how anyone can claim with a straight face that there is no political component to the climate debate. There clearly is. On both sides.
The UN is a thoroughly corrupt and despicable institution. Look at what they have done to Haiti and South Sudan. You loose all cedibility with me by citing that criminal cabal. Be careful to vet your sources people.
Agree 100%… Anyone who cites the UN on Science has zero credibility with me as well.
The UN is the most anti-Semitic body ever created and in existence today!
no one did that i’m aware. Facts are not political. Real science is not political. Just as Lara’s EW/TA work is not political…even though there’s piles of politics “around” the stock market.
Kevin,
I am not going to take a position in the debate on this forum / blog, at least. But I want to thank you for the information you pass along and for your sense of responsibility in doing so. I appreciate people who take moral responsibility seriously. Thanks again.
That’s very kind of you Rodney. I sincerely appreciate it.
Ha!
That’s fast! I haven’t even recorded this weeks video yet!
Drats! Not that silly wabbit.