A little more upwards movement was expected from the short-term hourly Elliott wave count.
Summary: Overall, now expect a bounce to last about two to a few weeks. For the short term, the last open gap may offer support at 2,685.43.
A primary degree correction should last several weeks and should show up on the weekly and monthly charts. Primary wave 4 may total a Fibonacci 8, 13 or 21 weeks. Look for very strong support about the lower edge of the teal trend channel on the monthly chart.
Primary wave 4 should be expected to exhibit reasonable strength. This is the last multi week to multi month consolidation in this ageing bull market, and it may now begin to take on some characteristics of the bear market waiting in the wings.
The final target for this bull market to end remains at 3,616, which may be met in October 2019.
New updates to this analysis are in bold.
The biggest picture, Grand Super Cycle analysis, is here.
Last published monthly chart is here, video is here.
ELLIOTT WAVE COUNT
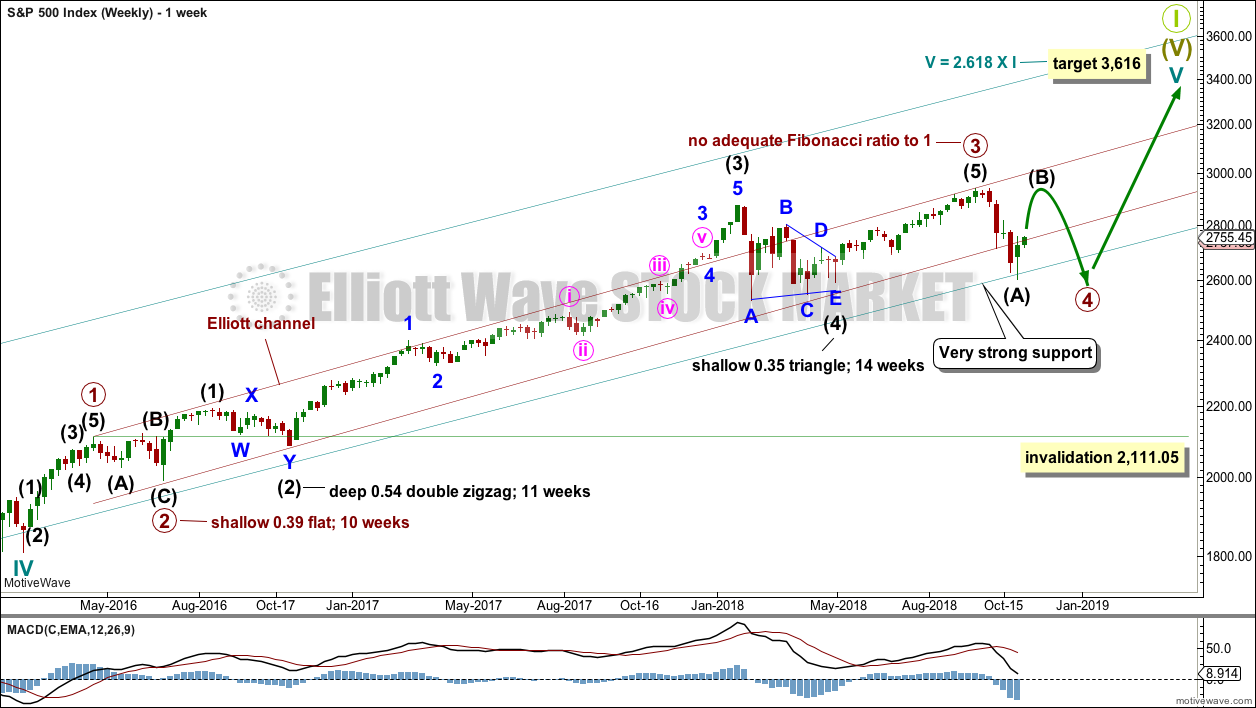
WEEKLY CHART
Cycle wave V must complete as a five structure, which should look clear at the weekly chart level and also now at the monthly chart level. It may only be an impulse or ending diagonal. It is clear it is an impulse.
Within cycle wave V, the third waves at all degrees may only subdivide as impulses.
Within primary wave 3, there is perfect alternation and excellent proportion between intermediate waves (2) and (4).
The maroon channel is drawn about primary degree waves. The first trend line is drawn from the ends of primary waves 1 to 3, then a parallel copy is placed upon the low of primary wave 2. The overshoot of the upper edge of this channel by the end of intermediate wave (3) looks typical. For the S&P, its third waves are usually the strongest portion of an impulse; they often exhibit enough strength to overshoot channels.
Primary wave 4 now has an overshoot on the lower edge of the channel. This is acceptable; fourth waves are not always neatly contained within channels drawn using this technique.
Primary wave 4 may find very strong support about the lower edge of the teal channel, and it looks like this is from where price may be bouncing. This channel is copied over from the monthly chart and contains the entire bull market since its beginning in March 2009. While Super Cycle wave (V) is incomplete, this channel should not be breached at the weekly chart level.
Primary wave 4 may not move into primary wave 1 price territory below 2,111.05.
When primary wave 4 may be complete, then the final target may be also calculated at primary degree. At that stage, the final target may widen to a small zone, or it may change.
At this stage, the expectation is for the final target to be met in October 2019. If price gets up to this target and either the structure is incomplete or price keeps rising through it, then a new higher target would be calculated.
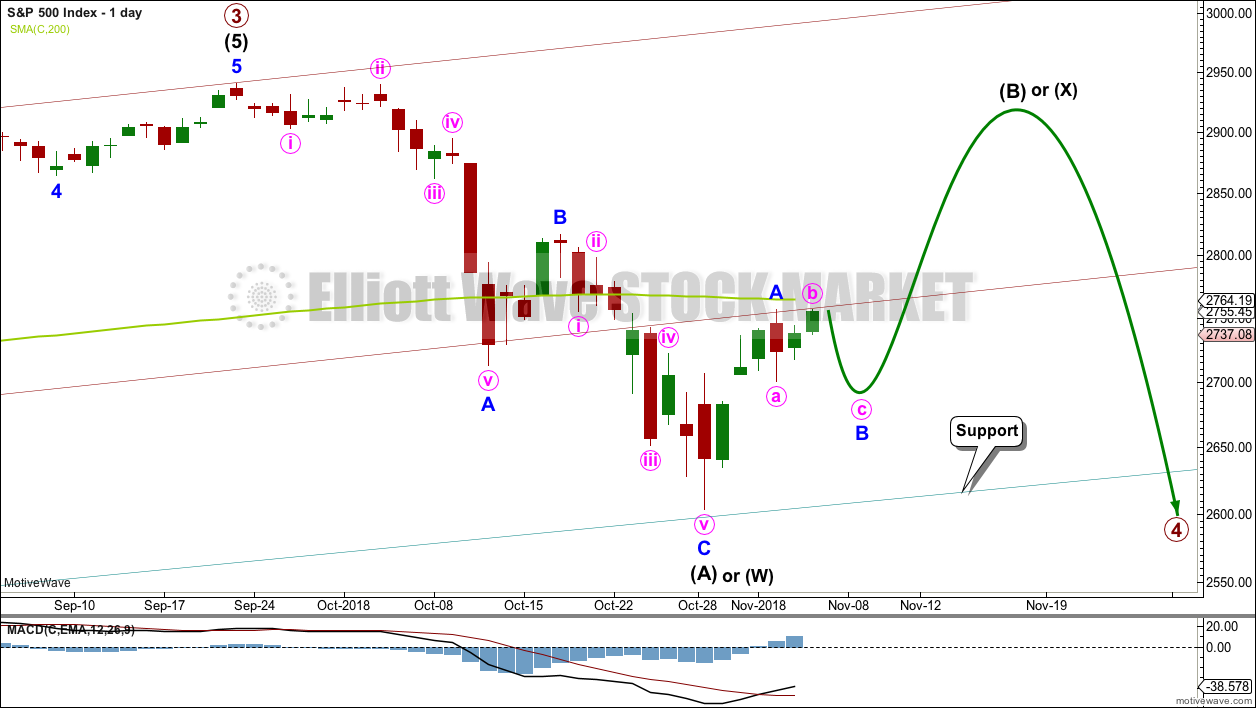
DAILY CHART
Primary wave 4 would most likely end somewhere within the price territory of the fourth wave of one lesser degree. Intermediate wave (4) has its price territory from 2,872.87 to 2,532.69. Within this range sit the 0.236 Fibonacci ratio at 2,717 and the 0.382 Fibonacci ratio at 2,578.
The 0.382 Fibonacci ratio would expect an overshoot of the teal channel. This may be too low; price may find support at the lower edge of the channel. However, as primary wave 4 should be expected to exhibit reasonable strength, it may be able to overshoot the channel and that would look reasonable. This possibility is now more seriously considered.
Primary wave 2 unfolded as a shallow regular flat correction lasting 10 weeks.
Intermediate wave (A) may be seen as a complete zigzag. A zigzag down to start primary wave 4 may also be labelled intermediate wave (W).
If intermediate wave (A) or (W) subdivide as a zigzag, then primary wave 4 may unfold as a double zigzag, double combination, flat or triangle. Of all these possible structures a flat correction would be least likely as that would not offer structural alternation with the flat correction of primary wave 2.
A double zigzag would also be less likely as that would require a very large overshoot of the teal trend channel, and it would also see a relatively brief primary wave 4.
A triangle would be fairly likely even though intermediate wave (4) was a triangle. This does not reduce the probability of primary wave 4 also subdividing as a triangle.
A double combination should always be considered if a triangle is possible, and this would also offer reasonable alternation with primary wave 2.
All structural options (except a double zigzag) which begin with a zigzag down would expect a high bounce for intermediate wave (B) or (X). Intermediate wave (B) or (X) would most likely subdivide as a zigzag.
Within a triangle for primary wave 4, intermediate wave (B) would most likely be about 0.8 to 0.85 the length of intermediate wave (A) giving a target range from 2,873.54 to 2,890.38. Intermediate wave (B) of a running triangle may make a new high above the start of intermediate wave (A).
Within a double combination for primary wave 4, intermediate wave (W) may be the first complete structure in a double. Intermediate wave (X) may be a very high bounce and may make a new high above the start of intermediate wave (W). There is no minimum requirement for the length of intermediate wave (X), and no maximum limit.
For both of the more likely options of a triangle or combination for primary wave 4, price may continue to find support about the lower edge of the teal trend channel. This would give the wave count the right look at the monthly time frame.
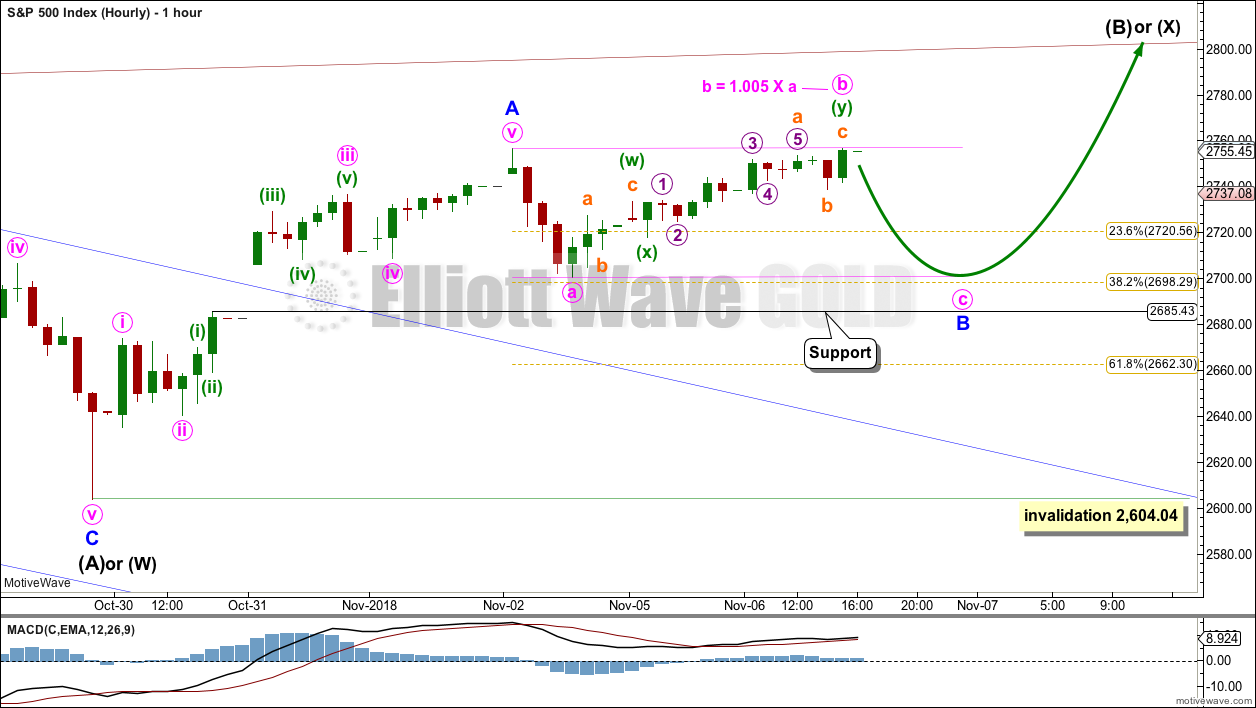
HOURLY CHART
Intermediate wave (B) or (X) would most likely subdivide as a single or multiple zigzag to achieve a high bounce.
If intermediate wave (B) or (X) subdivides as a zigzag, then minor wave B may not move beyond the start of minor wave A below 2,604.04.
The gap may remain open, providing support for minor wave B.
Minor wave B may subdivide as any corrective structure. It would most likely be a time consuming sideways correction. It may last a week or more.
Minute wave a looks best as a three wave structure on the five minute chart. Minute wave b has now reached just over 1 times the length of minute wave a; minor wave B may be unfolding as a regular flat correction.
It is also possible that minute wave b may continue higher to reach 1.05 the length of minute wave a at 2,759.36; this is the requirement for minute wave b within a flat correction. The common range for minute wave b within a flat correction is from 1 to 1.38 times the length of minute wave a, giving a range of 2,756.55 to 2,777.87.
Minor wave B may also be unfolding as a running triangle.
ALTERNATE WAVE COUNT
DAILY CHART
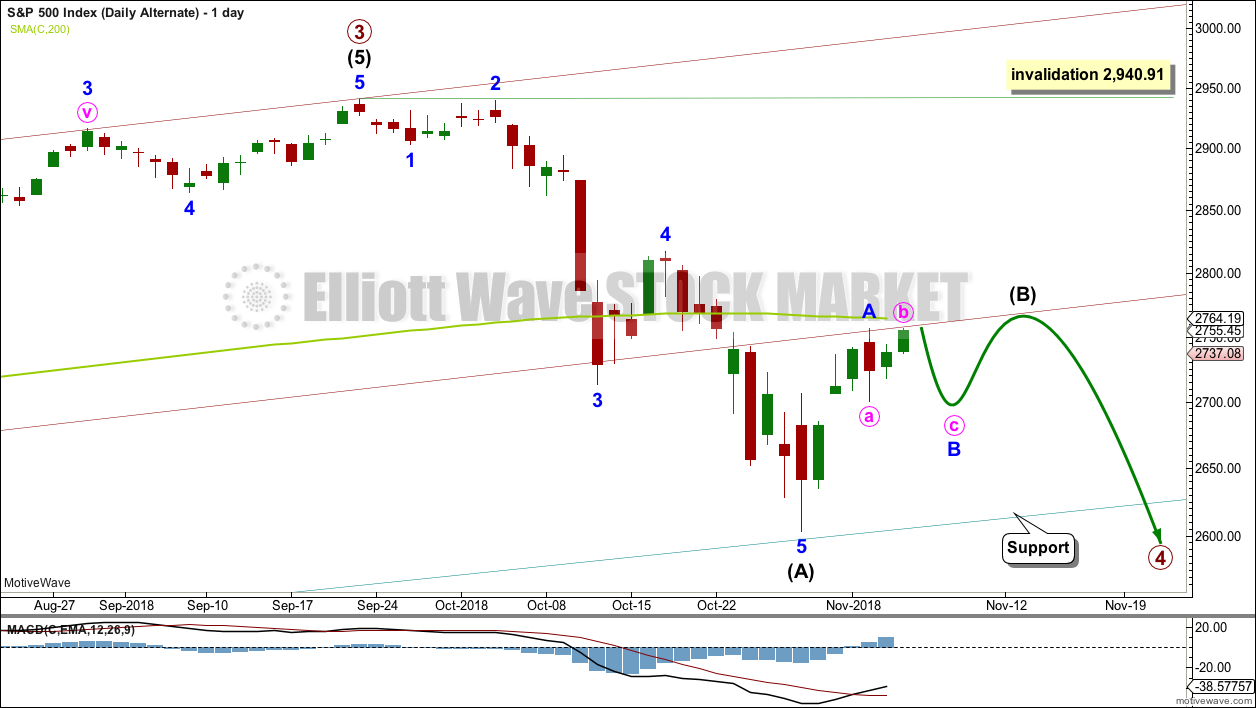
It is also possible to see the downwards wave labelled intermediate wave (A) as a complete impulse. If intermediate wave (A) is a five wave structure, then intermediate wave (B) may not move beyond its start above 2,940.91.
Primary wave 4 may be a zigzag to provide structural alternation with the flat correction of primary wave 2; intermediate wave (A) within a zigzag must subdivide as a five wave structure.
Primary wave 4 may not move into primary wave 1 price territory below 2,111.05.
This wave count would expect to see at its end a large overshoot of the teal channel for the end of primary wave C, so that it moves below the end of primary wave A and avoids a truncation. This looks less likely; this is one reason why this wave count is judged to have a lower probability and is labelled as an alternate.
HOURLY CHART
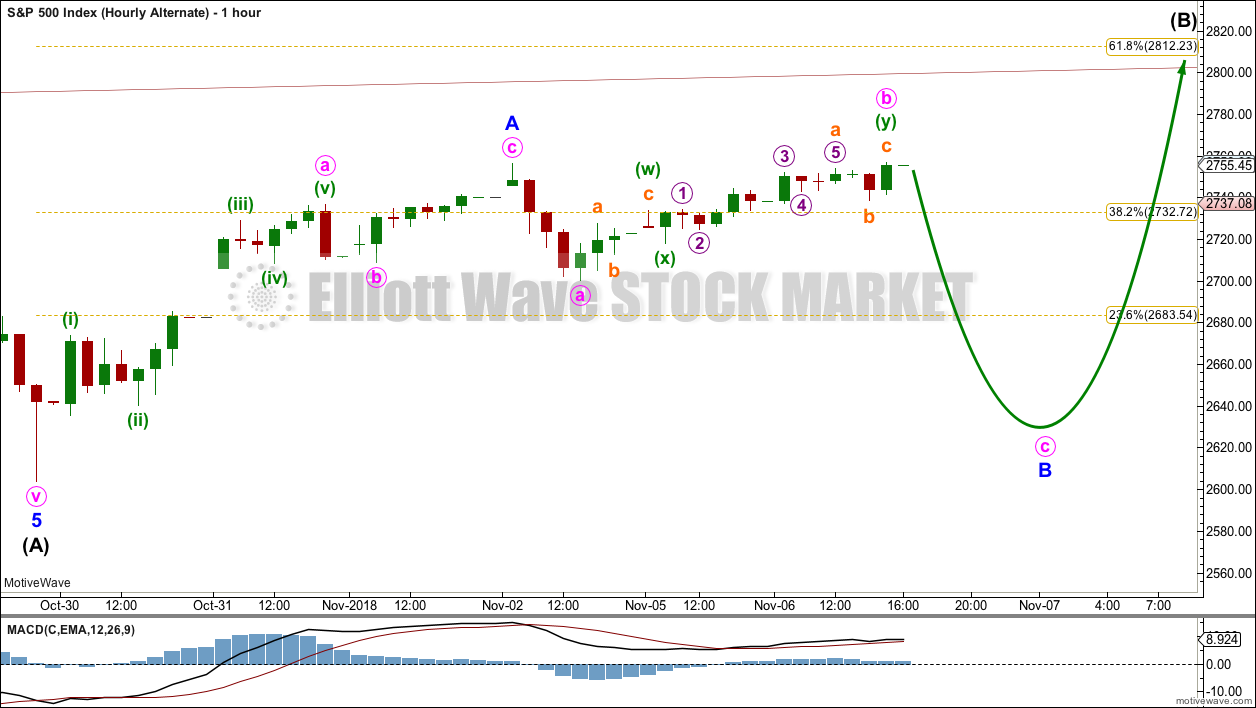
Intermediate wave (B) may unfold as one of more than 23 possible corrective structures. B waves exhibit the greatest variety in structure and price behaviour. They can be very complicated time consuming sideways corrections, or equally as likely they can be quick sharp zigzags.
To take up time and move price sideways, intermediate wave (B) for this wave count may most likely be a complicated sideways structure such as a flat, combination or triangle. A longer lasting intermediate wave (B) would give primary wave 4 better proportion to primary wave 2 in terms of duration.
Intermediate wave (B) may have begun with a zigzag upwards. If minor wave A subdivides as a three, then intermediate wave (B) may unfold as a flat, combination or triangle.
Minor wave B would most likely be a deep correction, and it may make a new low below the start of minor wave A if intermediate wave (B) unfolds as an expanded flat, running triangle or combination.
TECHNICAL ANALYSIS
WEEKLY CHART
Click chart to enlarge. Chart courtesy of et=”_blank”>StockCharts.com.
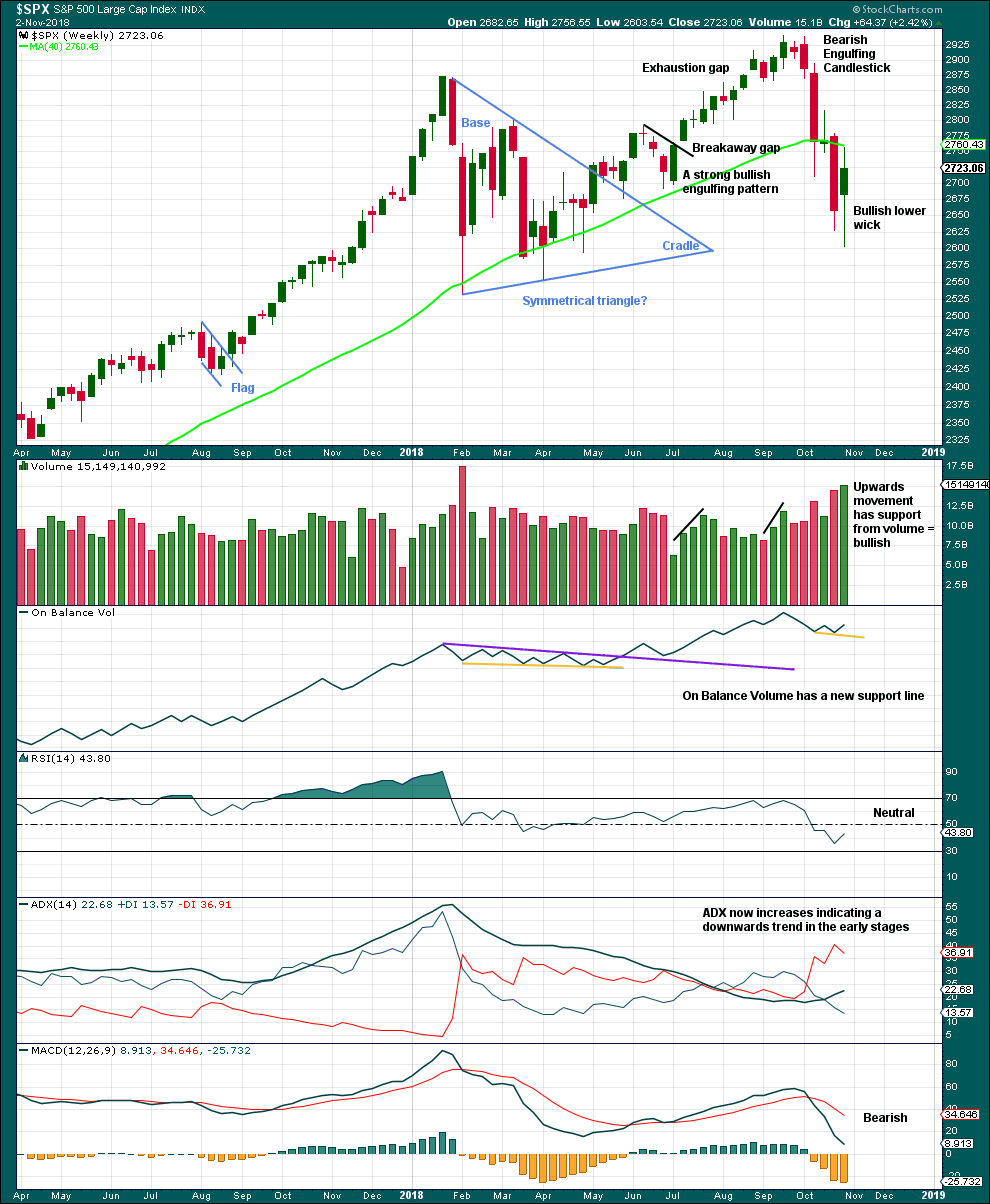
Another long lower wick and support from volume last week looks bullish again.
The support line for On Balance Volume is removed and redrawn.
DAILY CHART
Click chart to enlarge. Chart courtesy of StockCharts.com.
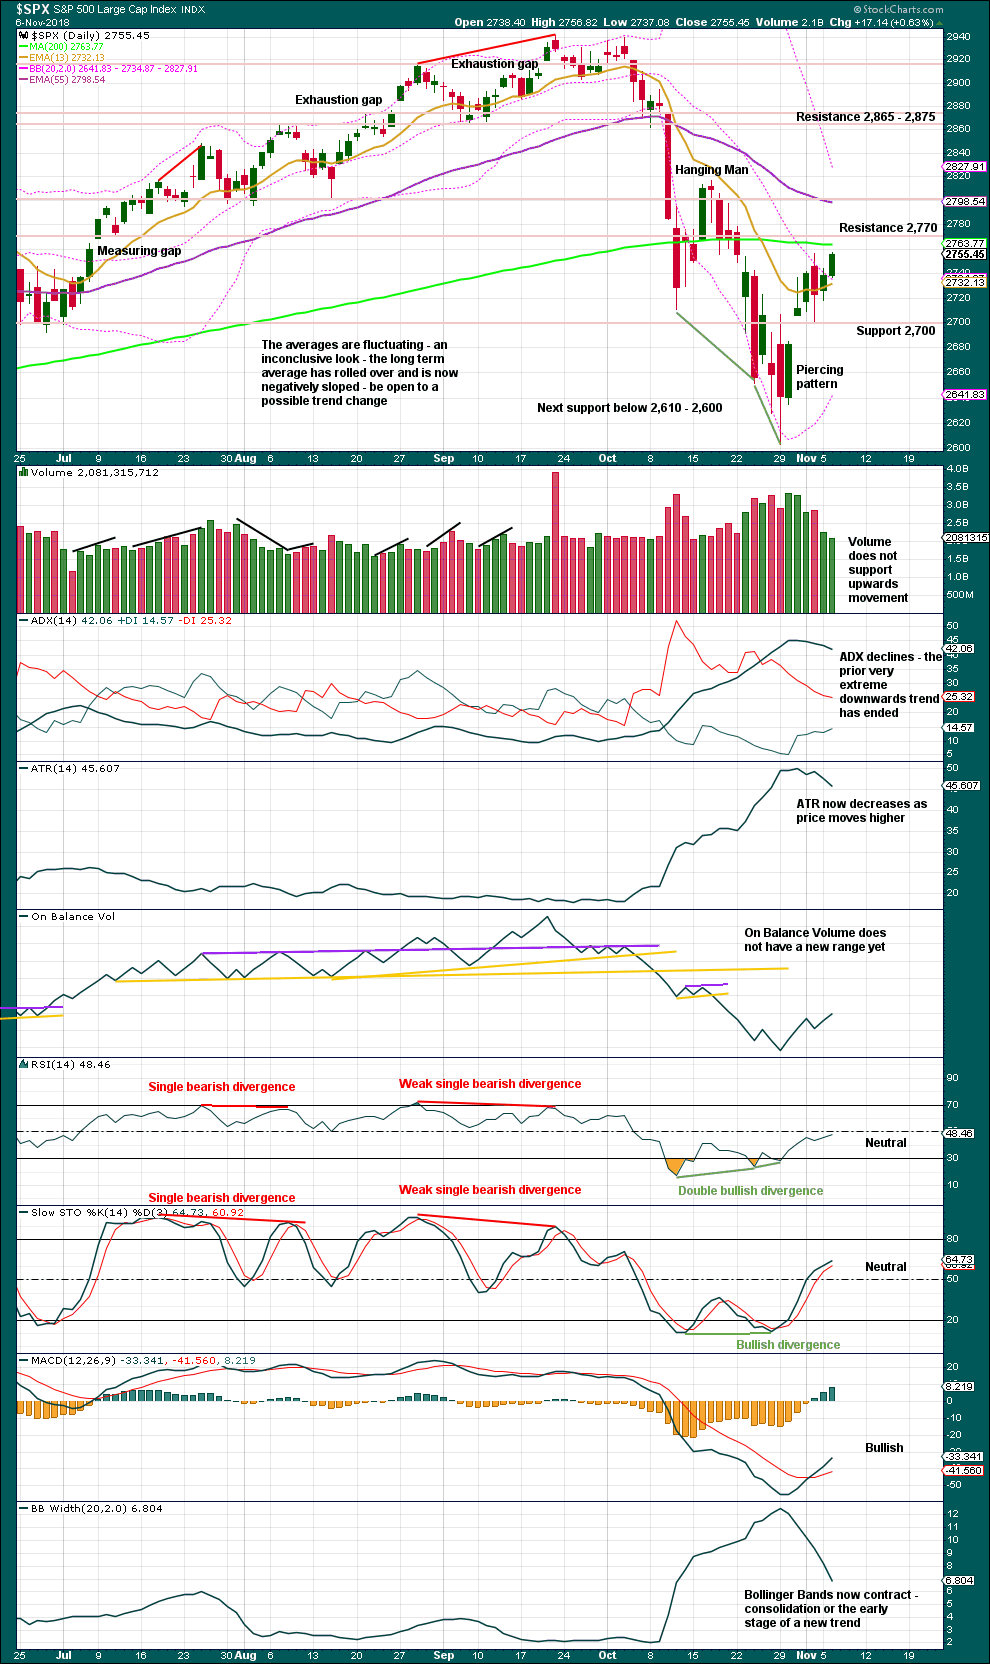
For the short term, expect support about 2,700 and just below that at the last open gap at 2,685.43.
Rising price with light and declining volume has been a feature of this market for years. The lack of support from volume today for upwards movement does not mean that price cannot continue to rise tomorrow.
Look for resistance above, at about 2,770.
BREADTH – AD LINE
WEEKLY CHART
Click chart to enlarge. Chart courtesy of StockCharts.com.
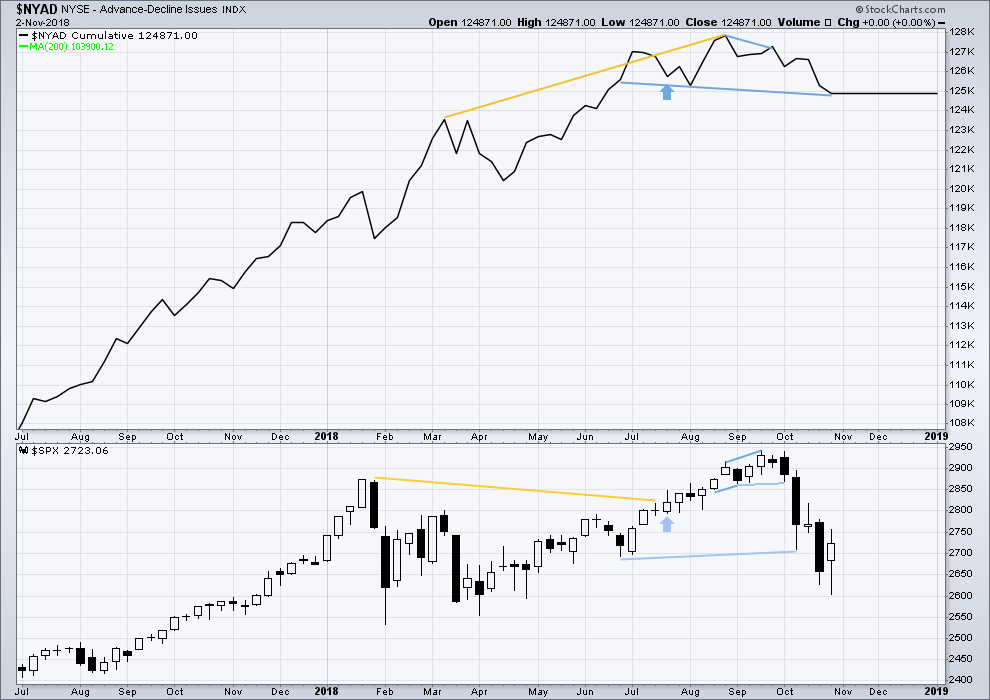
Falling price has support from a decline in market breadth. Breadth is falling in line with price. There is no divergence either way.
DAILY CHART
Click chart to enlarge. Chart courtesy of StockCharts.com.
There is normally 4-6 months divergence between price and market breadth prior to a full fledged bear market. This has been so for all major bear markets within the last 90 odd years. With no longer term divergence yet at this point, any decline in price should be expected to be a pullback within an ongoing bull market and not necessarily the start of a bear market. New all time highs from the AD line on the 29th of August means that the beginning of any bear market may be at the end of December 2018, but it may of course be a lot longer than that. My next expectation for the end of this bull market may now be October 2019.
Breadth should be read as a leading indicator.
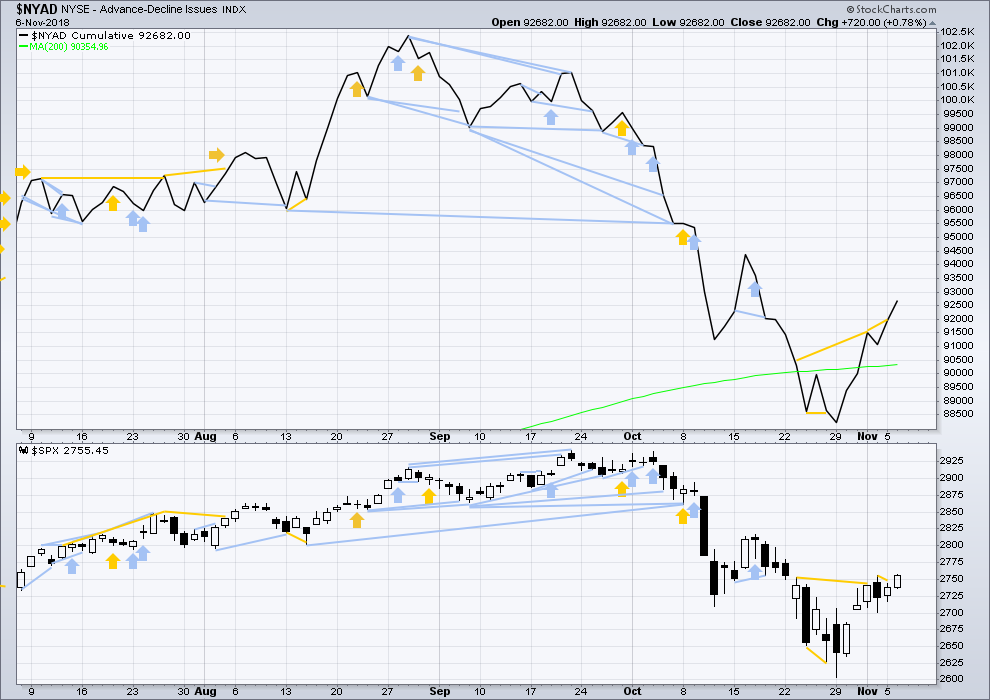
Bullish divergence noted in yesterday’s analysis has now been followed by an upwards day. It may be resolved here, or it may need another upwards day to resolve it.
Today’s rise in price has support from rising market breadth. There is no new short term divergence.
VOLATILITY – INVERTED VIX CHART
WEEKLY CHART
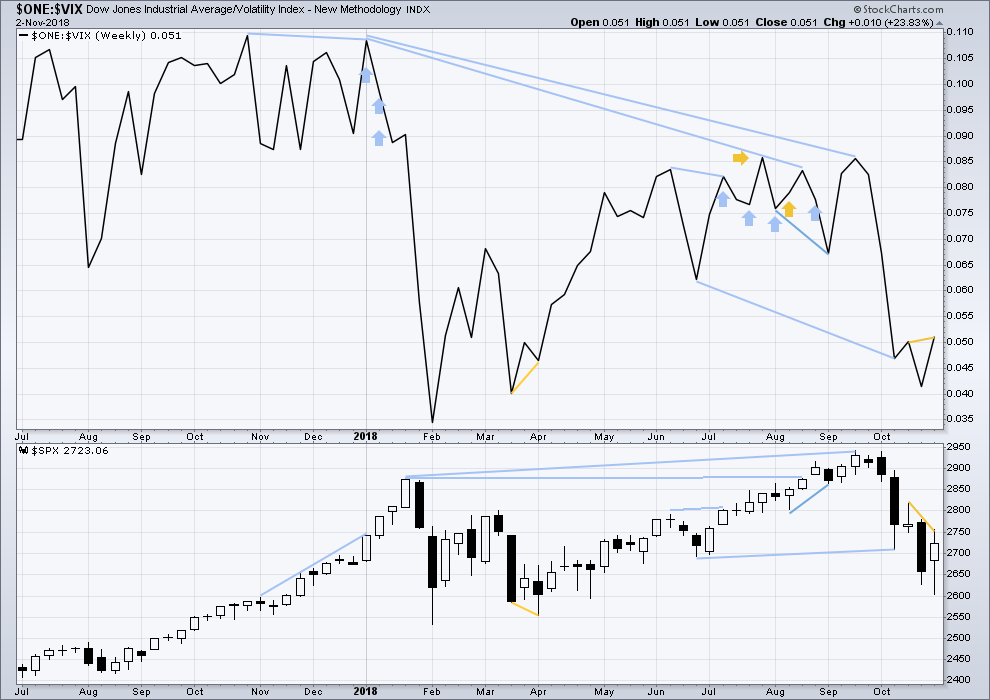
Click chart to enlarge. Chart courtesy of StockCharts.com. So that colour blind members are included, bearish signals
will be noted with blue and bullish signals with yellow.
Last week inverted VIX has made a new high above the prior swing high two weeks ago, but price has not. This divergence is bullish.
DAILY CHART
Click chart to enlarge. Chart courtesy of StockCharts.com. So that colour blind members are included, bearish signals
will be noted with blue and bullish signals with yellow.
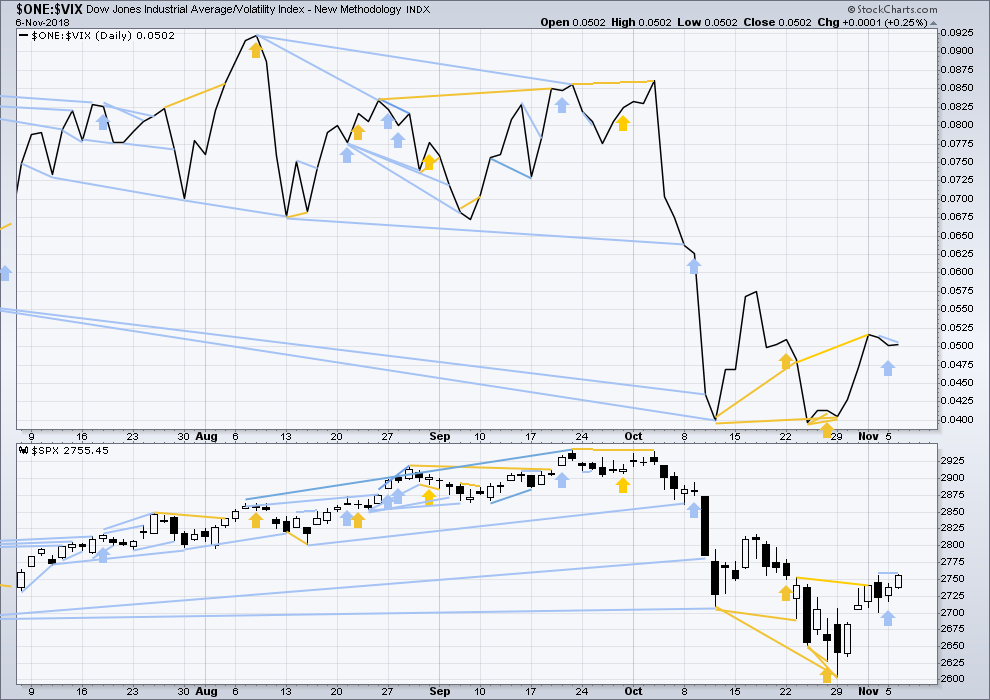
Normally, volatility should decline as price moves higher and increase as price moves lower. This means that normally inverted VIX should move in the same direction as price.
Bearish divergence noted in last analysis has not been followed by any downwards movement. It may have failed, or it may be an earlier warning.
There is another instance of bearish divergence: price has made a slight new high above the high two sessions prior, but inverted VIX has not. The rise in price today does not come with a normal corresponding decline in VIX.
DOW THEORY
The following lows need to be exceeded for Dow Theory to confirm the end of the bull market and a change to a bear market:
DJIA: 23,344.52.
DJT: 9,806.79.
S&P500: 2,532.69.
Nasdaq: 6,630.67.
ANALYSIS OF INTERMEDIATE WAVE (4)
TECHNICAL ANALYSIS
Click chart to enlarge. Chart courtesy of StockCharts.com.
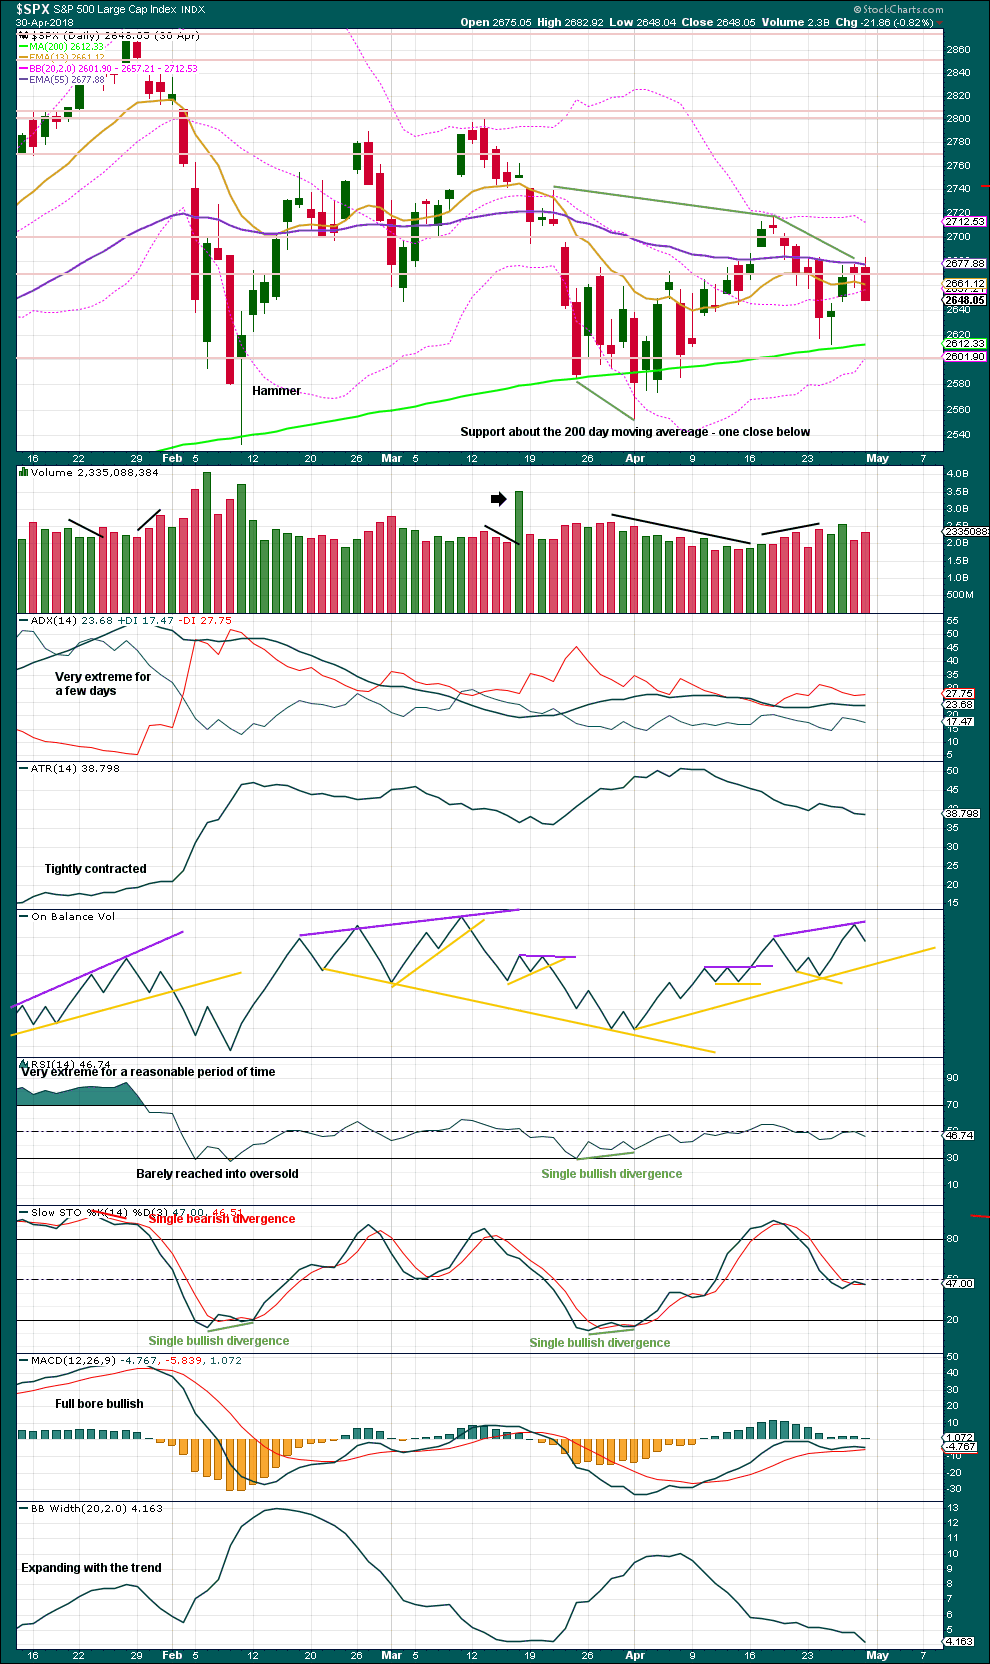
Intermediate wave (4) was a large symmetrical triangle. The deepest wave was the first wave. At its low there was a clear candlestick reversal pattern and bullish divergence between price and Stochastics.
RSI barely managed to reach into oversold.
The current correction for primary wave 4 may behave differently, but there should be some similarities.
It is expected that primary wave 4 may be stronger than intermediate wave (4).
VIX
Click chart to enlarge. Chart courtesy of StockCharts.com.
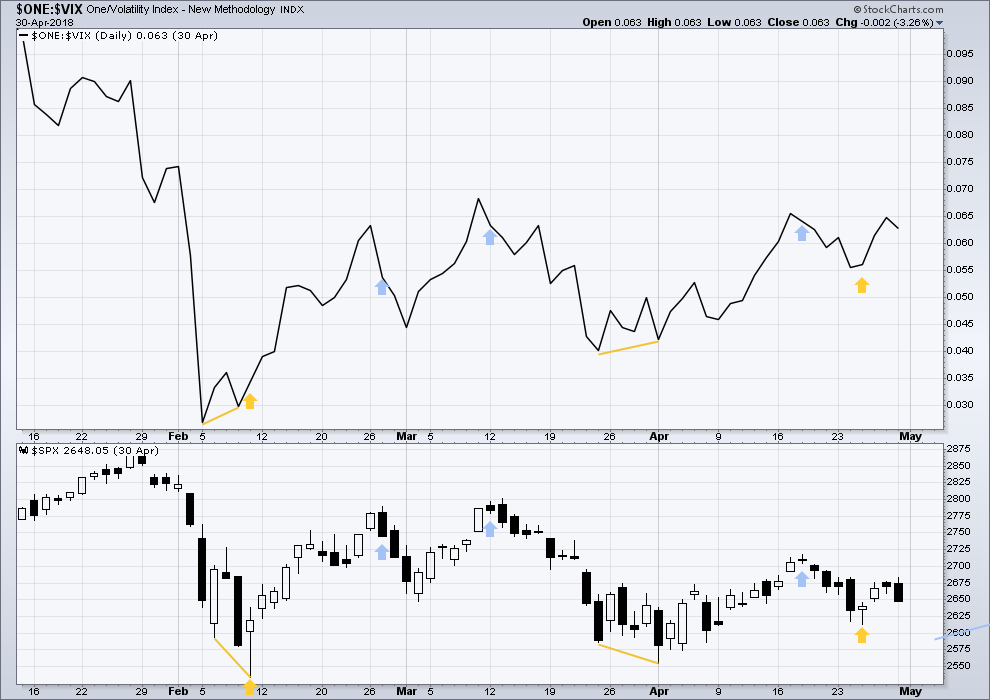
This is a daily chart.
At the two major lows within intermediate wave (4), inverted VIX exhibited single short term bullish divergence.
At highs within intermediate wave (4), inverted VIX exhibited one single day bullish divergence with price.
AD LINE
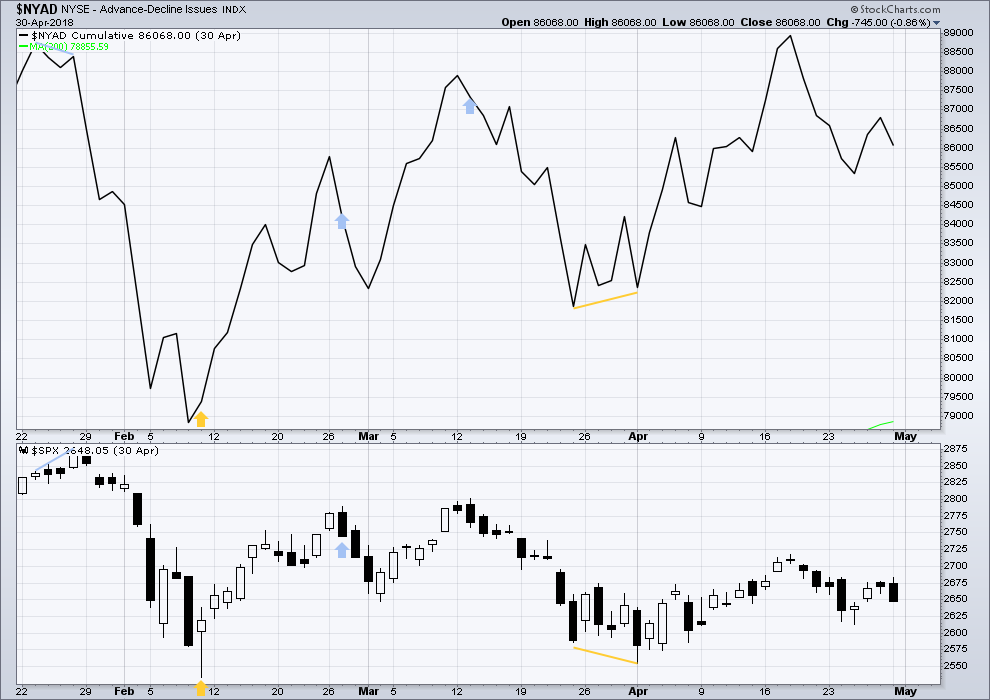
Click chart to enlarge. Chart courtesy of StockCharts.com.
This is a daily chart.
At the two major lows within intermediate wave (4), there was bullish divergence between price and the AD line. At the two major highs within intermediate wave (4), there was each one instance of single day bearish divergence.
Published @ 09:30 p.m. EST.
—
Careful risk management protects your trading account(s).
Follow my two Golden Rules:
1. Always trade with stops.
2. Risk only 1-5% of equity on any one trade.

Ok did not think B-B would go this far. My best guess is 2823- 2830 in the futures market will start the next B-C wave down. This will bring us down slightly below 2700.
Maybe 2685
Then we will finish this B wave rally to 2875 of 2915
That will complete Corrective B move
Then we will Start C down
Then it will be a question if we can hold the lows at 2606 or if we break lower to 2450 to 2200 depending correction 4
I had a theory as I was trying to short it yesterday that maybe the reason B wave is so strong is because it’s a B wave inside of a B wave. Thus giving it more amplitude. Because if you think about it, it is traveling with the trend.
in any case the speed at which this move is traveling the cycles are moving much quicker than expected. Like when we have wave B-C how many days will it last?
2 or 3 days. Then a massive rally to finish B what maybe 5 or 6 days.
If you ask me B wave rally is nearing completion. Another week and a half. Then we will be headed back to the lows 2600.
This could happen by early dec.
The question I have is how low will This major C take us. A lot of people are jumping back in the market because they say the election is over and they will think that this rally is real. I’m sure they will be caught off guard by the move down if we break 2600.
Also if this major C move does break us down much further like 2400 or even 2200 then you will have a lot of people hurting because they are expecting 2019 to be much more calm that 2018. And to me it’s looks to get a lot worse as far as volitlity.
Any way speaking of corrections people are so happy that we held the bottom of 2016 trend line. This was started after wave 3 ended of this bull market. Why on earth would we hold the trendline after wave 5 completed. We don’t hear people talking about the 2007 trendline do we? Because it broke when the market topped.
Anyway if we hold the trendline and the correction lows this should be and extended wave 5 would it not.
This would likely give us another 1000 points on the s&p to the upside.
This would just extend this cycle for about on more year and we would have a year like earily 2016 to 17. Then a major reset. Anyway what ever the case this market is coming to an end soon than later.
Anyone here use the Martin Armstrong “Socrates” trading system?
It looks like minute b was over as a quick shallow zigzag.
A target is calculated for minute c.
Aha!!! I’ve been wondering about the rather extended time length of this intermediate B. This looks and feels much better to me re: time proportionality.
I’ll have to also consider moving everything within intermediate (B) all down one degree. This could be just minor wave A completing.
I’ll be taking a look at it on weekly and daily charts to make a decision on that idea.
I think we are in Minor B here
Damn Kevin, pretty scary!
Yes it is Debbie. And it’s 100% human nature to flee from the knowledge. But the science is clear. As my old boss told me long ago, “Kevin!!! Face the future! Don’t back into it and let it break over your head!”. Well, science is telling us with clarity that the future ain’t gonna be like the past. If you didn’t catch the article link I posted yesterday, I can’t over recommend that you read it to find out the basic reality of the situation, and how bad it is going to be in so many dimensions. Focusing on “only” the sea level rise would be a horrendous mistake. It’s the heat and drought that is going to reshape the world. If you search for “what the world will look like 4 degree warmer” you’ll find a rather interesting map. 4 degree C rise in temps is virtually certain. 6-8 is likely. Ignoring this would be like finding a lump in your neck and being too scared to go to the doctor. Best of luck.
I think the market is driven by fundamentals along with a whole host of other things. They all drive / impact / influence the psychology of the masses. EWT says the psychology of the masses directly drives the markets. So if fundamentals impact psychology, they also impact the market. What the market technician must do is not let any one of the psychological influences upon the masses dictate his or her analysis. Some market technicians choose to avoid every bit of news as a guard. I just can’t live that way. I love to know what is going on in my local area, state, county and world. But that is just me.
As far as fundamentals, my guess is that they are going to keep getting better for a long time. My only hesitation is Lara’s expected end of Grand Super Cycle 1 in late 2019. If that proves true, watch out and run for the hills! You’ll see me in the mountains.
While I won’t be headed out by then…I am considering bailing to Alaska at some point myself. Cash in my grossly over valued San Francisco home, and get to a spot that isn’t going to be an ecological wasteland by 2050. Not that I’m going to last that long but…along the way, it’s going to be very ugly, particularly with everybody on the move north to find food and water packing AR15’s. Those with material wealth and/or land who don’t get out of Dodge in time will find that the hordes will happily take everything they own. It’s going to be surreal. This kind of heating event occurred 262 million years ago, by the way. 97% of all life on earth perished. Giant reboot for the Earth’s ecology. That’s what is coming. At an absurd speed, “geologically” speaking, since it’s driven by our own atmospheric pollution, which is currently running at a cool 110 million TONS of CO2 EVERY DAY. And rising. Educate yourselves folks, and make your plans. Knowledge is power.
Oh, and I guess the PS is…there’s never going to be a GSC wave III. Wave II will take “price” to zero, and the “markets” will be history.
I thought I had a pretty good handle on bear market “C” waves.
I have to say the ferocity of the ones we have seen recently is unlike anything I have ever seen. We are setting up for one helluava wave down it would appear…..remember the red candles of the down-trend are going to be much nastier than the ones printed in the ramps higher….Yikes!
I would agree
The only thing i disagree on is Lara’s 3600 target
Her target is higher then anyone out there!
It’s higher then anyone on Wall street.
Heck it’s higher then the most Bullish analyst out there.
I don’t think we get that high in this cycle
It is rather high isn’t it.
At this stage I can only calculate a target at cycle degree.
When primary wave 4 is over then I can calculate the target at primary degree. At that stage it may change, or I’ll add a lower target and have two.
What’s trading with the trend? All depends on the time frame you are trading in. For multi-day to perhaps a few week type trades, I would say trading with the trend means trading with the WEEKLY trend.
Well, the SPX weekly trend using my trend indicator is still DOWN. The monthly is NEUTRAL. The daily trend has just shifted today from DOWN to NEUTRAL.
So in these conditions, as far as I am concerned, taking shorts for a multi-day/few week type of trade is trading with the current (weekly) trend. I bought back the short side of an SPX put spread right here. Feb expiry, so LOTS of time to recover on the open loss side.
Seems like some significant profit taking (a few days worth) should be starting up Real Soon Now. This has been a big move overall off the late October lows. And the 2800/1.27% extension level seems to be holding…for the moment.
I need to completely free my mind from “considerations” of fundamentals. I got the likely outcome of this election right…but my view of the likely market reaction today was dead wrong!!! Of course there’s the view that the market itself is not driven by fundamentals…but I think things are a little more subtle than that, myself.
No worries, Kevin. It’s merely a sigh of relief that the vitriol and slander of the US mid-term political campaign is over. We can now return to the regularly-scheduled vitriol and slander of the daily US news cycle.
2800 and turn down, maybe?
Probably 2811 to finish the larger B.
Mr. Market threw a curve ball with an sub wave that went sideways before the final move up.
I’m thinking 2820 but we’ll see. The 1.27/roundie at 2800 fell. 61.8% of entire A down is at 2821.5.
New pivots in play, remarkably. SPX 2800 and DJIA 2600.
A close above these levels imho seriously calls into question any expectation of a near term corrective decline.
If this is some kind of larger corrective move up, we are going back down through the next pivots as would be expected for a primary degree move….
On the SPX daily charts we have either a three wave or five wave down followed by a two wave up with MACD having bottomed and turned up. At this time, the move up from 2600 appears to be corrective from an Elliott wave perspective. That is all we know for certain. Lara has given us her insight that we are currently in a corrective move up, Intermediate B of Primary 4. Thus, if she is correct in the larger picture of days and weeks, all this up move will be retraced with some sort of test of the low at 2600 or a new low.
I don’t like to trade B waves. But C waves have proven easier and much more profitable for my style, temperament and lifestyle. Right now Lara has been pointing to 2812 to 2950+ as possible targets for Intermediate B. But Primary 4 can still morph into many corrective patterns.
Interesting. Interesting.
I should have said we have a daily 3 or 5 wave down followed by a 3 wave up.
In case anyone cares, I’m ALL IN SHORT.
Not covering until 17k Dow,
2 weeks from now.
BOLD
No reversal signals that I can see so far….
Kaplaugh!!!!
If 2800 falls, next high potential turn zone is 2720-ish. Two significant fibos there, a 100% and a 61.8%.
Strong move. Maybe you will explain?
I hate when people say this to me, but I have so much data that it would take me forever.
The down part is pretty easy. Breadth is not supporting this move and with so many high-fliers over their high calls, there’s got to be a rug pull coming soon. Obviously, the longer we hold over 2800, that may not matter.
The crash part, to make this intriguing, all I will say is the closing price last Thursday on Apple (222.22) meant something. Also, in ’87 the market crashed one year after Reagan signed the tax bill.
DJX is current in “no man’s land” right now in my view. Blew through the 61.8% at 258.6. Next high potential turn area is 78.6% at 263.3. (I take it you shorted the dow.)
DJX at 170 in two weeks? Anything is possible. But that one strikes me as pretty darn unlikely. Still, best of luck in your trade.
yIDoghQo’
The price pivots continue to do an amazing job of telling us what to expect from price. It is truly uncanny. I think any corrective move down is not going to breach those pivots and we could see price move considerably higher if the count I have in mind is what is unfolding. The bears’ failure to take out those pivots was significant.
Low volume suggests “Shaking The Trees”…
Breadth not confirming.
2797 might be a good place to short.
Oh and we’re over all those high calls that probably won’t get paid.
Very interesting situation. The 275 strike calls position was massive so traders anticipating this rally were right.
The 277 put open interest was even bigger!
I do not expect those 275 call contracts will be held through expiration; they will get paid, I assure you. The market makers however, were forced to go out an secure those shares just in case those call options were exercised. What folk commonly refer to a “Short Squeeze” could also be considered a “Long Squeeze”… 😉
Very interesting indeed. Thanks for that insight Verne.
IMHO, this is going to crash.
Not saying today but very soon.
Good luck!
Would love to see Dow 26,000 today.
Looks to me like a big ABC…
I akways get it wrong when I don’t step back and look at the bigger picture and instead get bolloxed up in minutiae. The key thing I missed here was wave proportionality. Live and learn… 🙂
RUT tagged and turned at a key 78.6% retrace level, 1569.4. Watching now to see if it develops into sell triggers at the 5 minute, and then hourly tf’s.
I think you’re onto something regarding that 78.6% retrace. It is very likely algo driven to run 62% stops. We noticed this some time ago.
Hmmm. Looks to me like SPX is still in the minor A up of intermediate B up. And to my untrained eye, it looks like it’s in minute wave v of that five wave minor A.
I wouldn’t be overly shocked to get a topping reversal day here that starts up the eagerly anticipated minor B down. I’ve got a 1.27% extension right at the critical battleground roundie of 2800.
Multiple spider funds are currently showing significant reversal patterns: XLI, XLF, XOP, XRT. Could be early signals relative to the broader market. It’s only an hour in though.
Interesting. Everyone is confident the historical post mid-term election rally will obtain.
Hi Lara
I was listening to the chief at Morgan Stanley about a week ago. He mentioned something along the lines of that he expected a bounce to around 2780 then another correction to 2450.
Now I’m more interested in the number of 2450 as per your guidelines with reference too the Dow theory anything below 2532 is the end of the bull market and start of a bear market.
If in fact this happens. Wil we see the last wave up until 3600 or does that 2532 represent a change in longer term ie downwards.
Thankyou again.
Well, for Dow Theory to state a change from bull to bear is in, both DJT and DJIA need to make new lows below their prior major swing lows.
Not the S&P.
It can certainly happen that only one of of DJT or DJIA makes new lows and the bull market continues.
I add in the S&P and Nasdaq for an “extended” Dow Theory, but the bottom line is I would go with the original and make a call based only on DJT and DJIA.
At this stage a new low below 2,532 for the S&P would see a very clear breach of the teal trend channel. That would be enormously bearish. If my weekly wave count is right, that shouldn’t happen until primary wave 5 has shown up.
Are we invalidated here? Minute b has now gone beyond the end of Minor A. Does that constitute a new wave count e.g. a minor C or could it still be a flat correction?
Minute b has gone beyond the start of minute a?
Not the end
As in an expanded flat, it can go beyond the start of a. The common range for minute wave b within a flat correction is from 1 to 1.38 times the length of minute wave a, giving a range of 2,756.55 to 2,777.87.
Gone beyond normal range now
Yes. And so minor B was over.
Minor C is underway
1st. Boom