For the short term, both hourly Elliott wave counts expected the week to begin with a little upwards movement, which is what has happened.
Summary: Overall, now expect a bounce to last about two to a few weeks. For the short term, the last open gap may offer support at 2,685.43.
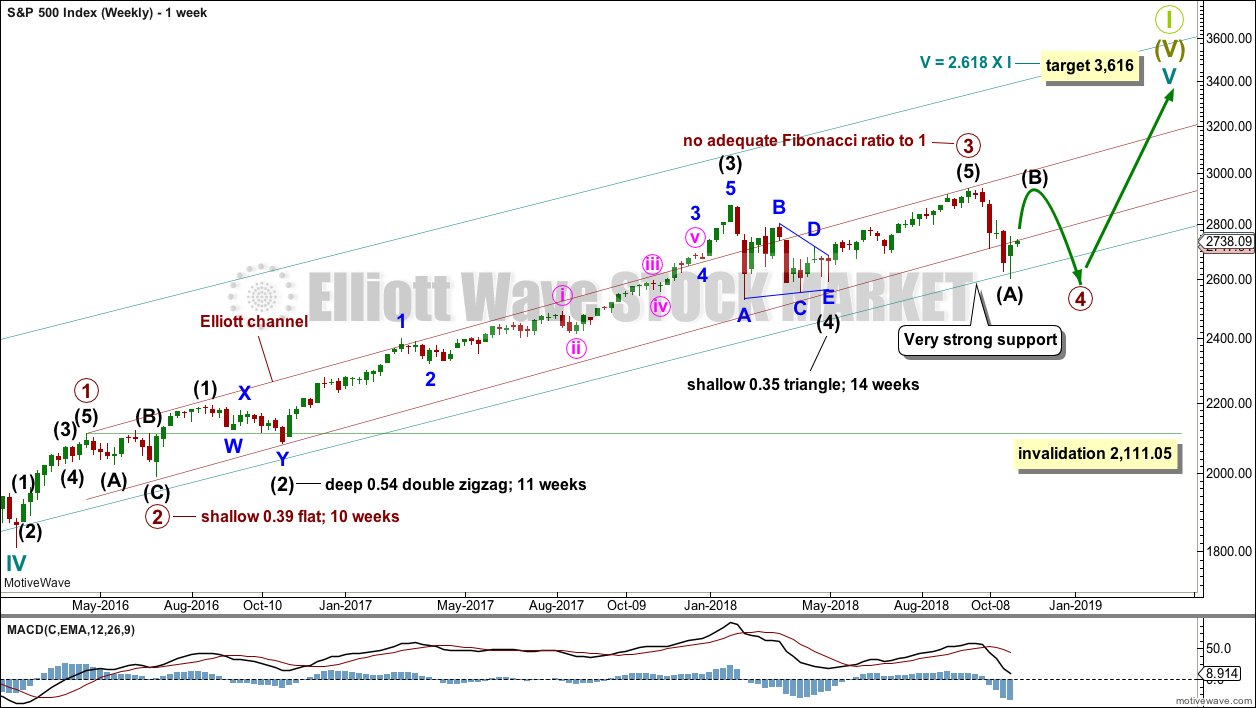
A primary degree correction should last several weeks and should show up on the weekly and monthly charts. Primary wave 4 may total a Fibonacci 8, 13 or 21 weeks. Look for very strong support about the lower edge of the teal trend channel on the monthly chart.
Primary wave 4 should be expected to exhibit reasonable strength. This is the last multi week to multi month consolidation in this ageing bull market, and it may now begin to take on some characteristics of the bear market waiting in the wings.
The final target for this bull market to end remains at 3,616, which may be met in October 2019.
New updates to this analysis are in bold.
The biggest picture, Grand Super Cycle analysis, is here.
Last published monthly chart is here, video is here.
ELLIOTT WAVE COUNT
WEEKLY CHART
Cycle wave V must complete as a five structure, which should look clear at the weekly chart level and also now at the monthly chart level. It may only be an impulse or ending diagonal. It is clear it is an impulse.
Within cycle wave V, the third waves at all degrees may only subdivide as impulses.
Within primary wave 3, there is perfect alternation and excellent proportion between intermediate waves (2) and (4).
The maroon channel is drawn about primary degree waves. The first trend line is drawn from the ends of primary waves 1 to 3, then a parallel copy is placed upon the low of primary wave 2. The overshoot of the upper edge of this channel by the end of intermediate wave (3) looks typical. For the S&P, its third waves are usually the strongest portion of an impulse; they often exhibit enough strength to overshoot channels.
Primary wave 4 now has an overshoot on the lower edge of the channel. This is acceptable; fourth waves are not always neatly contained within channels drawn using this technique.
Primary wave 4 may find very strong support about the lower edge of the teal channel, and it looks like this is from where price may be bouncing. This channel is copied over from the monthly chart and contains the entire bull market since its beginning in March 2009. While Super Cycle wave (V) is incomplete, this channel should not be breached at the weekly chart level.
Primary wave 4 may not move into primary wave 1 price territory below 2,111.05.
When primary wave 4 may be complete, then the final target may be also calculated at primary degree. At that stage, the final target may widen to a small zone, or it may change.
At this stage, the expectation is for the final target to be met in October 2019. If price gets up to this target and either the structure is incomplete or price keeps rising through it, then a new higher target would be calculated.
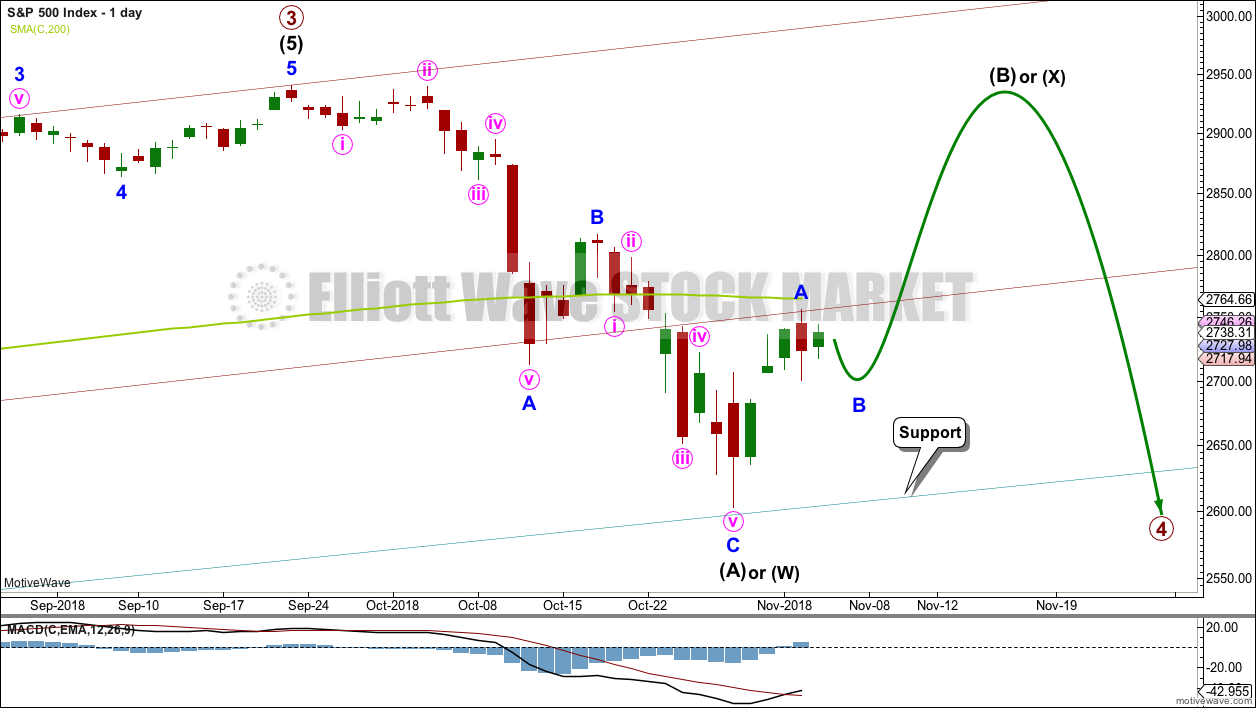
DAILY CHART
Primary wave 4 would most likely end somewhere within the price territory of the fourth wave of one lesser degree. Intermediate wave (4) has its price territory from 2,872.87 to 2,532.69. Within this range sit the 0.236 Fibonacci ratio at 2,717 and the 0.382 Fibonacci ratio at 2,578.
The 0.382 Fibonacci ratio would expect an overshoot of the teal channel. This may be too low; price may find support at the lower edge of the channel. However, as primary wave 4 should be expected to exhibit reasonable strength, it may be able to overshoot the channel and that would look reasonable. This possibility is now more seriously considered.
Primary wave 2 unfolded as a shallow regular flat correction lasting 10 weeks.
Intermediate wave (A) may be seen as a complete zigzag. A zigzag down to start primary wave 4 may also be labelled intermediate wave (W).
If intermediate wave (A) or (W) subdivide as a zigzag, then primary wave 4 may unfold as a double zigzag, double combination, flat or triangle. Of all these possible structures a flat correction would be least likely as that would not offer structural alternation with the flat correction of primary wave 2.
A double zigzag would also be less likely as that would require a very large overshoot of the teal trend channel, and it would also see a very brief primary wave 4.
A triangle would be fairly likely even though intermediate wave (4) was a triangle. This does not reduce the probability of primary wave 4 also subdividing as a triangle.
A double combination should always be considered if a triangle is possible, and this would also offer reasonable alternation with primary wave 2.
All structural options (except a double zigzag) which begin with a zigzag down would expect a high bounce for intermediate wave (B) or (X). Intermediate wave (B) or (X) would most likely subdivide as a zigzag.
Within a triangle for primary wave 4, intermediate wave (B) would most likely be about 0.8 to 0.85 the length of intermediate wave (A) giving a target range from 2,873.54 to 2,890.38. Intermediate wave (B) of a running triangle may make a new high above the start of intermediate wave (A).
Within a double combination for primary wave 4, intermediate wave (W) may be the first complete structure in a double. Intermediate wave (X) may be a very high bounce and may make a new high above the start of intermediate wave (W). There is no minimum requirement for the length of intermediate wave (X), and no maximum limit.
For both of the more likely options of a triangle or combination for primary wave 4, price may continue to find support about the lower edge of the teal trend channel. This would give the wave count the right look at the monthly time frame.
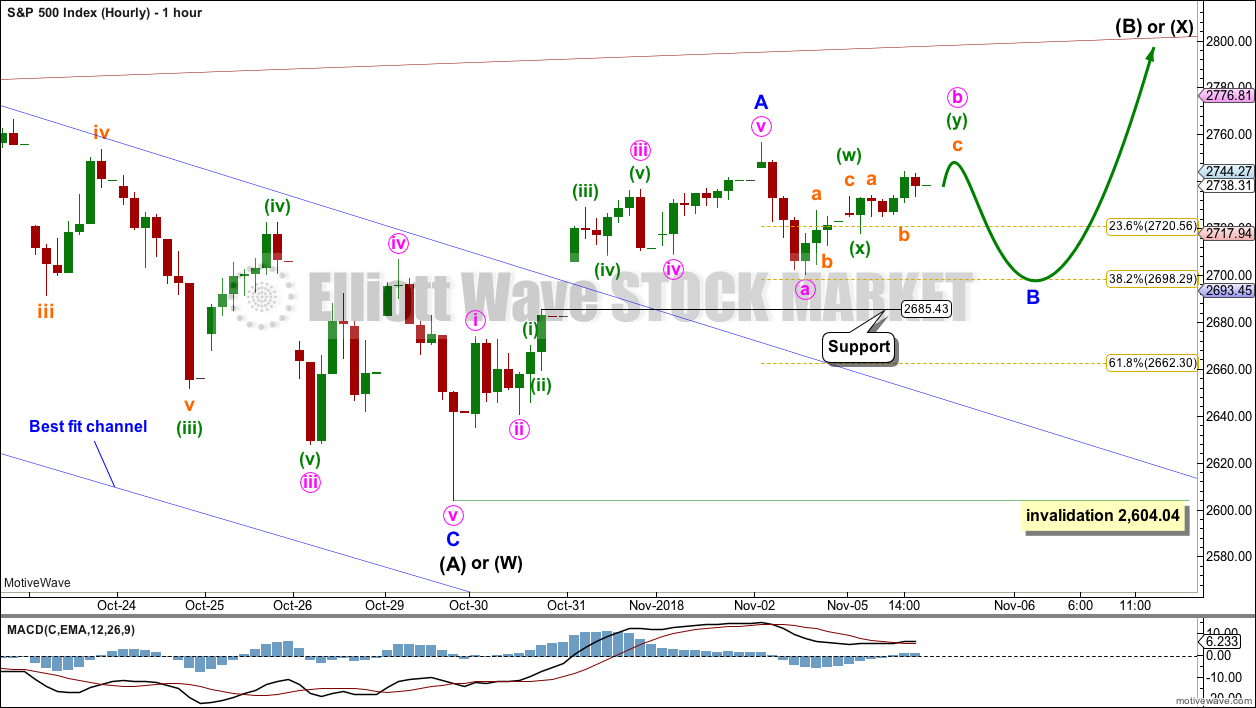
HOURLY CHART
Intermediate wave (B) or (X) would most likely subdivide as a single or multiple zigzag to achieve a high bounce.
If intermediate wave (B) or (X) subdivides as a zigzag, then minor wave B may not move beyond the start of minor wave A below 2,604.04.
The gap may remain open, providing support for minor wave B.
Minor wave B may subdivide as any corrective structure. It would most likely be a time consuming sideways correction. It may last a week or more.
So far within minor wave A, minute wave a looks best as a three wave structure on the five minute chart. If minute wave a is a three wave structure, then minor wave B may be a flat or triangle.
Minute wave b has now retraced 0.78 the length of minute wave a. If minor wave B subdivides as a flat correction, then within it minute wave b may continue higher tomorrow to reach 2,750.94 or above, where it would reach 0.9 the length of minute wave a.
If minor wave B subdivides as a triangle, then there would be no minimum requirement for the length of minute wave b within it.
ALTERNATE WAVE COUNT
DAILY CHART
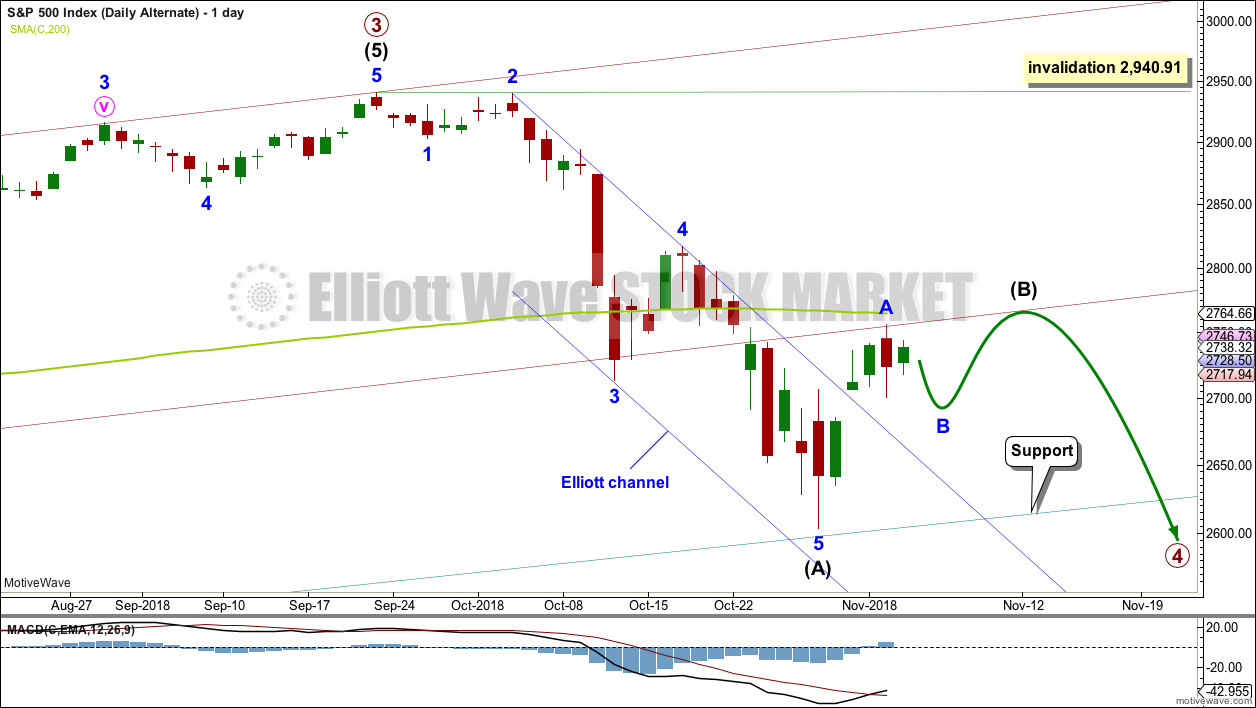
It is also possible to see the downwards wave labelled intermediate wave (A) as a complete impulse. If intermediate wave (A) is a five wave structure, then intermediate wave (B) may not move beyond its start above 2,940.91.
Primary wave 4 may be a zigzag to provide structural alternation with the flat correction of primary wave 2; intermediate wave (A) within a zigzag must subdivide as a five wave structure.
Primary wave 4 may not move into primary wave 1 price territory below 2,111.05.
This wave count would expect to see at its end a large overshoot of the teal channel for the end of primary wave C, so that it moves below the end of primary wave A and avoids a truncation. This looks less likely; this is one reason why this wave count is judged to have a lower probability and is labelled as an alternate.
HOURLY CHART
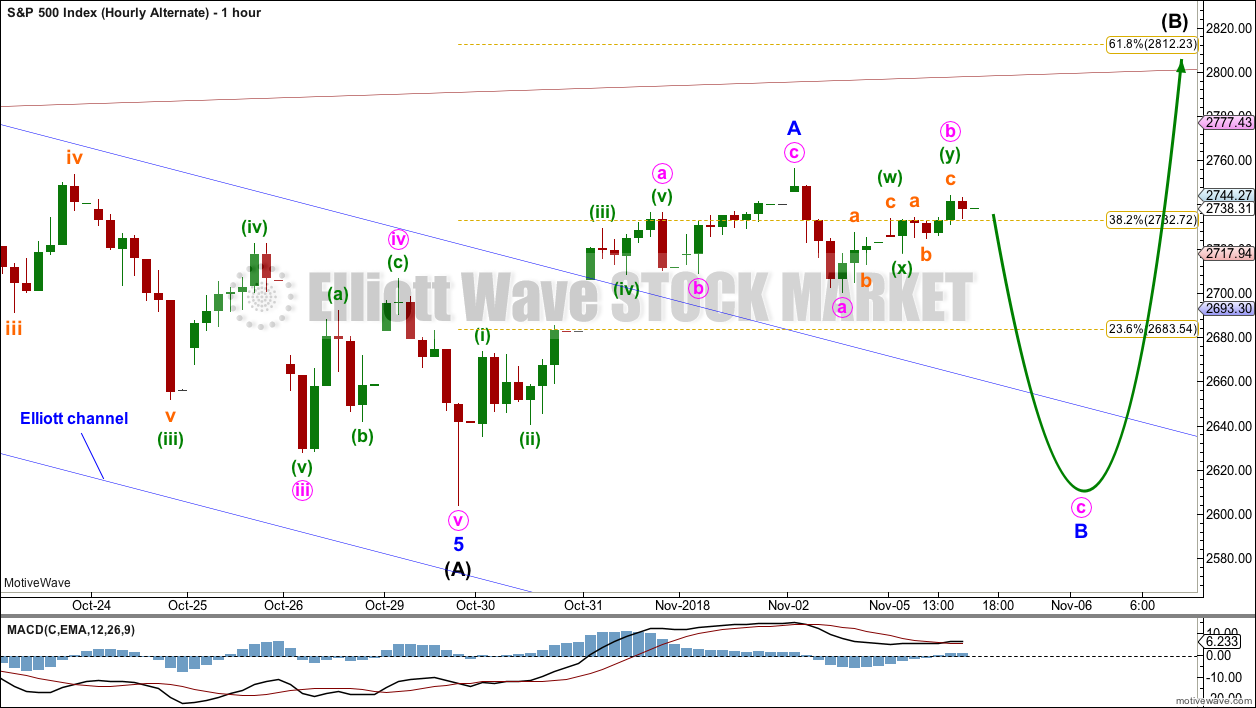
Intermediate wave (B) may unfold as one of more than 23 possible corrective structures. B waves exhibit the greatest variety in structure and price behaviour. They can be very complicated time consuming sideways corrections, or equally as likely they can be quick sharp zigzags.
To take up time and move price sideways, intermediate wave (B) for this wave count may most likely be a complicated sideways structure such as a flat, combination or triangle. A longer lasting intermediate wave (B) would give primary wave 4 better proportion to primary wave 2 in terms of duration.
Intermediate wave (B) may have begun with a zigzag upwards. If minor wave A subdivides as a three, then intermediate wave (B) may unfold as a flat, combination or triangle.
Minor wave B would most likely be a deep correction, and it may make a new low below the start of minor wave A if intermediate wave (B) unfolds as an expanded flat, running triangle or combination.
TECHNICAL ANALYSIS
WEEKLY CHART
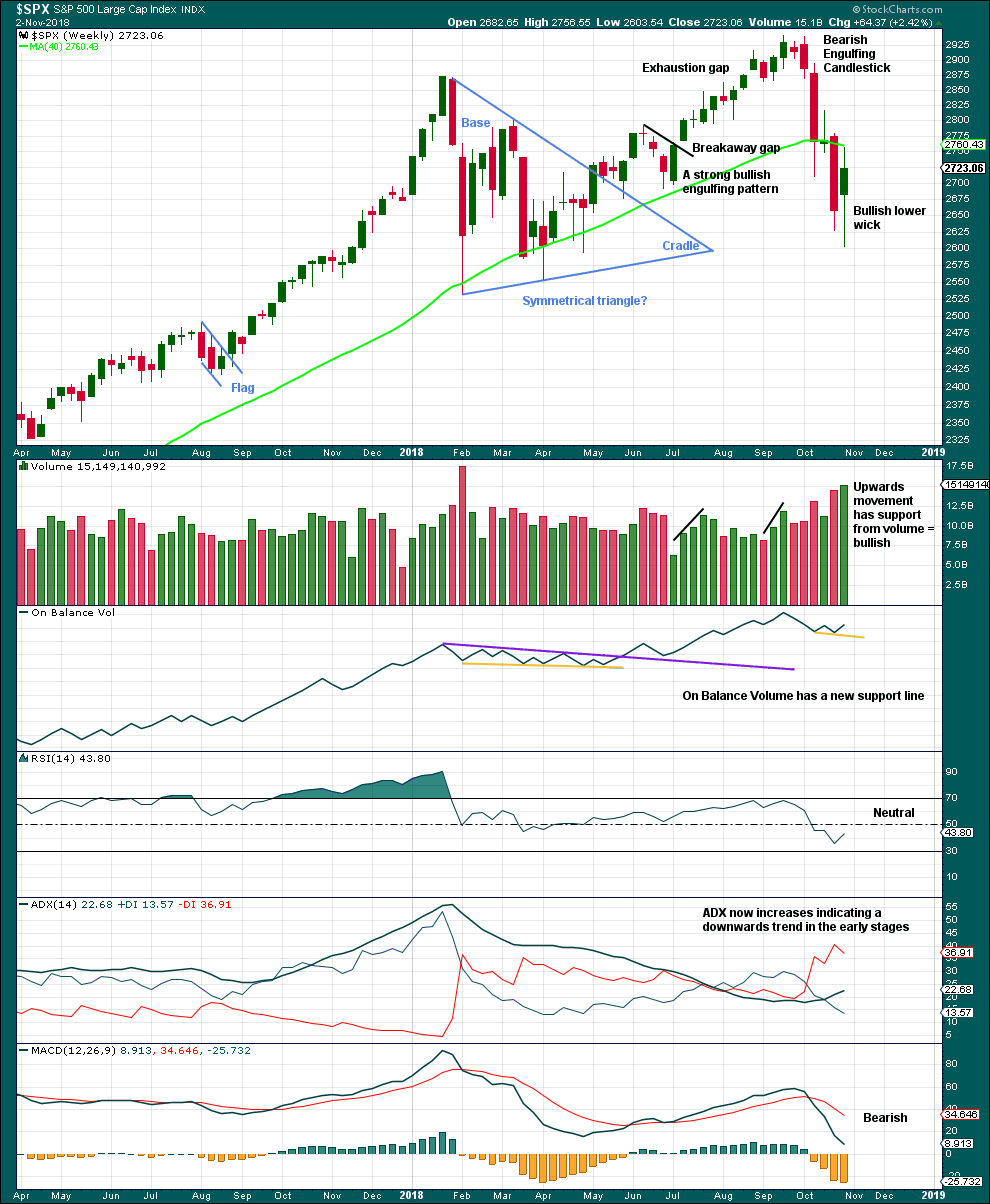
Click chart to enlarge. Chart courtesy of et=”_blank”>StockCharts.com.
Another long lower wick and support from volume last week looks bullish again.
The support line for On Balance Volume is removed and redrawn.
DAILY CHART
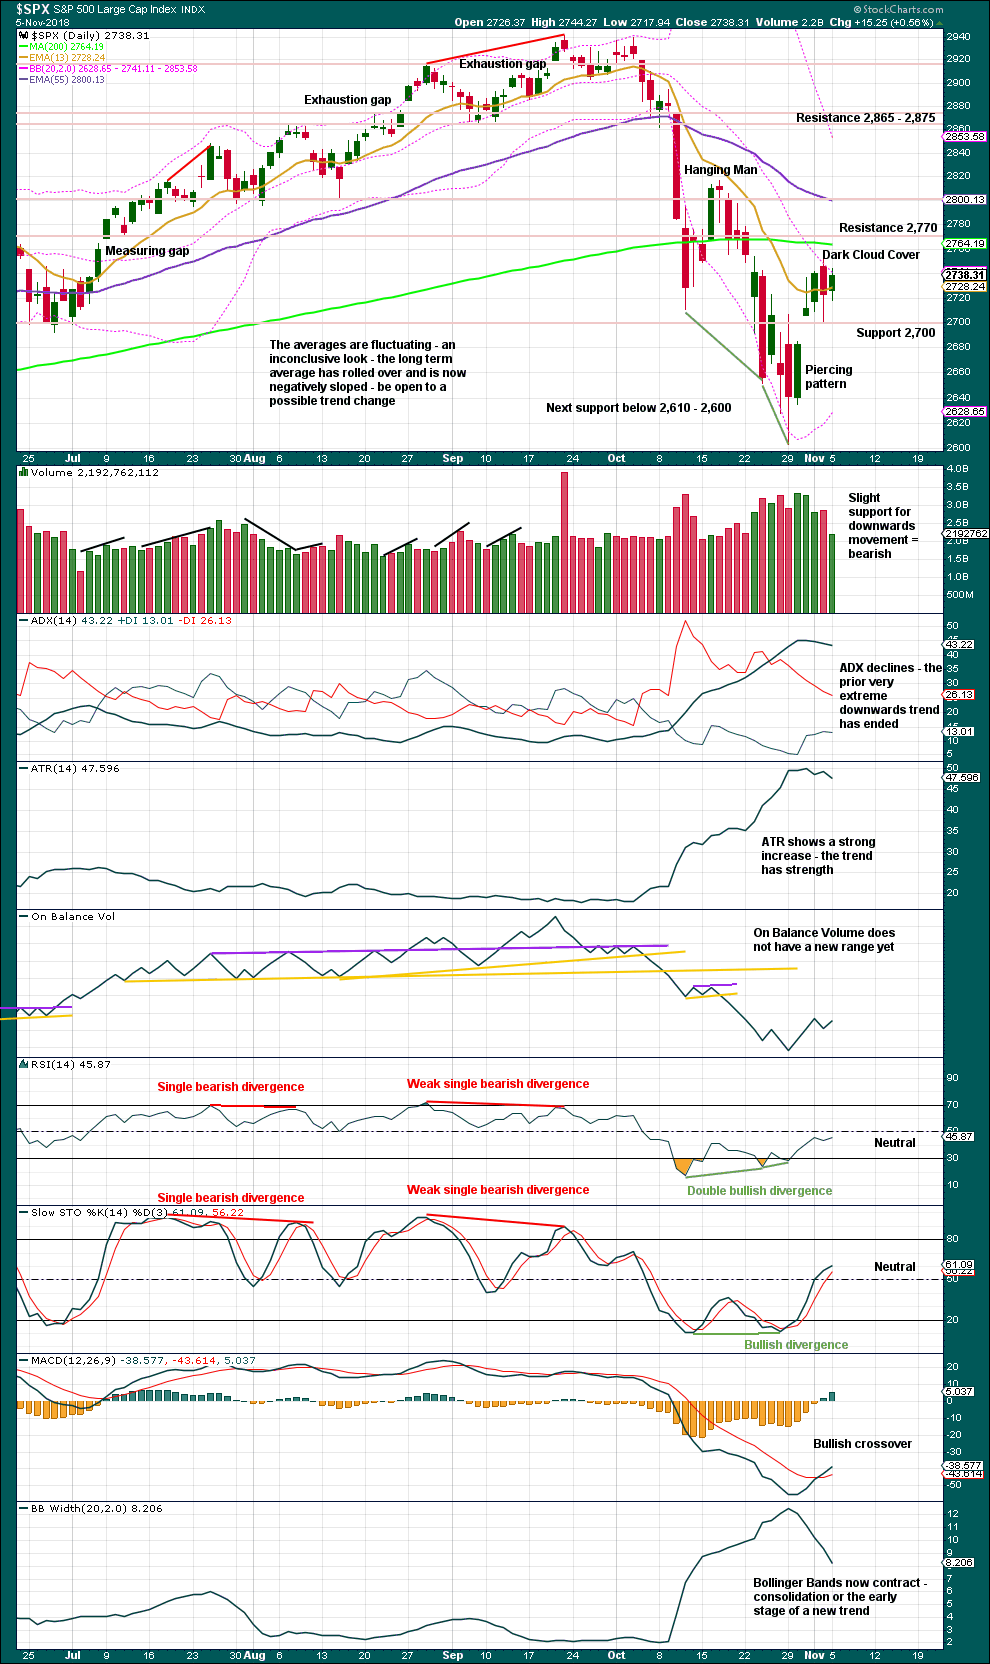
Click chart to enlarge. Chart courtesy of StockCharts.com.
For the short term, expect support about 2,700 and just below that at the last open gap at 2,685.43.
Monday completes an inside day with the balance of volume upwards. Upwards movement within this session lacks support from volume; for the short term, this is bearish.
Look for this bounce to continue until Stochastics reaches overbought and price reaches resistance. Next resistance above is at 2,770.
BREADTH – AD LINE
WEEKLY CHART
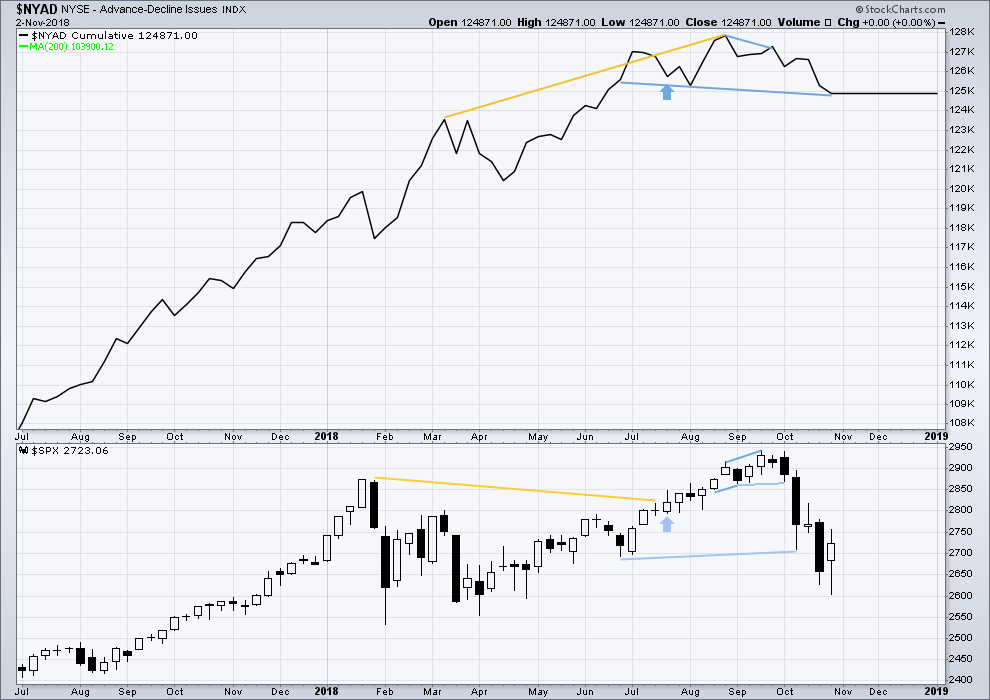
Click chart to enlarge. Chart courtesy of StockCharts.com.
Falling price has support from a decline in market breadth. Breadth is falling in line with price. There is no divergence either way.
DAILY CHART
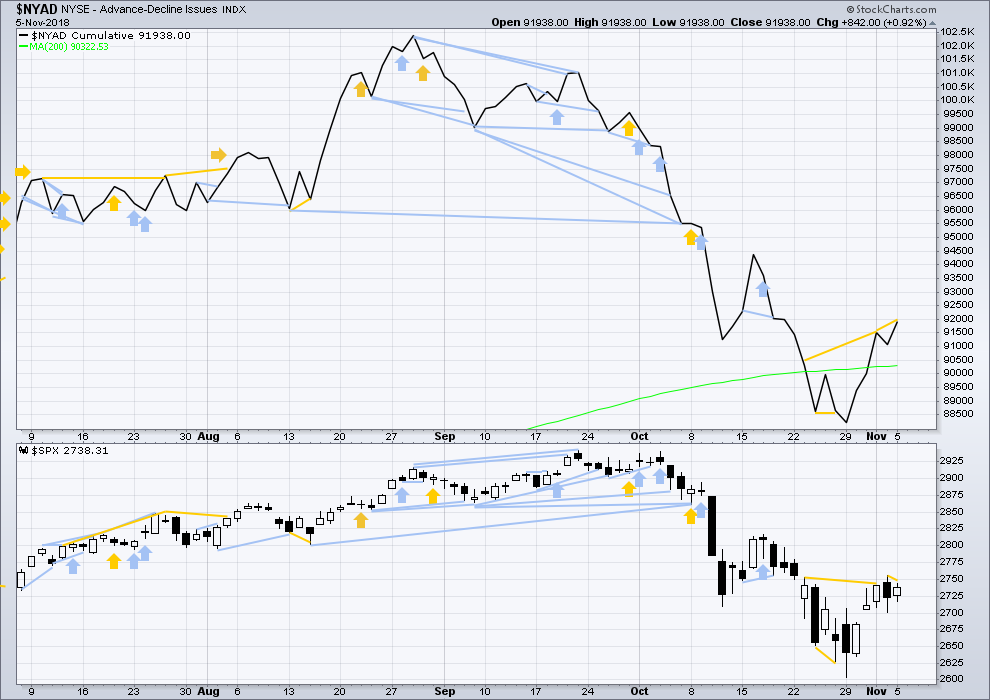
Click chart to enlarge. Chart courtesy of StockCharts.com.
There is normally 4-6 months divergence between price and market breadth prior to a full fledged bear market. This has been so for all major bear markets within the last 90 odd years. With no longer term divergence yet at this point, any decline in price should be expected to be a pullback within an ongoing bull market and not necessarily the start of a bear market. New all time highs from the AD line on the 29th of August means that the beginning of any bear market may be at the end of December 2018, but it may of course be a lot longer than that. My next expectation for the end of this bull market may now be October 2019.
Breadth should be read as a leading indicator.
The AD line makes a new short term high on Monday above the high two sessions prior, but price has not made a corresponding high. This divergence is bullish for the short term.
VOLATILITY – INVERTED VIX CHART
WEEKLY CHART
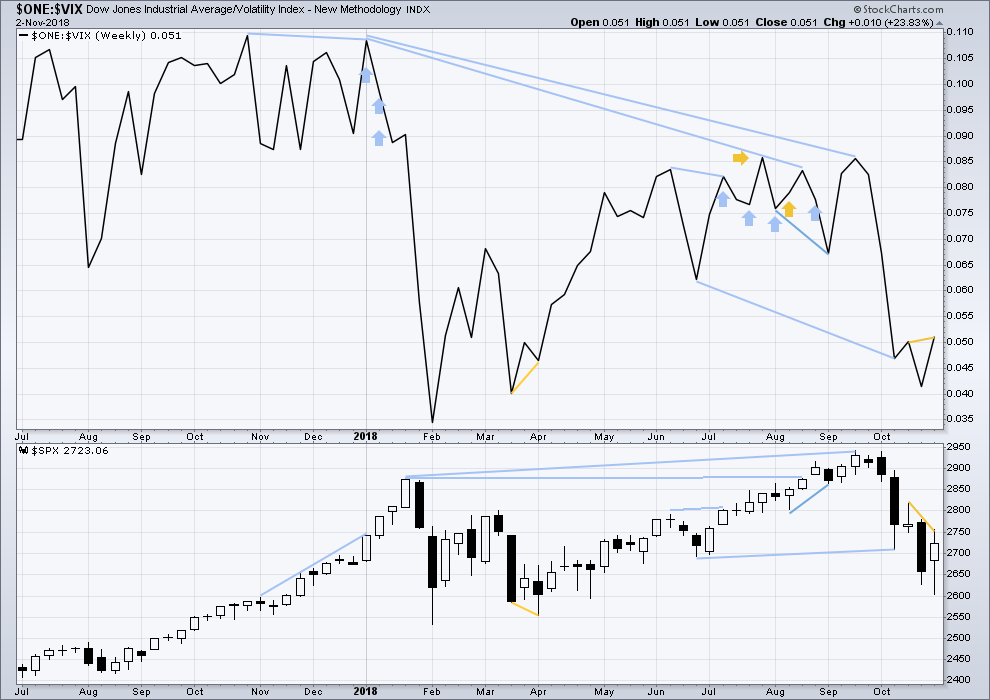
Click chart to enlarge. Chart courtesy of StockCharts.com. So that colour blind members are included, bearish signals
will be noted with blue and bullish signals with yellow.
Last week inverted VIX has made a new high above the prior swing high two weeks ago, but price has not. This divergence is bullish.
DAILY CHART
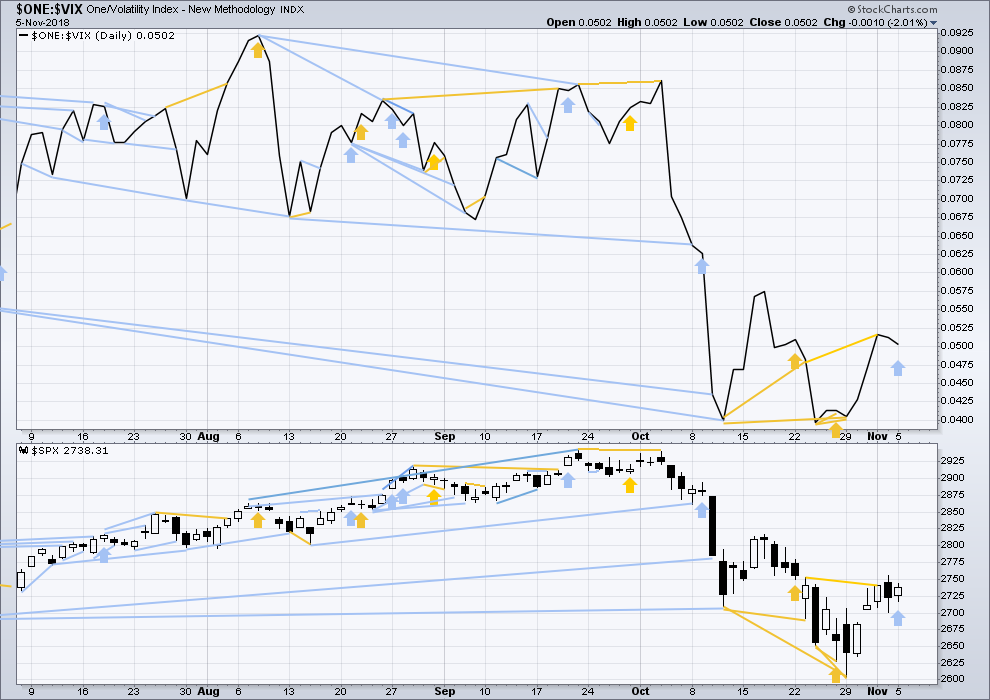
Click chart to enlarge. Chart courtesy of StockCharts.com. So that colour blind members are included, bearish signals
will be noted with blue and bullish signals with yellow.
Normally, volatility should decline as price moves higher and increase as price moves lower. This means that normally inverted VIX should move in the same direction as price.
Price moved sideways during Monday’s session, but the candlestick is green and the balance of volume was upwards. Upwards movement within Monday’s session does not come with a normal corresponding increase in inverted VIX. The increase in volatility for Monday is bearish for the short term.
DOW THEORY
The following lows need to be exceeded for Dow Theory to confirm the end of the bull market and a change to a bear market:
DJIA: 23,344.52.
DJT: 9,806.79.
S&P500: 2,532.69.
Nasdaq: 6,630.67.
ANALYSIS OF INTERMEDIATE WAVE (4)
TECHNICAL ANALYSIS
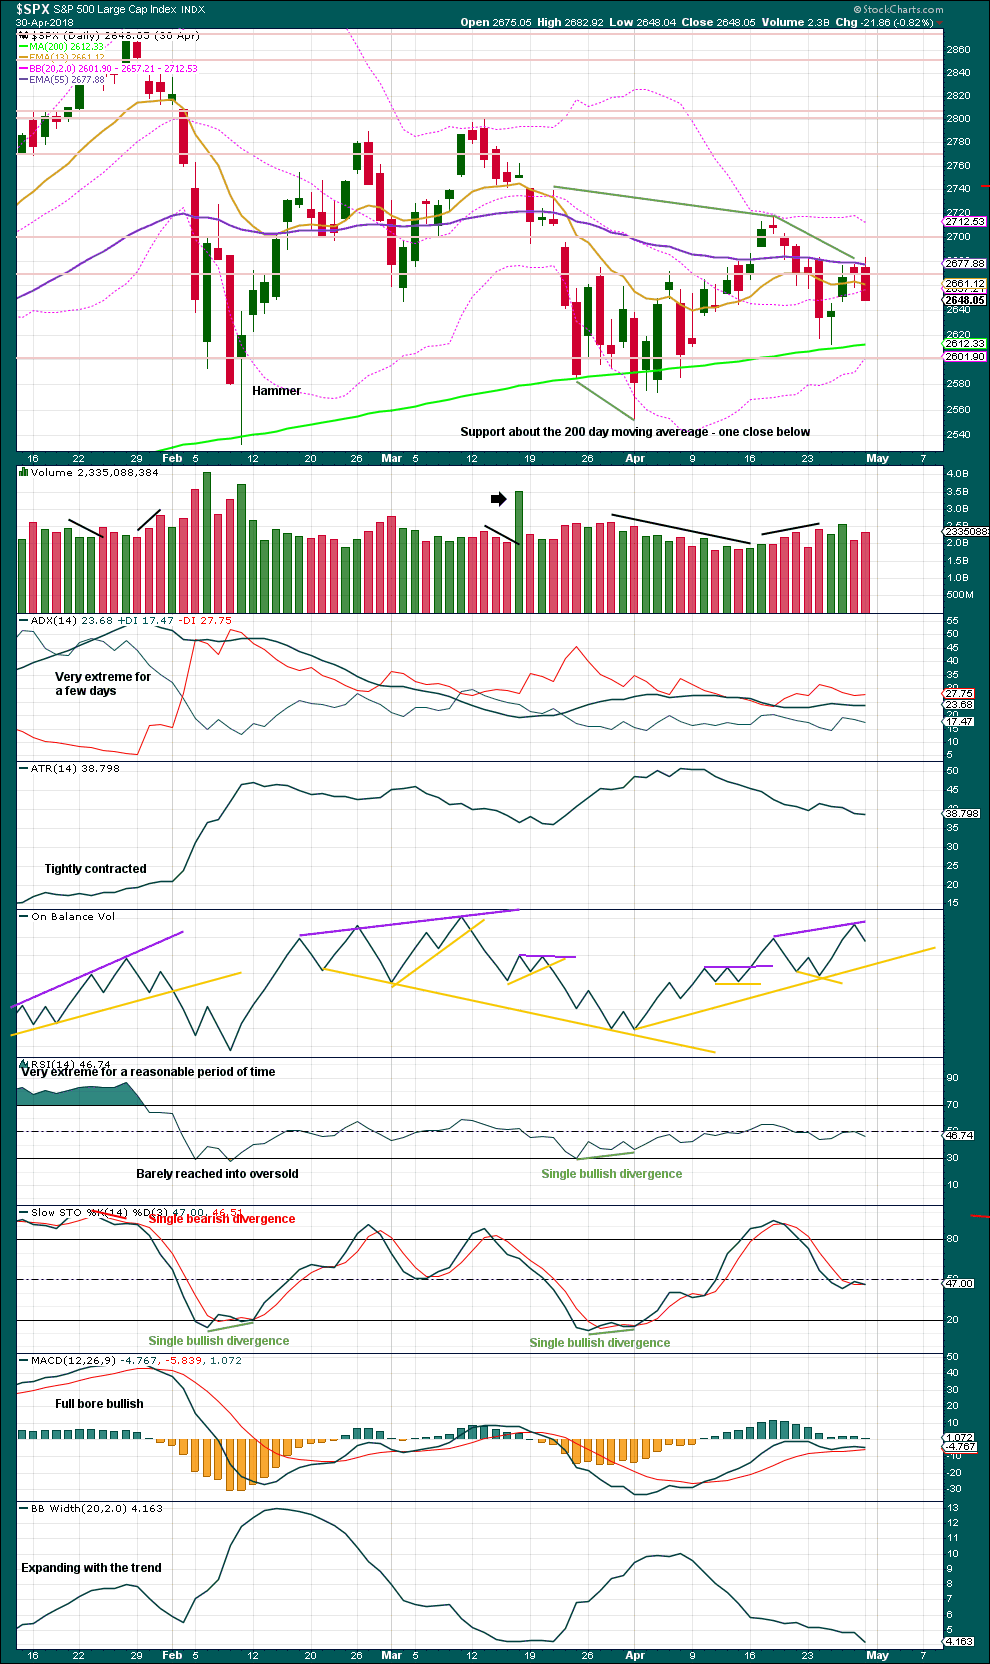
Click chart to enlarge. Chart courtesy of StockCharts.com.
Intermediate wave (4) was a large symmetrical triangle. The deepest wave was the first wave. At its low there was a clear candlestick reversal pattern and bullish divergence between price and Stochastics.
RSI barely managed to reach into oversold.
The current correction for primary wave 4 may behave differently, but there should be some similarities.
It is expected that primary wave 4 may be stronger than intermediate wave (4).
VIX
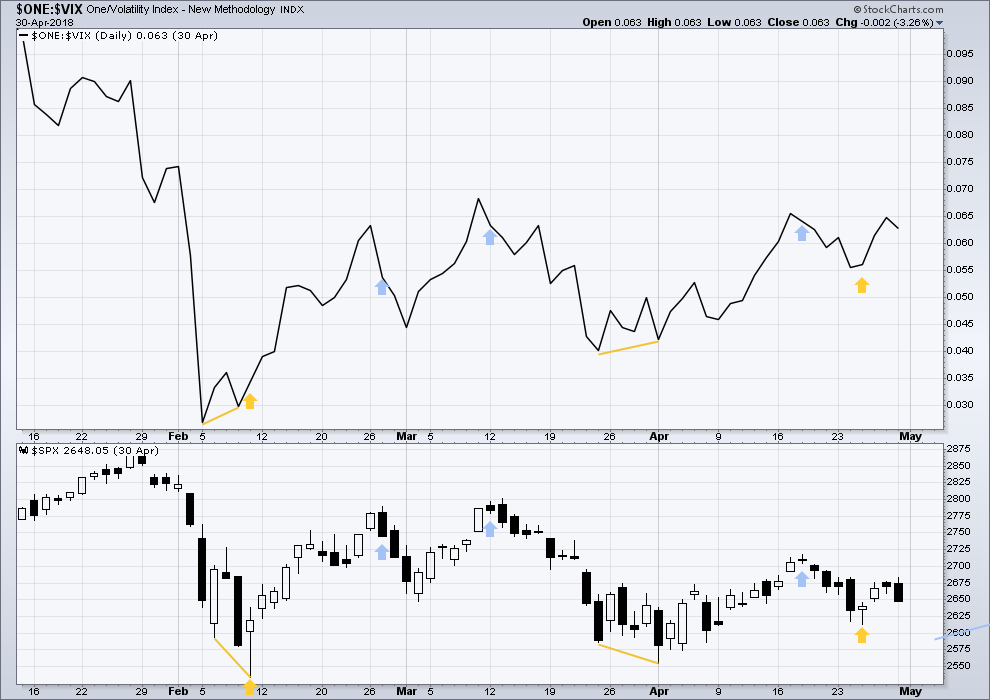
Click chart to enlarge. Chart courtesy of StockCharts.com.
This is a daily chart.
At the two major lows within intermediate wave (4), inverted VIX exhibited single short term bullish divergence.
At highs within intermediate wave (4), inverted VIX exhibited one single day bullish divergence with price.
AD LINE
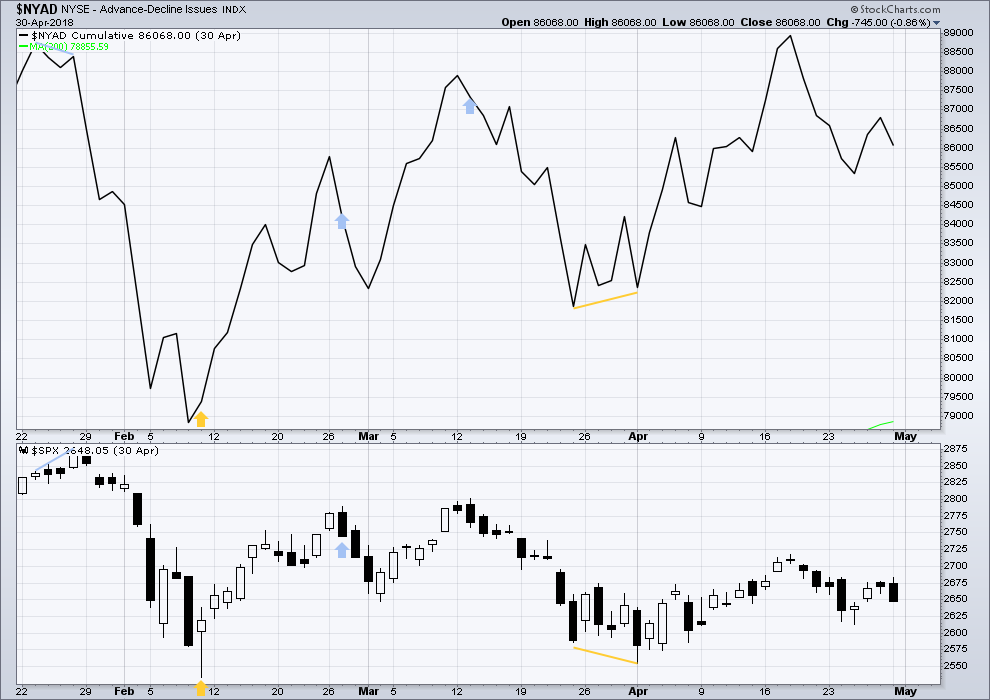
Click chart to enlarge. Chart courtesy of StockCharts.com.
This is a daily chart.
At the two major lows within intermediate wave (4), there was bullish divergence between price and the AD line. At the two major highs within intermediate wave (4), there was each one instance of single day bearish divergence.
Published @ 07:03 p.m. EST.
—
Careful risk management protects your trading account(s).
Follow my two Golden Rules:
1. Always trade with stops.
2. Risk only 1-5% of equity on any one trade.

Chris:
Read Francesco’s latest missive on “System Resilience Indicators” (SRI)
Great read! Let me know what you think, and any adjustments you are making….
I think we are in the C wave now!
The possible structure of minor B within intermediate (B):
It could now be a regular flat correction, minute b has met and passed the minimum requirement to be 0.9 the length of minute a.
If this structure holds (remains valid) then minute c may end at the lower edge of the small pink Elliott channel I’ve drawn about it. Regular flats often sit neatly within trend channels.
That would see another test of support at the last open gap, which may hold.
What about minor b morphing onto an expanded flat?
Minute b….
It certainly could. If it reaches 2,759.36 tomorrow then it would meet the requirements for an expanded flat; at that point minute b would = 1.05 X minute a.
Here’s the best and most comprehensive article on climate change that I’ve found so far. (I’ll post the URL separately, because that seems to trigger “moderation”). If you search for the phrase “when will the planet be too hot for humans” you’ll find it, in NYMag. Well written and comprehensive, speaks to not just rising sea levels, but the destruction of agriculture, the rise of diseases, the affects of higher CO2 on human cognition, the impacts of heat/humidity on general human survival, and points to the large issues still not even accounted for: for example, the vast CO2 that will be released when the permafrost melts, and the rising albedo of the earth that will cause a rising heat feedback loop. I urge everyone to be informed on this subject, and assess the long range plans for your extended families. Trading requires “assessing the likely future” and executing thoughtful plans. Keeping your family alive into the 2100’s is without any doubt whatsoever going to require the same.
Here’s the direct URL: http://nymag.com/intelligencer/2017/07/climate-change-earth-too-hot-for-humans.html
You starting up again? Climate has been changing for Millions/Billions of years… Frozen Over and heated up many, many times.
Build mega De-salination plants and pump the water to where it’s needed for crops and drinking water … Stops the oceans from rising and feeds the world!
We are near the end of the heating cycle… at some point will start cycle back to the ice age.
I recommend you read the article.
Everyone needs to know the facts and the science and the projections, and assess for themselves.
If you have any supporting serious science that says the “heating cycle is coming to an end”, I’d be amused to see it.
Biased Garbage in and Garbage Out… That what all these Climate Models are!
Hey Chris, am I going to get in trouble for talking too much??! lol! 🙂
Talk more , love to learn
OK taking a gamble down off todays hi….
also the RUT looks due for a C too…..
My “overhead” view of RUT. The first cluster is at 1568-1570, and the second cluster is at 1599-1601.
NDX on the daily chart sure looks like price is in a B up of a B down after an A up off the lows a week or two ago.
This is a difficult market. Corrections of corrections of corrections. Aiiich. Too unpredictable for me to commit any real “profit making” money at the moment, though I’m watching carefully for any kind of short term clarity that would allow me to get a reasonable short term bite.
Thus the t-shirt “I super dislike B waves”.
I am sitting on hands in all accounts and all markets. Last night there was snow in one of my favorite spots in the nearby mountains. “The mountains are calling and I must go!” I have that on a beautiful plaque over my bed.
Sounds rational to me Rodney. Have a great time, and stay warm! And fight through any ancient instinct to go hibernate with those bears, we want your continued perspective here!
This is a situation where I would like to use the Verne trade, a bear call credit spread. However, it doesn’t work for me, because if price goes up, to take profit on one side I have to sell the long call side and hold the short call side. Naked. Not allow in my IRA. Drat.
Never do that. Either roll the position, if you are confident of the trend but wrong on timing, defend the position with an opposite spread, or exit with a limited loss, and wait for better entry.
I am holding a ton of 280.50 SPY calls and 265 puts at zero cost basis by trading the C waves and closing out short legs of spread when we rip, or dip.
There were many opportunities to execute this type of trade the last few weeks.
The key with spreads is not so much to rake in big gains when you deploy them, but get positioned for an expected move at greatly reduced cost.
What he said…..
🙂
How far did you go out (expiration date)?
TIA!
It depends on where we are in the wave count.
For very experienced and active traders it can be done with same week expiration options.
I suggest for those new to the strategy you give yourself at the very least 30 days to expiration, even better, six weeks.
You will often find that you can rinse and repeat the trade several times over a longer time horizon and it also allows more time to adjust the trade as needed.
You also need to be aware that if you trade big lots you WILL become a target with attempts to ambush your position and shake you out at a loss. It is harder for them to do if you are trading with a posse…. 🙂
Sorry Verne but I’m scratching my head here. “Never do that” but you describe doing exactly that (“closing out short legs of spread”). What am I missing? Never do that with a call bear spread? Is that what you mean? As I said doing so is not allowed in my account…but I don’t understand what you are really saying here re: “never do that”, my apologies.
Okay, maybe I’ve got it now. You only (ONLY) close the SHORT side.
So if we want to use a bear spread, us a put DEBIT spread, allowing the short puts to be closed if the market moves against.
Sorry I’m a bit slow at the moment, got the flu by way of excuse.
Bingo!
Holding naked short options exposes you to UNLIMITED losses.
Not good!
Sorry about the confusion. Spreads take a bit of practice to get the hang of it but when done right is a very SAFE way to trade.
I tend to use CREDIT spreads on counter-trend moves as the idea is to get paid to make the trade. When SPY moved close to 2700 I sold the 264.5/265 BULL put spread (sold 265, bought 264.5). I bought back the 265 puts on the move up and the credit for selling the spread and lower price for the short 265 puts means I got paid, granted not a lot, to open the position. Same idea with my 279.50/ 280.50 BEAR call credit spreads (sell 279.50, buy 280.50) opened at the last manic C wave up.
I have already bought back most of the short 279.50 calls as decay reduces cost.
The high from last Friday (2757) is a high volume node in SPY. Right now price is in a “volume valley”. The largest volume node (“the point of control”) is down around 2721. If SPX pushes up through 2757, it’s got a ways to run as I see it. 2776 is a 78.6% and 2784 is a 50%. I’ll be surprised if it gets up there but market action speaks.
First. Change to standard time in US. Apparently not yet in NZ?
We’re always standard down here in NZ 🙂
Wisdom! Are you accepting refugees from the US? : )
One of our current coalition partners is anti immigration so it’s currently tightening up.
Not sure that we’d consider you refugees anyway….