A bounce was expected but did not occur today.
Volume and candlestick wicks are used to indicate the most likely direction for tomorrow. Only one Elliott wave count is published today.
Summary: With price closing about the low for the session, it looks like downwards movement may continue tomorrow.
But there is still bullish divergence between price and RSI, so there remains weakness in this downwards movement. The bounce may still come sooner rather than later; the target is at 2,592 to 2,590, but this may be too low as there is strong support about 2,610 – 2,600.
A primary degree correction should last several weeks and should show up on the weekly and monthly charts. Primary wave 4 may total a Fibonacci 8, 13 or 21 weeks. Look for very strong support about the lower edge of the teal trend channel on the monthly chart.
Primary wave 4 should be expected to exhibit reasonable strength. This is the last multi week to multi month consolidation in this ageing bull market, and it may now begin to take on some characteristics of the bear market waiting in the wings.
The final target for this bull market to end remains at 3,616, which may be met in October 2019.
New updates to this analysis are in bold.
The biggest picture, Grand Super Cycle analysis, is here.
Last published monthly chart is here, video is here.
ELLIOTT WAVE COUNT
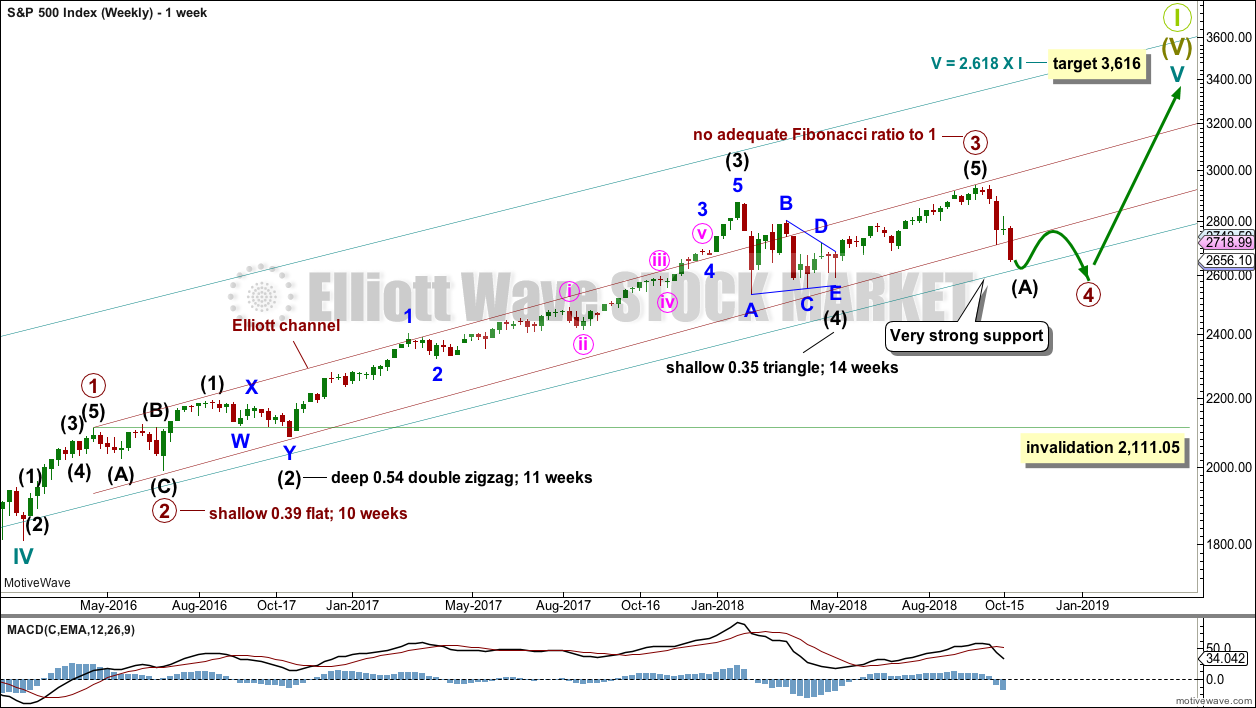
WEEKLY CHART
Cycle wave V must complete as a five structure, which should look clear at the weekly chart level and also now at the monthly chart level. It may only be an impulse or ending diagonal. It is clear it is an impulse.
Within cycle wave V, the third waves at all degrees may only subdivide as impulses.
Within primary wave 3, there is perfect alternation and excellent proportion between intermediate waves (2) and (4).
The channel is now drawn about primary degree waves. The first trend line is drawn from the ends of primary waves 1 to 3, then a parallel copy is placed upon the low of primary wave 2. The overshoot of the upper edge of this channel by the end of intermediate wave (3) looks typical. For the S&P, its third waves are usually the strongest portion of an impulse; they often exhibit enough strength to overshoot channels.
Primary wave 4 now has an overshoot on the lower edge of the channel. This is acceptable; fourth waves are not always neatly contained within channels drawn using this technique.
If primary wave 4 breaks out of the narrow maroon channel, then it may find very strong support about the lower edge of the teal channel. This channel is copied over from the monthly chart and contains the entire bull market since its beginning in March 2009. While Super Cycle wave (V) is incomplete, this channel should not be breached.
Primary wave 4 may not move into primary wave 1 price territory below 2,111.05.
When primary wave 4 may be complete, then the final target may be also calculated at primary degree. At that stage, the final target may widen to a small zone, or it may change.
At this stage, the expectation is for the final target to be met in October 2019. If price gets up to this target and either the structure is incomplete or price keeps rising through it, then a new higher target would be calculated.
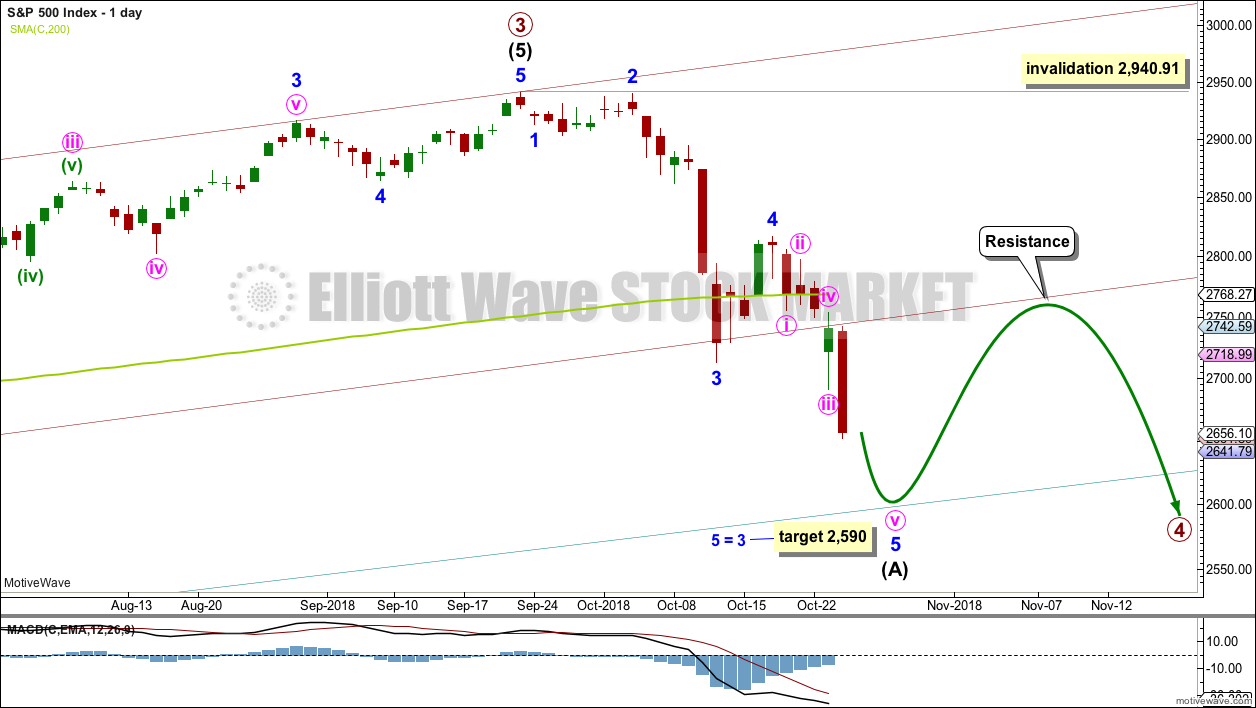
DAILY CHART
Primary wave 4 would most likely end somewhere within the price territory of the fourth wave of one lesser degree. Intermediate wave (4) has its price territory from 2,872.87 to 2,532.69. Within this range sit the 0.236 Fibonacci ratio at 2,717 and the 0.382 Fibonacci ratio at 2,578.
The 0.382 Fibonacci ratio would expect an overshoot of the teal channel. This may be too low; price may find support at the lower edge of the channel. However, as primary wave 4 should be expected to exhibit reasonable strength, it may be able to overshoot the channel and that would look reasonable. This possibility is now more seriously considered.
Primary wave 2 unfolded as a shallow regular flat correction lasting 10 weeks.
Intermediate wave (A) now looks most likely to be unfolding as a five wave structure.
There is still reasonable proportion between minor waves 2 and 4 within this wave count. There is alternation between the deep 0.96 combination of minor wave 2 and the shallow 0.46 zigzag of minor wave 4.
Intermediate wave (A) has now moved well below the lower edge of the maroon channel, which is copied over from the weekly chart. Intermediate wave (B) may bounce up to test resistance there.
Intermediate wave (B) may not move beyond the start of intermediate wave (A) above 2,940.91.
Primary wave 4 may not move into primary wave 1 price territory below 2,111.05.
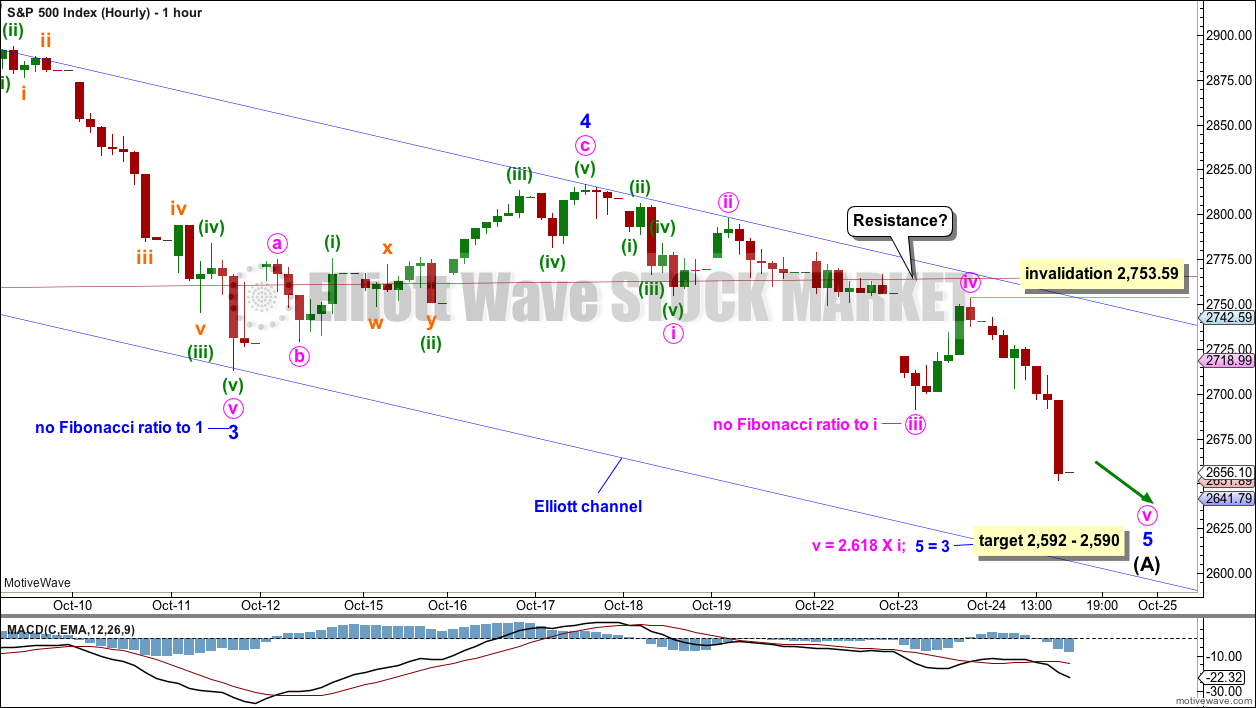
HOURLY CHART
Intermediate wave (A) may be an incomplete five wave impulse. The blue channel is drawn using Elliott’s second technique: The first trend line is drawn from the ends of minor waves 2 to 4, then a parallel copy is placed upon the end of minor wave 3. Minor wave 5 may end mid way within the channel, or it could end about the lower edge if it is particularly strong.
Because there is no adequate Fibonacci ratio between minor waves 3 and 1, it is more likely that minor wave 5 may exhibit a Fibonacci ratio to either of minor waves 3 or 1.
Within minor wave 5, there is no adequate Fibonacci ratio between minute waves iii and i. It is more likely that minute wave v may exhibit a Fibonacci ratio to either of minute waves iii or i.
A target is calculated at two degrees. However, this target may be too low as price may find support about 2,610 to 2,600.
Within minute wave v, no second wave correction may move beyond its start above 2,753.59.
When the structure of intermediate wave (A) could be seen as complete, then a subsequent new high above 2,753.59 would then provide confidence that intermediate wave (A) should be over and intermediate wave (B) should then be underway.
The trend remains down at this stage. The target may be reached tomorrow.
TECHNICAL ANALYSIS
WEEKLY CHART
Click chart to enlarge. Chart courtesy of StockCharts.com.
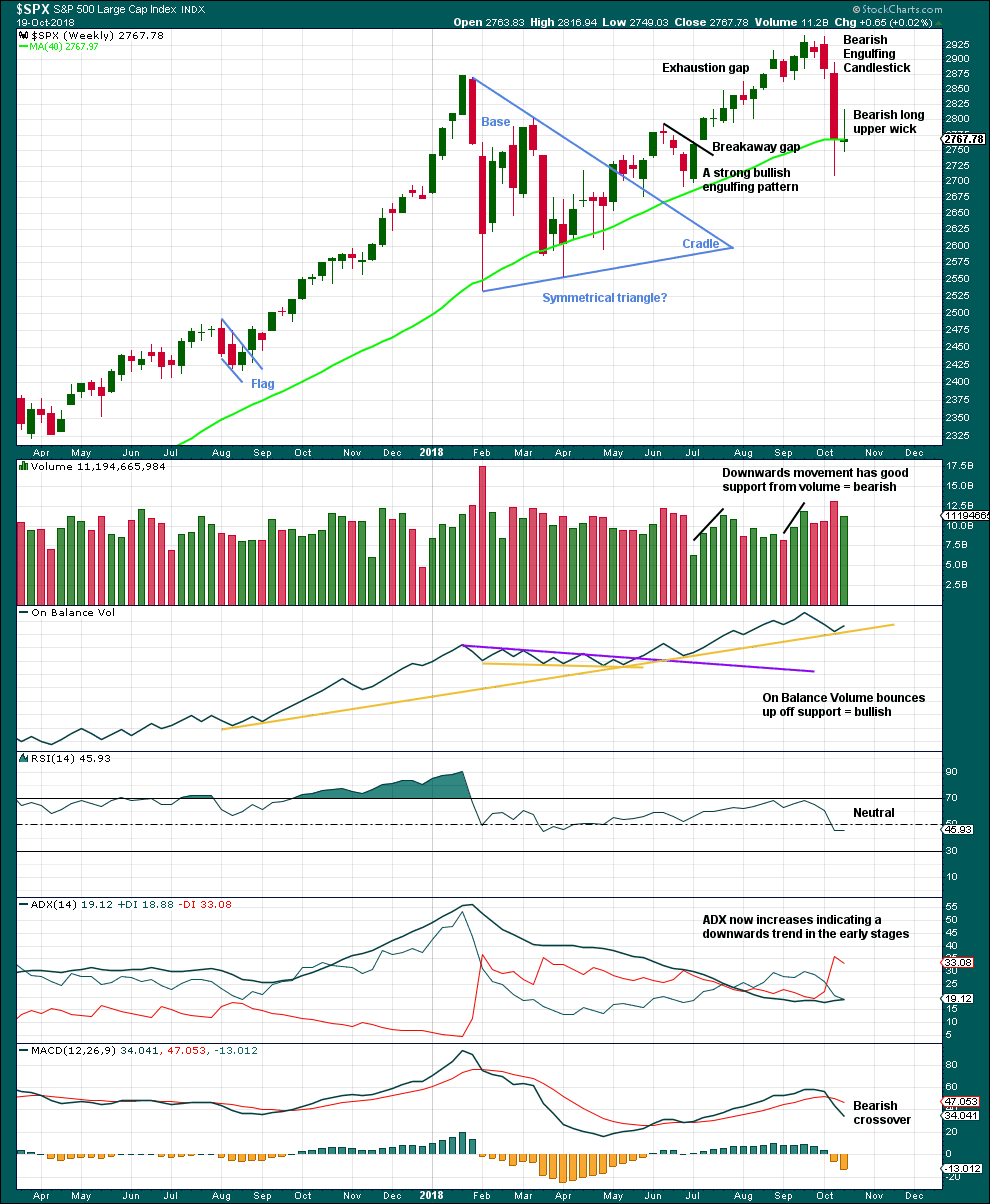
The bearish long upper wick on the last weekly candlestick is contradicted by a bullish signal from On Balance Volume. Downwards movement here may be limited as On Balance Volume may find support with one more downwards week.
DAILY CHART
Click chart to enlarge. Chart courtesy of StockCharts.com.
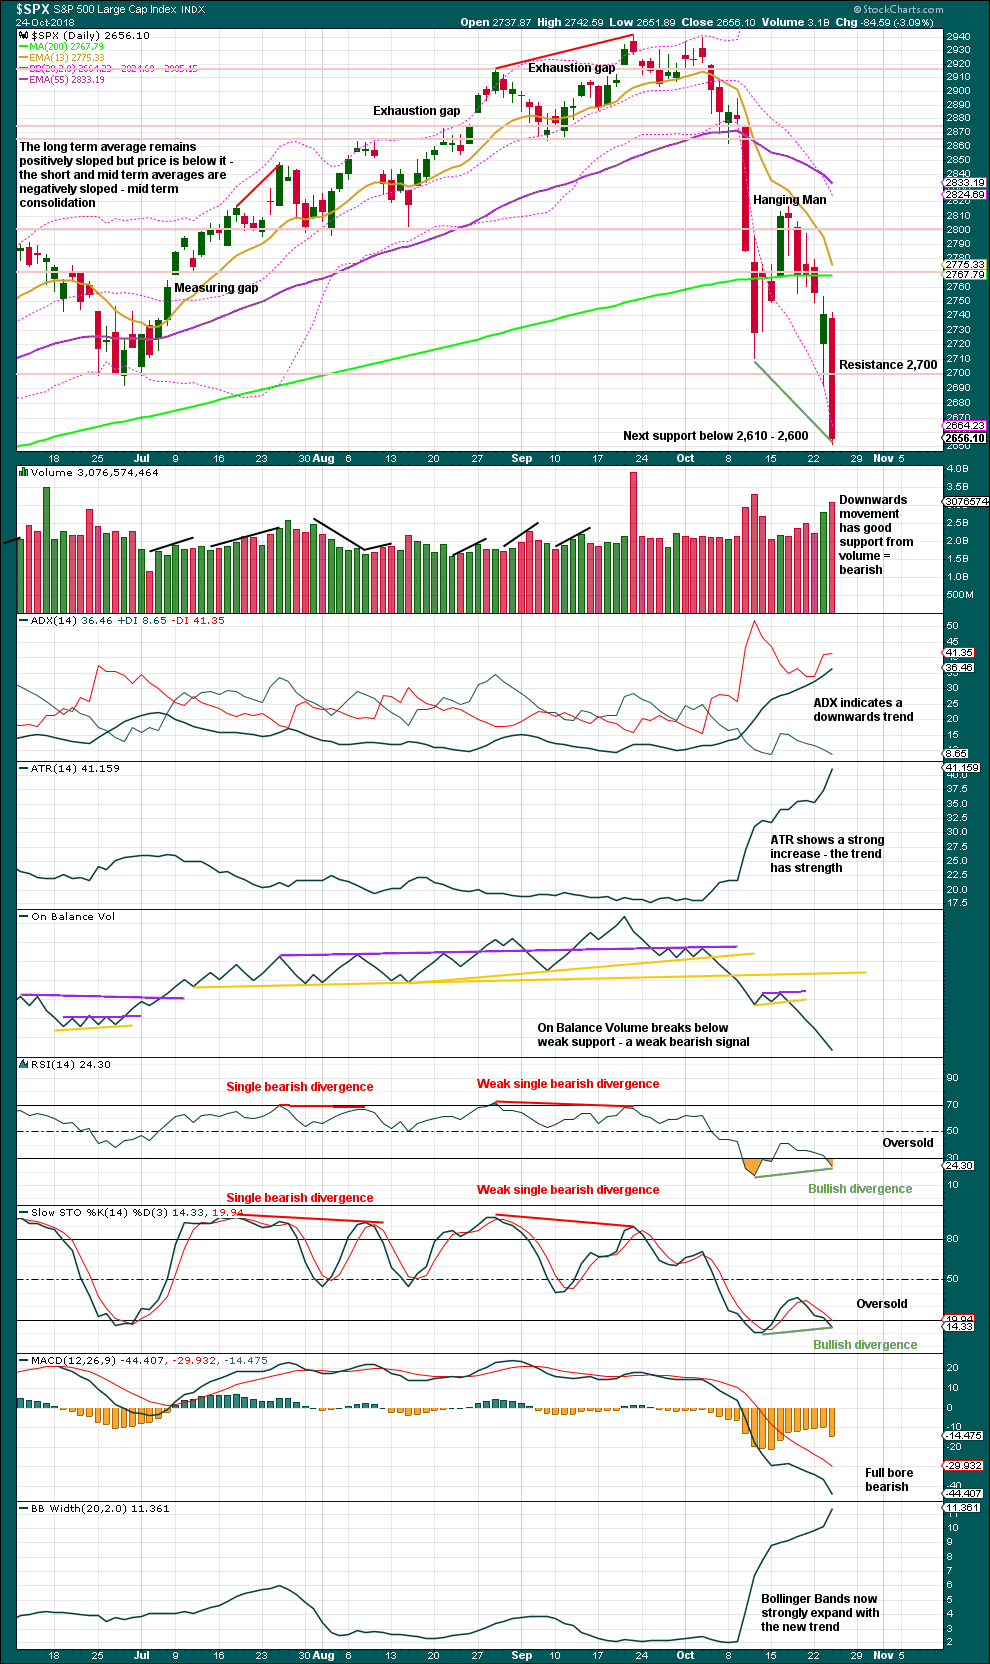
Another strong downwards day with strong support from volume and price closing about the low for the session altogether looks bearish. Another downwards day may be reasonably expected tomorrow.
There is some weakness in this downwards movement as bullish divergence between price and both of RSI and Stochastics remains. Sometimes this divergence can simply disappear though. If tomorrow completes another strong downwards day and this divergence disappears, that would be very bearish. But for now the data in hand indicates weakness, so this may limit downwards movement.
BREADTH – AD LINE
WEEKLY CHART
Click chart to enlarge. Chart courtesy of StockCharts.com.
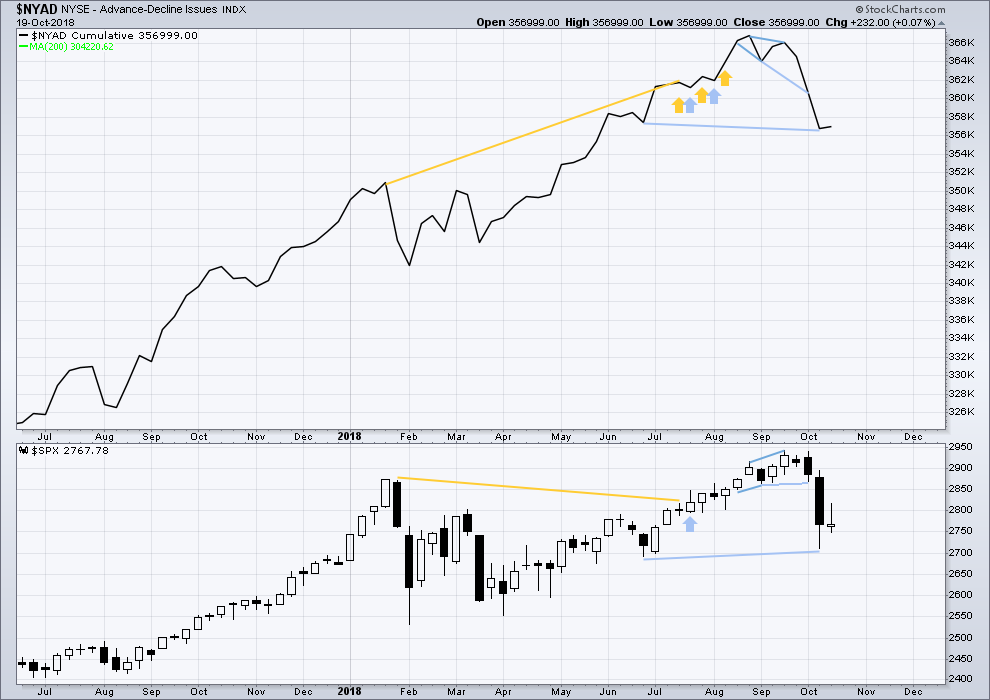
When primary wave 3 comes to an end, it may be valuable to watch the AD line at the weekly time frame as well as the daily.
The AD line has made a slight new low below the prior swing low of the week beginning 25th June, but price has not. This mid term divergence is bearish, but it is weak.
Upwards movement within last week has support from a slight increase in the AD line. There is no new short term divergence.
DAILY CHART
Click chart to enlarge. Chart courtesy of StockCharts.com.
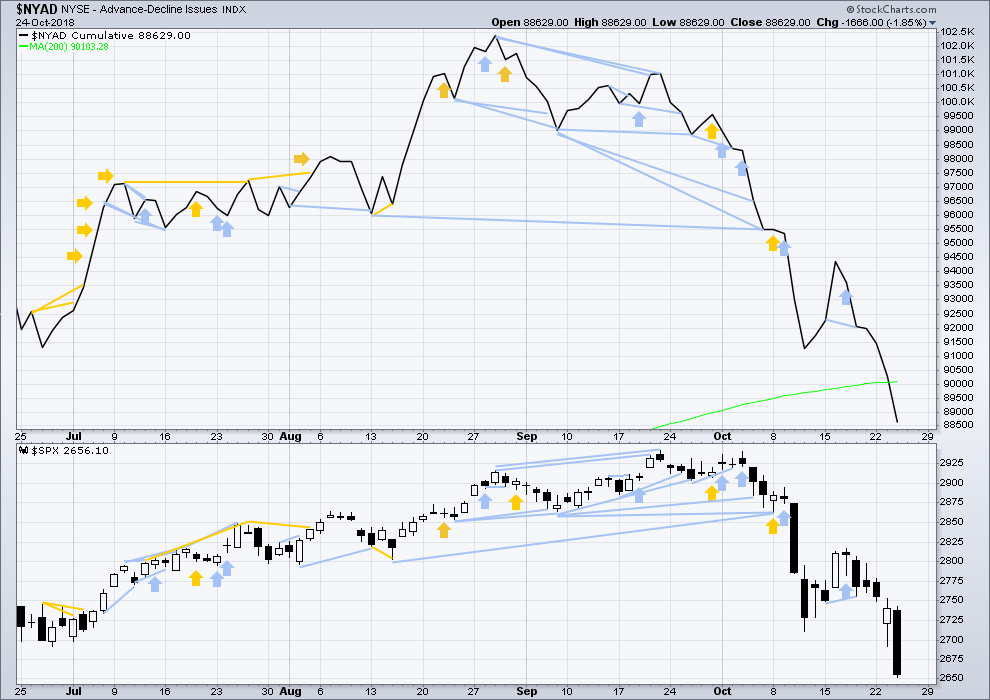
There is normally 4-6 months divergence between price and market breadth prior to a full fledged bear market. This has been so for all major bear markets within the last 90 odd years. With no longer term divergence yet at this point, any decline in price should be expected to be a pullback within an ongoing bull market and not necessarily the start of a bear market. New all time highs from the AD line on the 29th of August means that the beginning of any bear market may be at the end of December 2018, but it may of course be a lot longer than that. My next expectation for the end of this bull market may now be October 2019.
Breadth should be read as a leading indicator.
The AD line has made a new low below the prior low of the 15th of October, but price has not. This divergence is short term and bearish; it is reasonable, but it is not very strong. This supports the first two Elliott wave counts.
Strong downwards movement today has support from a decline in market breadth, but breadth is not falling any faster than price. There is no new divergence.
All of small, mid and large caps today had strong downwards days and all have closed about their lows for the session. Another downwards day tomorrow looks most likely.
VOLATILITY – INVERTED VIX CHART
WEEKLY CHART
Click chart to enlarge. Chart courtesy of StockCharts.com. So that colour blind members are included, bearish signals
will be noted with blue and bullish signals with yellow.
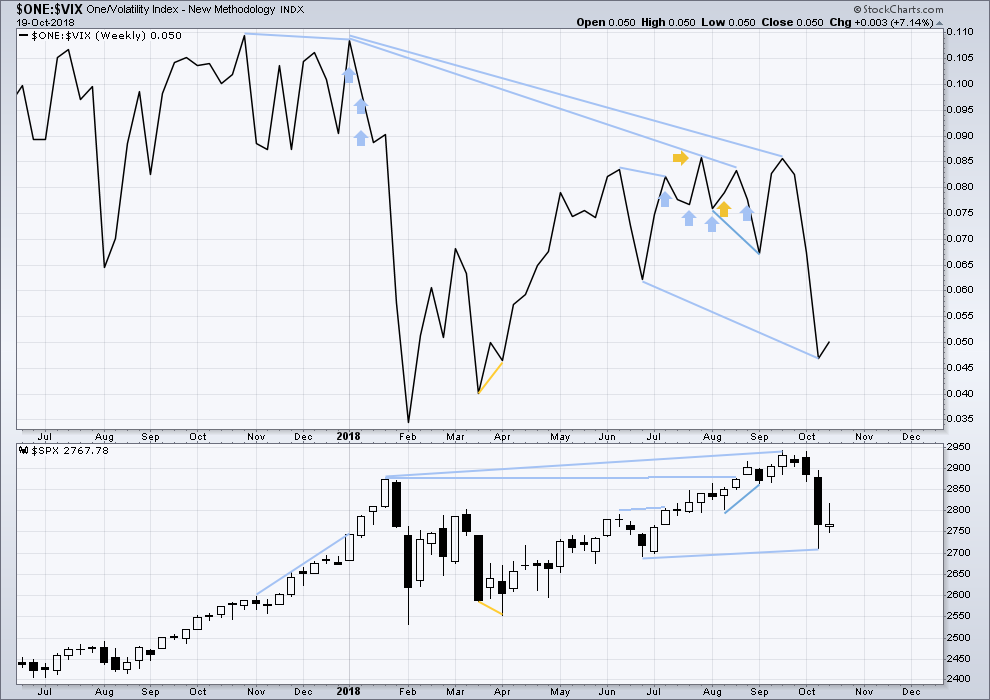
Primary wave 4 has now arrived and is showing reasonable strength. There is continuing mid term bearish divergence with inverted VIX making a new low below the prior swing low of the week beginning 25th June, but price has not yet made a corresponding new low.
As primary wave 4 continues this weekly chart may offer a bullish signal at its end.
Last week completed an inside week with the balance of volume upwards and a green weekly candlestick. A small upwards movement from inverted VIX offers no new short term divergence.
DAILY CHART
Click chart to enlarge. Chart courtesy of StockCharts.com. So that colour blind members are included, bearish signals
will be noted with blue and bullish signals with yellow.
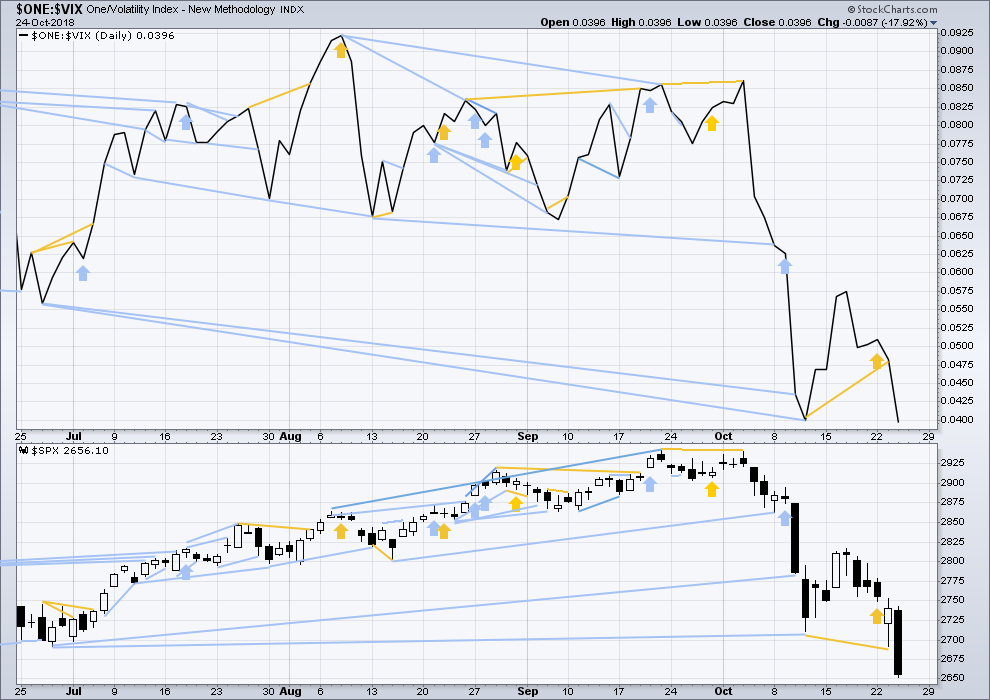
Normally, volatility should decline as price moves higher and increase as price moves lower. This means that normally inverted VIX should move in the same direction as price.
While price moved strongly lower today to make a strong new short term swing low below the low of the 11th of October, inverted VIX has only made a very slight new low. While there is no divergence, price is falling faster than VIX is rising, which is slightly bullish.
DOW THEORY
The following lows need to be exceeded for Dow Theory to confirm the end of the bull market and a change to a bear market:
DJIA: 23,344.52.
DJT: 9,806.79.
S&P500: 2,532.69.
Nasdaq: 6,630.67.
ANALYSIS OF INTERMEDIATE WAVE (4)
TECHNICAL ANALYSIS
Click chart to enlarge. Chart courtesy of StockCharts.com.
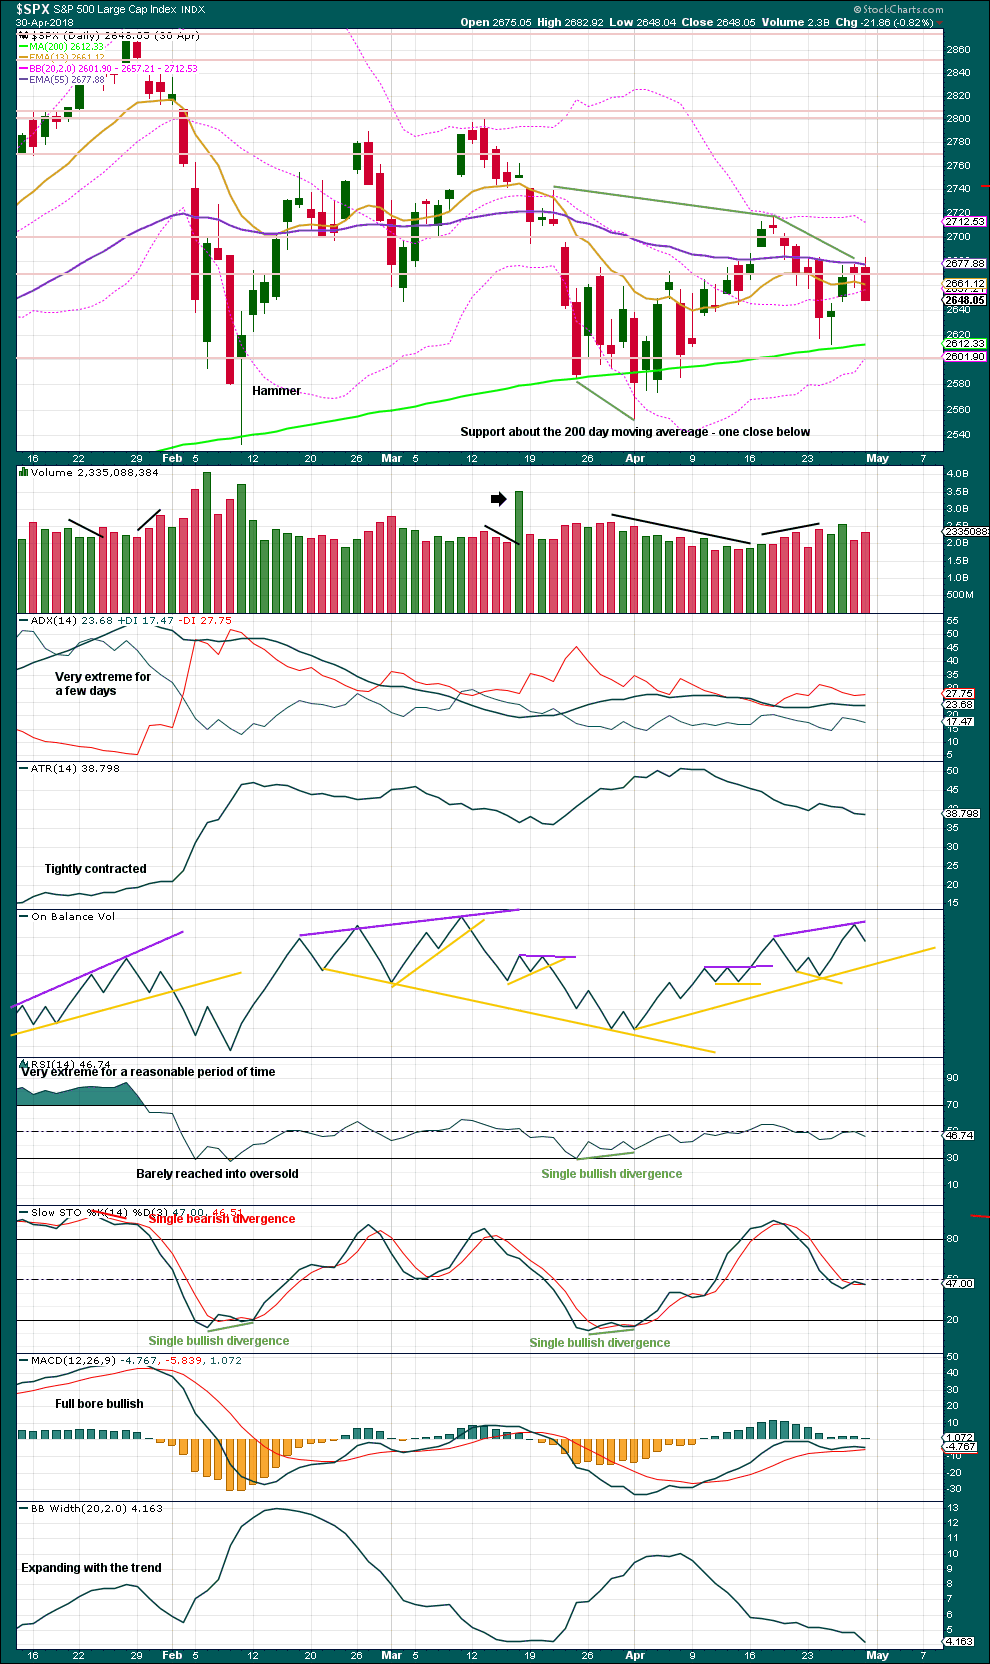
Intermediate wave (4) was a large symmetrical triangle. The deepest wave was the first wave. At its low there was a clear candlestick reversal pattern and bullish divergence between price and Stochastics.
RSI barely managed to reach into oversold.
The current correction for primary wave 4 may behave differently, but there should be some similarities.
It is expected that primary wave 4 may be stronger than intermediate wave (4).
VIX
Click chart to enlarge. Chart courtesy of StockCharts.com.
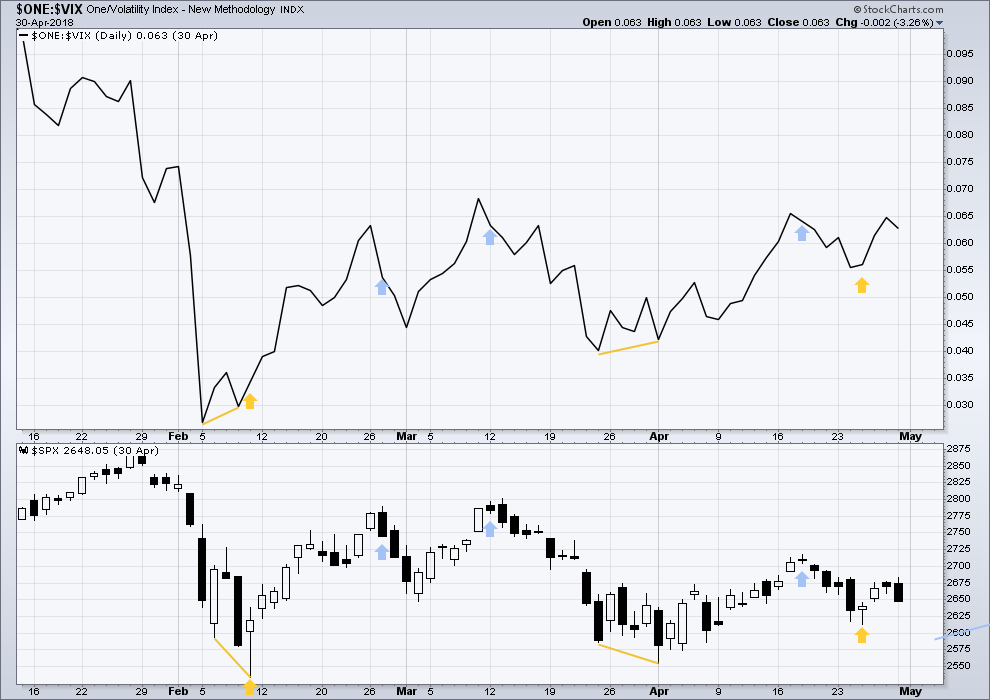
This is a daily chart.
At the two major lows within intermediate wave (4), inverted VIX exhibited single short term bullish divergence.
At highs within intermediate wave (4), inverted VIX exhibited one single day bullish divergence with price.
AD LINE
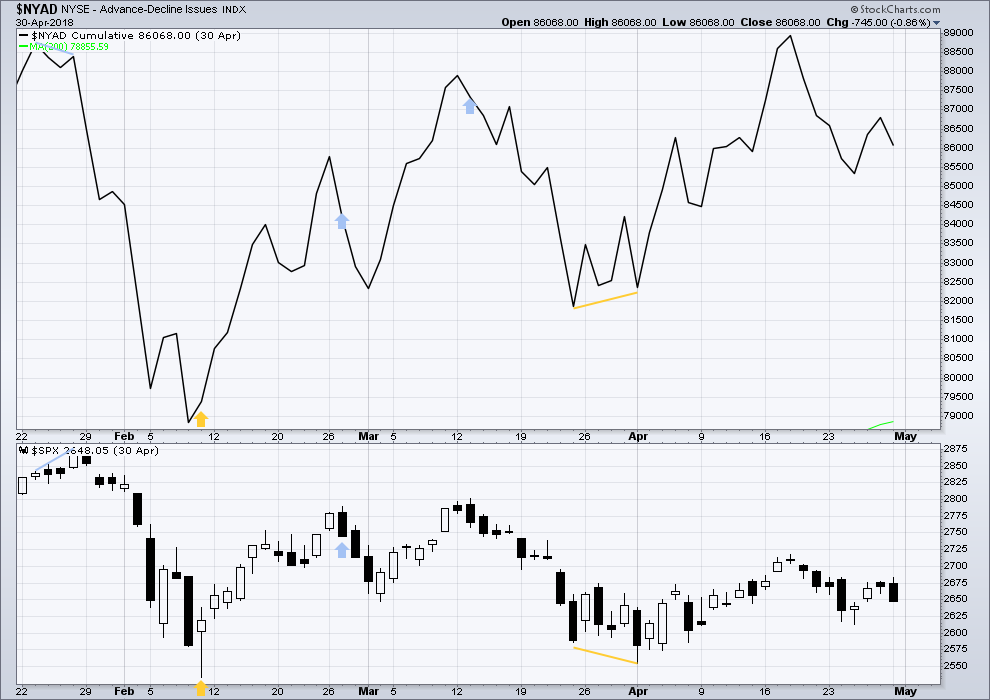
Click chart to enlarge. Chart courtesy of StockCharts.com.
This is a daily chart.
At the two major lows within intermediate wave (4), there was bullish divergence between price and the AD line. At the two major highs within intermediate wave (4), there was each one instance of single day bearish divergence.
Published @ 08:07 p.m. EST.
—
Careful risk management protects your trading account(s).
Follow my two Golden Rules:
1. Always trade with stops.
2. Risk only 1-5% of equity on any one trade.

ES fair value all jacked up now too.
ES down hard. Today’s cash session looked corrective to me. But it would be a “B” wave, so why not?
As always, I happily yield to Lara’s view. But for now, like many others here, I’m waiting for more confidence that we have a low in place.
Hi Lara,
Could you please do a quick video of how to import cash prices of S&P into MotiveWave again or send a link to the last time you did one?
Many thanks.
Here’s the last video where I show you how to do this. It’s for Bitcoin, but the process is the same.
I start the data import at 5:50
The European close was a little suspect too.
Looks Like you’re right Verne
I bet we gap up on GDP and reverse down elevator.
🙂
Zero question in my mind the B wave up has launched. The giant % up numbers on everything tells the story. “Tops are a process…BOTTOMS ARE AN EVENT.” Yesterday/today being said event. Boom!! The tech #’s are nuts, 2.6%-7.4% across the FAANGM group, average of 5.5%. NQ up 3.5%, RUT up 2.6%, ES lagging a tad at 2.2%. It’s a bounce…but almost certainly just the start of a multi-day to week+ bounce. The A down took 15 trading days from the high. I’d expect 3-10 for B.
Bull Trap.
W5 tomorrow or Monday?
If I were to guess, I would say tomorrow to try and keep traders uncertain about what to do over the weekend. VIX should give a good clue. 🙂
That’s how I feel too, so I have a small short position. I either make a small sum or learn another lesson.
Win win. Lol
I am not pulling the long position trigger just yet. As I said (I think yesterday), if I don’t have a position for the Intermediate B wave, I am okay. Generally I come away asking for a T shirt that reads, “I Hate B Waves”. If we get one more new low in the next three days or so, I may go long depending how much damage is done on the way down to the next low. I am surprising myself with such patience. Man, I am getting old for sure!
BTW, now $NYMO, McClellen Oscillator needs to close above zero to give a bullish confirmation signal to the positive divergence it issued yesterday. Currently, 15 minutes before the close, it is around -27. So it does not look like the confirmation signal will be issued today. It might be though tomorrow.
Today will be an inside day for the SPX on the daily level. Not the most bullish of candle sticks. It will also sport an upper wick that is much longer than the lower wick. Again, not the most bullish of candle sticks. But perhaps that is what we should expect from a B wave, theoretically a counter trend wave.
Yes. However, the view is rather different down a TF, at the hourly. It’s a pretty solid V bottom. It wasn’t a “reversal day” pattern in and of itself, but as Lara has noted several days in a row, some traditional candlestick indicators aren’t playing out right now. It was a massive up move. But we’ll see if the sell off out of it underway already rolls us even further lower. I’m only short at the moment…
oh wow, 5 minutes to close and Ameritrade/ToS is down. No data coming in. Wow…
🙂
The end of intermediate (A) is proving annoyingly difficult to find.
Again today it looks like it should now be in, with no warning from candlestick wicks at all.
First, look for resistance at the blue trend line. After that, the maroon line.
If price can break out of the blue Elliott channel, that would provide trend channel confirmation that intermediate (A) should be over and intermediate (B) should be underway.
Talkin’ to myself today. That’s okay, my shrink sez! NDX approaching it’s big down trend line, possible turn spot there. If not, then the combination of the symmetric projection of the biggest upward pullback just happens to land on a key 78.6%. Which is exactly at a lot of resistance over the last few weeks. Another high potential turn spot.
Bro, love your posts…. but I have nothing to say except this market is tricky as hell
Agreed, just re-loaded (not trading advice)
best of luck man. a down day after a monster bounce like today would seem likely. my beyond tomorrow view is bullish however, for another week or so.
Thanks, already up 7 handles…..
We cut it just bit finer. Got out and re-loaded 15 minutes after you did! 🙂
I got short as well, when all the indexes started to jitter down. Let ‘er rip.
Winning Boys, Nice!!
As you would say, my man….”DUH!” 🙂
Starting to feel like a second posse…
Twitter gets real quiet when markets tank. Comments here get real quiet when it ramps.
SPX on 5 minute in a “coiling” structure now, entered from below…let’s see if it behaves according to Hoyle, or not! Other mkts showing similar flag-like consolidation structures entered from below.
SPX hourly appears early in the run up to at least close to the upper EW channel line coming down, around 2736 to 2740 range. Though that may change.
SPX looks like an impulse up on the 5 minute that’s now in the iv. RUT and NDX fairly similar. Took my morning “round 1” profit…waiting for reentry if/as they all turn back up as one. Which has now happened…very short tf knife work for me today.
RUT running with A/D at 5-1, and seems strongest of indices today (though I don’t monitor DJX much).
I haven’t held as few positions as this in well over a year! It’s good. Enables total focus on the “bleeding edge”.
RUT reaching the 1.27 extension of the first move up this morning. SPX sideways now. NDX and monsters of tech sideways. We might see some selling starting up Real Soon Now.
Selling didn’t last long and I got in another long position…and flat again. Working RUT and SPX via IWM and SPY puts (selling for longs). Here’s my current hourly view.
I’m sellin’ puts today for my tactical longs. Prices being sky high and should fall if/as the market ascends. Bull call spread skews are outtasite. Keeping twitchy fingers, anticipating this is the start of B up but if the market says no….
Got it. First.
I am back from my travels today and ready to go long soon.
Kevin, on Wednesday you asked it I had any particular indicator etc that led me to believe the bottom was not yet in. The answer is yes. But first, I have to tell you I actually sang (out loud) your “I’m A Believer” rendition. Fabulous lyrics and many laughs. As you said, I will accept a part of the blame.
The combination of a few things led me to suspect the bottom was not yet in. First, I’ve been looking at the apex / crux of the Intermediate 4 triangle as a magnet. Secondly, I was looking for SPX to close below its lower BB. Third, I was waiting for the McClellan Oscillator to give a positive divergence. Fourthly, I was presented with a statistic. It is this , in the last 20+ times the SPX has been down five days in a row, 93% of the time it was followed (in a few days) by a lower low. Based on all those things and the fact that there was the possibility that an alternate EW count such as today’s was viable, I was looking for another low.
I did not expect an 83 point drop. But I am not surprised by it.
Now, where and when to enter long is the next question. I suspect it will be before the end of the week. But it could go into early next week as well. Right now, I am trying not to reach out for that falling knife. I take Chris’s warning about margin calls very seriously.
Once I get long around 2600 SPX or so, I look forward to the ride up to 2900 for sure and ultimately 3600. We have yet to see a buying panic in this bull market. Oct 2018 to Jan 2018 was the closest so far. I think the next buying panic will out perform that period of time substantially.
You all have a good night and safe day tomorrow.
Interesting. Thanks very much for sharing your analysis there Rodney.
I note the apex of intermediate (4) triangle is about 2,583. That would see the end of primary wave 4 overshoot the teal trend channel on my weekly chart. This is entirely possible at its end.
I’m looking at the McClellan Oscillator, and at the daily chart level it would have had a strong bullish divergence with price between yesterday’s low and the low of the 11th of October. Would you please be able to elaborate on what you saw yesterday as missing? Which time frame and what price points were you looking for divergence that wasn’t there yesterday?
I’m wanting to see if there’s something I missed that would help me next time.
Thanks Rodney!
Lara,
Regarding the apex of the Intermediate 4 triangle, I’ve mentioned several times it all depends on how one draws the trend lines. I am not as precise or consistent as you in drawing trend lines, so my trend lines may vary significantly. As a result when I speak of this I am looking for a general / approximate pattern. Furthermore, this only happens sometimes. But it was one piece of evidence among many giving some reasonable doubt the bottom was in.
Regarding the positive divergence on the McClellan Oscillator, only the end of day print counts. That is really important. The low in the McClellan Oscillator was -97.28 on October 11th at SPX 2728. Even though the SPX made a new intraday low on October 23rd, it closed at 2740. It was not a new closing low. Yesterday, Oct. 24th, we had a new end of day low in SPX at 2656 but the McClellan Oscillator closed at around a -62 above its low of -97.28 . This was the positive divergence I was looking for. That being said, I’ve seen $NYMO (McClellan Oscillator) print two or more positive divergences in a row before the bottom is in.
By the way, I don’t use the McClellan Oscillator for picking tops as it is not reliable. It just does not seem to work with any consistency.
I hope this helps in some small way. It is the least I can do / offer to this blog as it has been so very helpful to me. BTW, my participation here has been a bit stifled and erratic over the past few weeks. Three weeks ago I lost consciousness three times in the matter of ten minutes or so while displaying all the classic symptoms of a heart attack except for pain in the chest. I was rushed to the hospital by ambulance and spent two nights there undergoing all imaginable tests. I did not have a heart attack nor a stroke. It turns out my heart is giving off PVC’s, premature ventricular contractions. This will hopefully be treated with a medication. The first week on the meds, I felt better than I have in two years. But this past several days, my ticker is not working well and I have felt horrible. I have another doctor’s appointment today to hopefully adjust / increase the dosage of the medicine for better treatment. Then I will see a cardiologist soon. On top of all that, I need to get this settled because I am scheduled on January 10, 2019 for the first of two full shoulder replacements next year.
Boy oh boy, it sucks when the body gets old, tired, and worn out. It was just this past September 21st, my 64th birthday, that I hiked 5 miles up a mountain with over 2000 feet elevation gain and then back down all in five hours. How quickly things can change. It reminds me, I should daily count my blessings and be grateful. I am grateful for EWSM!
Best of health rod.
I see now what you were looking for re positive divergence. Thank you very much for explaining it so clearly Rodney. I’ll be adding this tool to my kit.
I am so sorry to hear your health has not been well, and I most sincerely wish you all the best. I hope you find a solution to make life more comfortable and active.
I have had some issues with my blood sugar (quite minor really) and Cesar gave me “The Blood Sugar Diet” by Dr Hyman. It worked perfectly and now my doctor is happy with me 🙂
He has a good approach, finding the source of the problem and improving overall health through diet, exercise and supplements, rather than pharmaceuticals. He might have some information that you may find beneficial here?
You have an excellent Dr. Lara!
Along the those lines, a very common ailment is gout. And the MAGIC CURE for gout is simply about 1200 mg of tart cherry 2x/day. No more gout. Works for me, and has worked for several others I know.
Healing vibes your way Rodney. Just getting over a mild case of shingles myself, but nothing like what you got going.
Welcome back Rod!
Just as bearish signals in a strong uptrend are frequently negated, the same but opposite is true during bear markets or high degree corrections when it comes to bullish signals. We saw a stark example of this with some of yesterday’s signals as we did see positive divergences on the 60 min charts. The pole from the bearish flagging action suggests more downside. Substantial technical damage has been inflicted on the markets as there are decisive breaches of many years-long held trend lines. The unraveling of the risk parity trade, outgoing margin calls very likely triggered by this last dive, and the continual flagging action in vol instruments all warrant great caution imho. I know you are a veteran and really don’t need any advice from me but just thought I would throw that out FWIW. I am looking at a long term chart of VX and there could be something significant brewing under the surface. I know you know the classic end-of-wave signal from VIX so I am sure we will both be on the look-out. Stay frosty my friend!
Thanks Rodney. Interesting confluence of indicators you are looking for.
The monthly chart is frightening.
Looking at the daily voer the last 9 months, an A move down here of the same point length as the A of the intermediate 4 would take price to almost exactly 2600. Meanwhile, a cluster of fibonacci extensions are just below today’s closing price (2643-2653), and the 78.6% of the intermediate 4 A down sits at 2622. Lots of potential W/A price bottoms for tomorrow/Friday.
So to sum it up, I’ll be watching for a turn anywhere…but with particular focus on the 2643-2653 range, around 2622, and/or around 2600 Thursday/Friday.