More downwards movement to a target at 2,698 was expected. The low for Monday at 2,691.43 is 6.57 points below the target.
Summary: It looks most likely that a multi week bounce may begin here. It may end above 2,890, and may be as high as 2,916. This view has support from strong bullish divergence between price and RSI, VIX and Stochastics, and a long lower wick on today’s candlestick.
A primary degree correction should last several weeks and should show up on the weekly and monthly charts. Primary wave 4 may total a Fibonacci 8, 13 or 21 weeks. Look for very strong support about the lower edge of the teal trend channel on the monthly chart.
Primary wave 4 should be expected to exhibit reasonable strength. This is the last multi week to multi month consolidation in this ageing bull market, and it may now begin to take on some characteristics of the bear market waiting in the wings.
The final target for this bull market to end remains at 3,616, which may be met in October 2019.
New updates to this analysis are in bold.
The biggest picture, Grand Super Cycle analysis, is here.
Last published monthly chart is here, video is here.
ELLIOTT WAVE COUNT
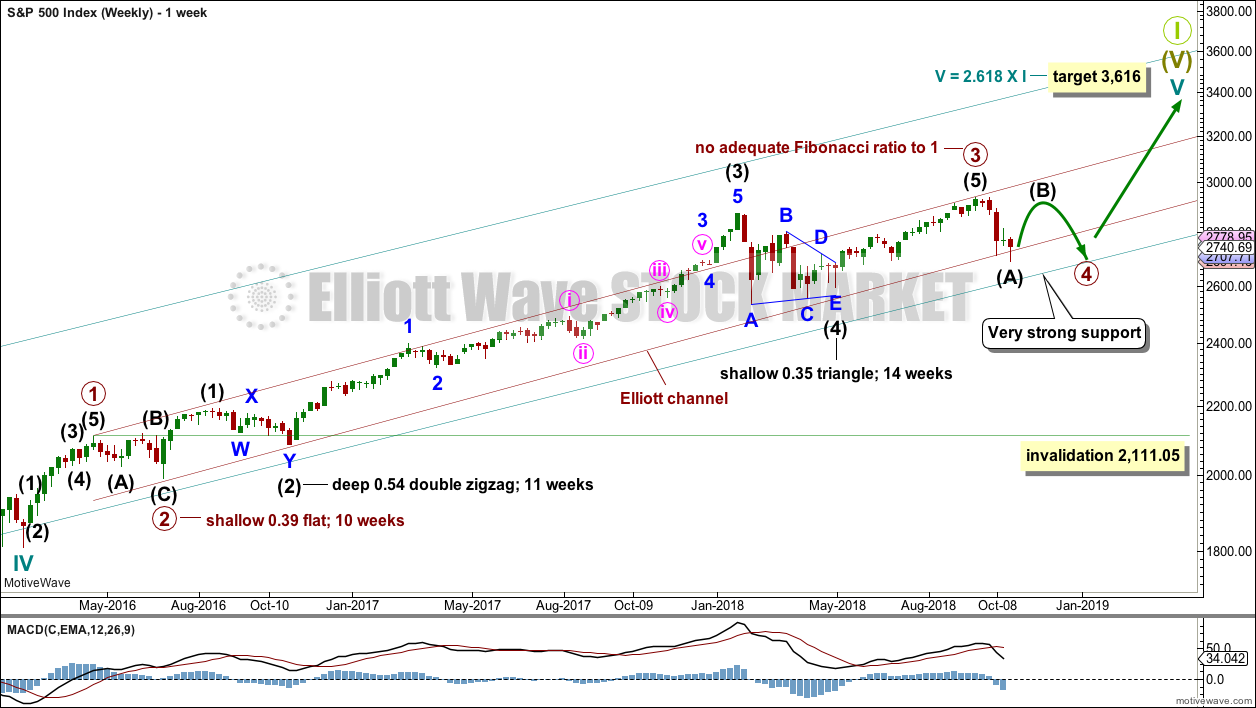
WEEKLY CHART
Cycle wave V must complete as a five structure, which should look clear at the weekly chart level and also now at the monthly chart level. It may only be an impulse or ending diagonal. It is clear it is an impulse.
Within cycle wave V, the third waves at all degrees may only subdivide as impulses.
Within primary wave 3, there is perfect alternation and excellent proportion between intermediate waves (2) and (4).
The channel is now drawn about primary degree waves. The first trend line is drawn from the ends of primary waves 1 to 3, then a parallel copy is placed upon the low of primary wave 2. The overshoot of the upper edge of this channel by the end of intermediate wave (3) looks typical. For the S&P, its third waves are usually the strongest portion of an impulse; they often exhibit enough strength to overshoot channels.
Primary wave 4 now has an overshoot on the lower edge of the channel. This is acceptable; fourth waves are not always neatly contained within channels drawn using this technique.
If primary wave 4 breaks out of the narrow maroon channel, then it may find very strong support about the lower edge of the teal channel. This channel is copied over from the monthly chart and contains the entire bull market since its beginning in March 2009. While Super Cycle wave (V) is incomplete, this channel should not be breached.
Primary wave 4 may not move into primary wave 1 price territory below 2,111.05.
When primary wave 4 may be complete, then the final target may be also calculated at primary degree. At that stage, the final target may widen to a small zone, or it may change.
At this stage, the expectation is for the final target to be met in October 2019. If price gets up to this target and either the structure is incomplete or price keeps rising through it, then a new higher target would be calculated.
DAILY CHART
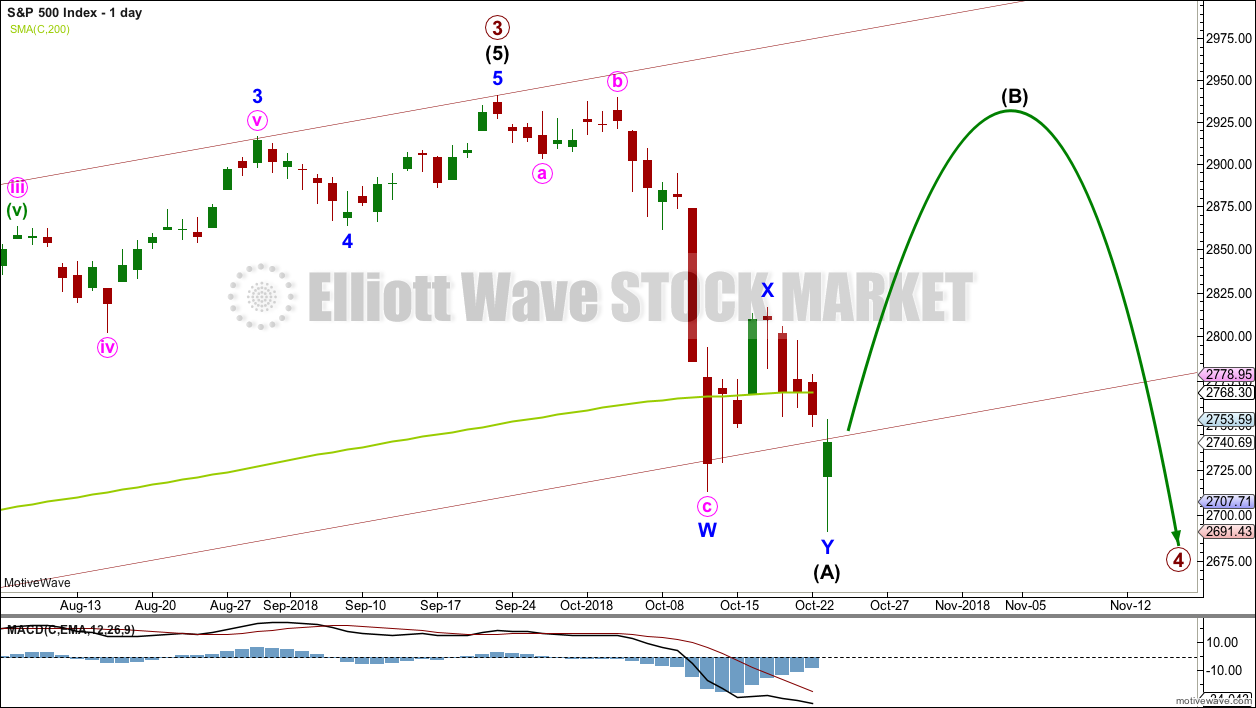
Primary wave 4 would most likely end somewhere within the price territory of the fourth wave of one lesser degree. Intermediate wave (4) has its price territory from 2,872.87 to 2,532.69. Within this range sit the 0.236 Fibonacci ratio at 2,717 and the 0.382 Fibonacci ratio at 2,578.
The 0.382 Fibonacci ratio would expect an overshoot of the teal channel. This may be too low; price may find support at the lower edge of the channel. However, as primary wave 4 should be expected to exhibit reasonable strength, it may be able to overshoot the channel and that would look reasonable.
Primary wave 2 unfolded as a shallow regular flat correction lasting 10 weeks.
Primary wave 4 may have begun with a double zigzag downwards. This is labelled as intermediate wave (A).
If intermediate wave (A) unfolds as a double zigzag, then primary wave 4 may be unfolding as either a flat or a triangle. A double zigzag may not be labelled as intermediate wave (W) because the maximum number of corrective structures is three, and to label multiples within multiples increases the maximum beyond three and violates an Elliott wave rule.
If primary wave 4 is unfolding as a flat correction, then intermediate wave (A) may be a double zigzag. Primary wave B may then bounce higher to retrace a minimum 0.9 length of primary wave A, and may make a new high above the start of primary wave A as in an expanded flat correction.
If primary wave 4 is unfolding as a triangle, then intermediate wave (A) may be a double zigzag. Primary wave B would have no minimum required length, and would most commonly be about 0.8 to 0.85 the length of primary wave A.
Primary wave 4 may not move into primary wave 1 price territory below 2,111.05.
HOURLY CHART
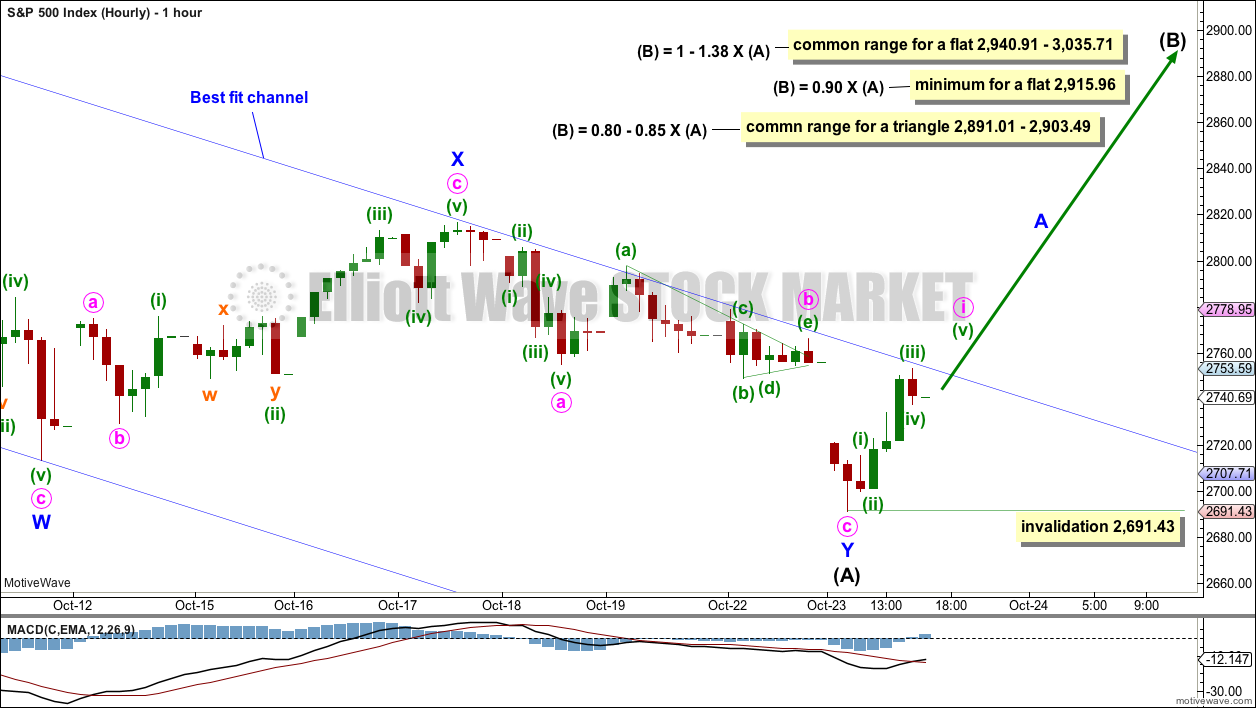
Intermediate wave (A) may a complete double zigzag.
Intermediate wave (B) may have begun as a multi week bounce within the larger consolidation of primary wave 4.
If intermediate wave (A) subdivides as a “three”, then intermediate wave (B) may be expected to be a strong bounce that retraces a large portion of intermediate wave (A). Expectations for intermediate wave (B) to end are given on the chart for both possibilities of a triangle or a flat correction.
Intermediate wave (B) may be a relatively quick sharp zigzag or a time consuming sideways combination, flat or triangle. Intermediate wave (B) may be any one of more than 23 possible corrective structures. B waves exhibit the greatest variety in Elliott wave structure and price behaviour, and they are very difficult to analyse. It is impossible for me to tell you which structure intermediate wave (B) will unfold as.
A wave at intermediate degree should begin with a five up on the hourly chart. Upwards movement at this time is labelled minute wave i, which is incomplete. When minute wave i is complete, then minute wave ii may not move beyond its start below 2,691.43.
ALTERNATE DAILY CHART
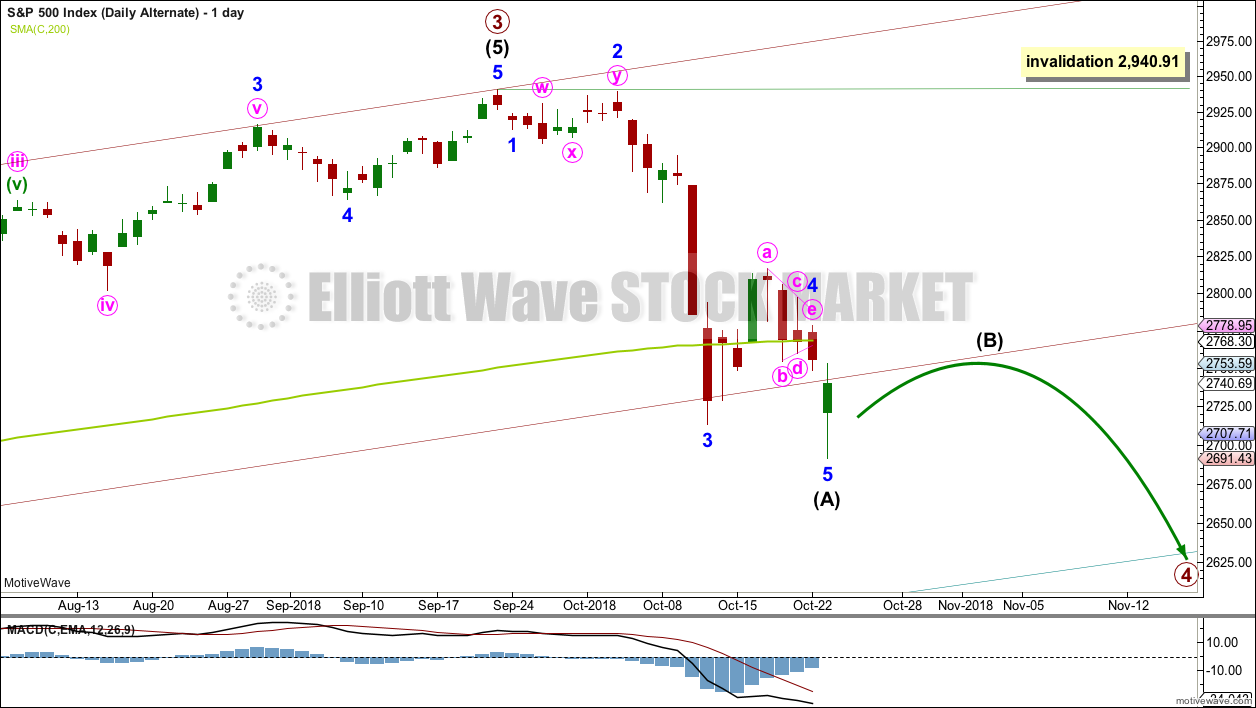
It is also possible to see intermediate wave (A) as an incomplete five wave structure.
With both lasting seven days, there is now excellent proportion between minor waves 2 and 4 within this wave count. Additionally, there is alternation between the deep 0.96 combination of minor wave 2 and the shallow 0.29 triangle of minor wave 4.
Intermediate wave (A) ends below the lower edge of the maroon channel, which is copied over from the weekly chart. Intermediate wave (B) may bounce up to test resistance there.
Intermediate wave (B) may not move beyond the start of intermediate wave (A) above 2,940.91.
ALTERNATE HOURLY CHART
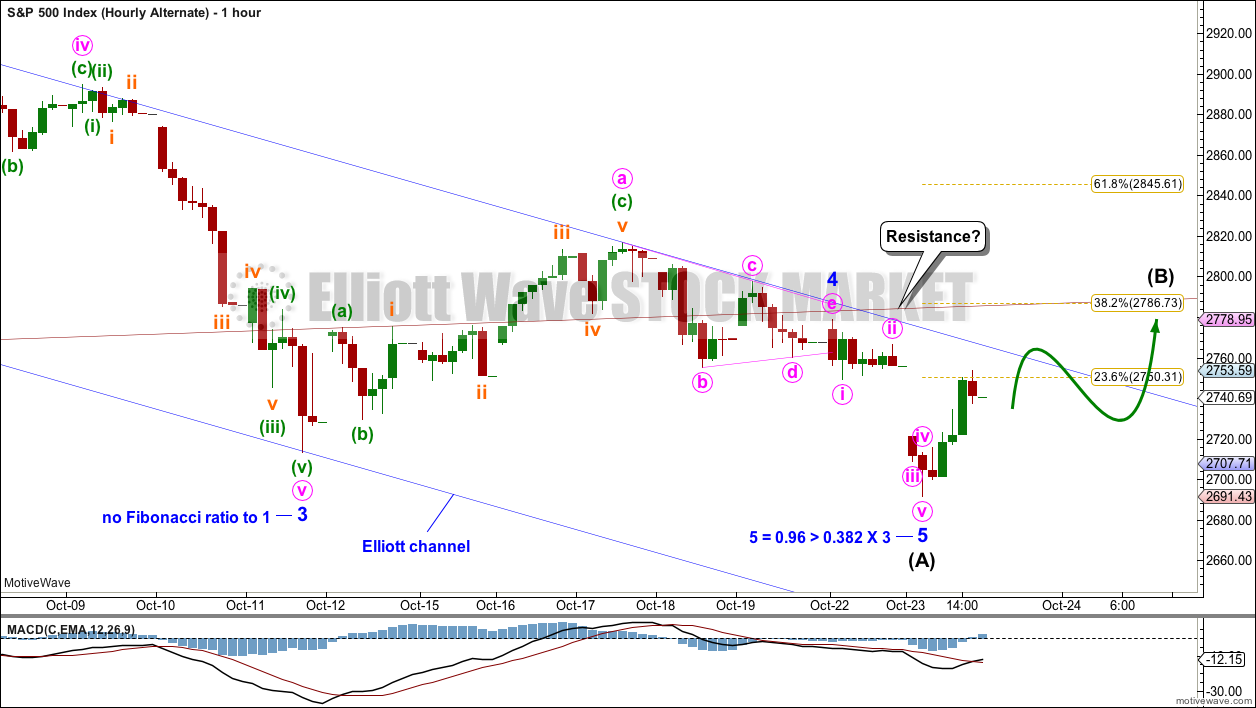
Intermediate wave (A) may be seen now as a complete five wave impulse. There is an excellent Fibonacci ratio between minor waves 3 and 5.
Minor wave 4 is relabelled today as a possible triangle for this wave count. It does not have a very good look, but it does meet all Elliott wave rules.
Intermediate wave (B) may be a shallow sideways consolidation lasting a very few weeks, which may find resistance about the lower edge of the maroon channel. This would see intermediate wave (B) end close to the 0.382 Fibonacci ratio of intermediate wave (A).
TECHNICAL ANALYSIS
WEEKLY CHART
Click chart to enlarge. Chart courtesy of StockCharts.com.
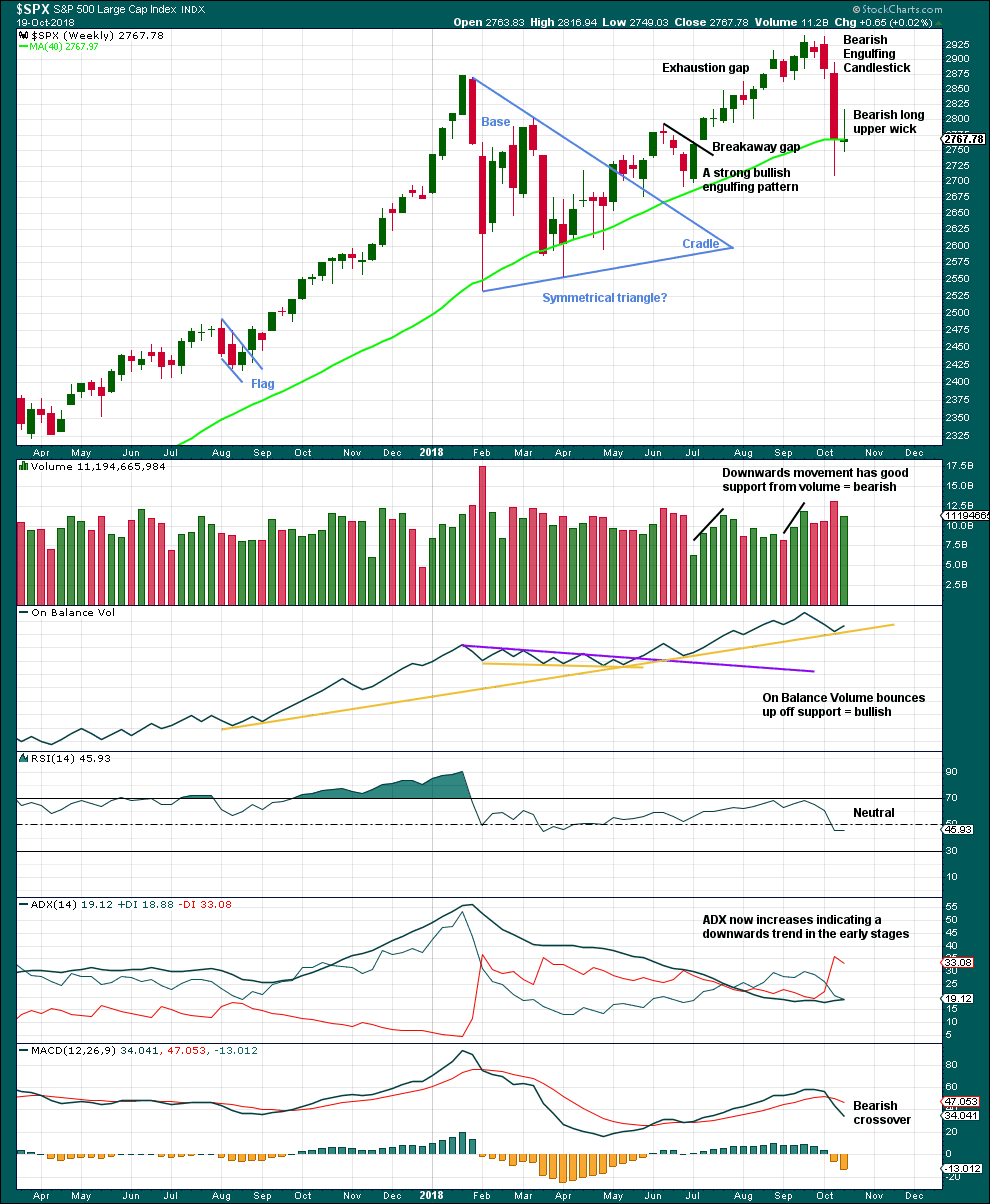
The bearish long upper wick on the last weekly candlestick is contradicted by a bullish signal from On Balance Volume. Downwards movement here may be limited as On Balance Volume may find support with one more downwards week.
DAILY CHART
Click chart to enlarge. Chart courtesy of StockCharts.com.
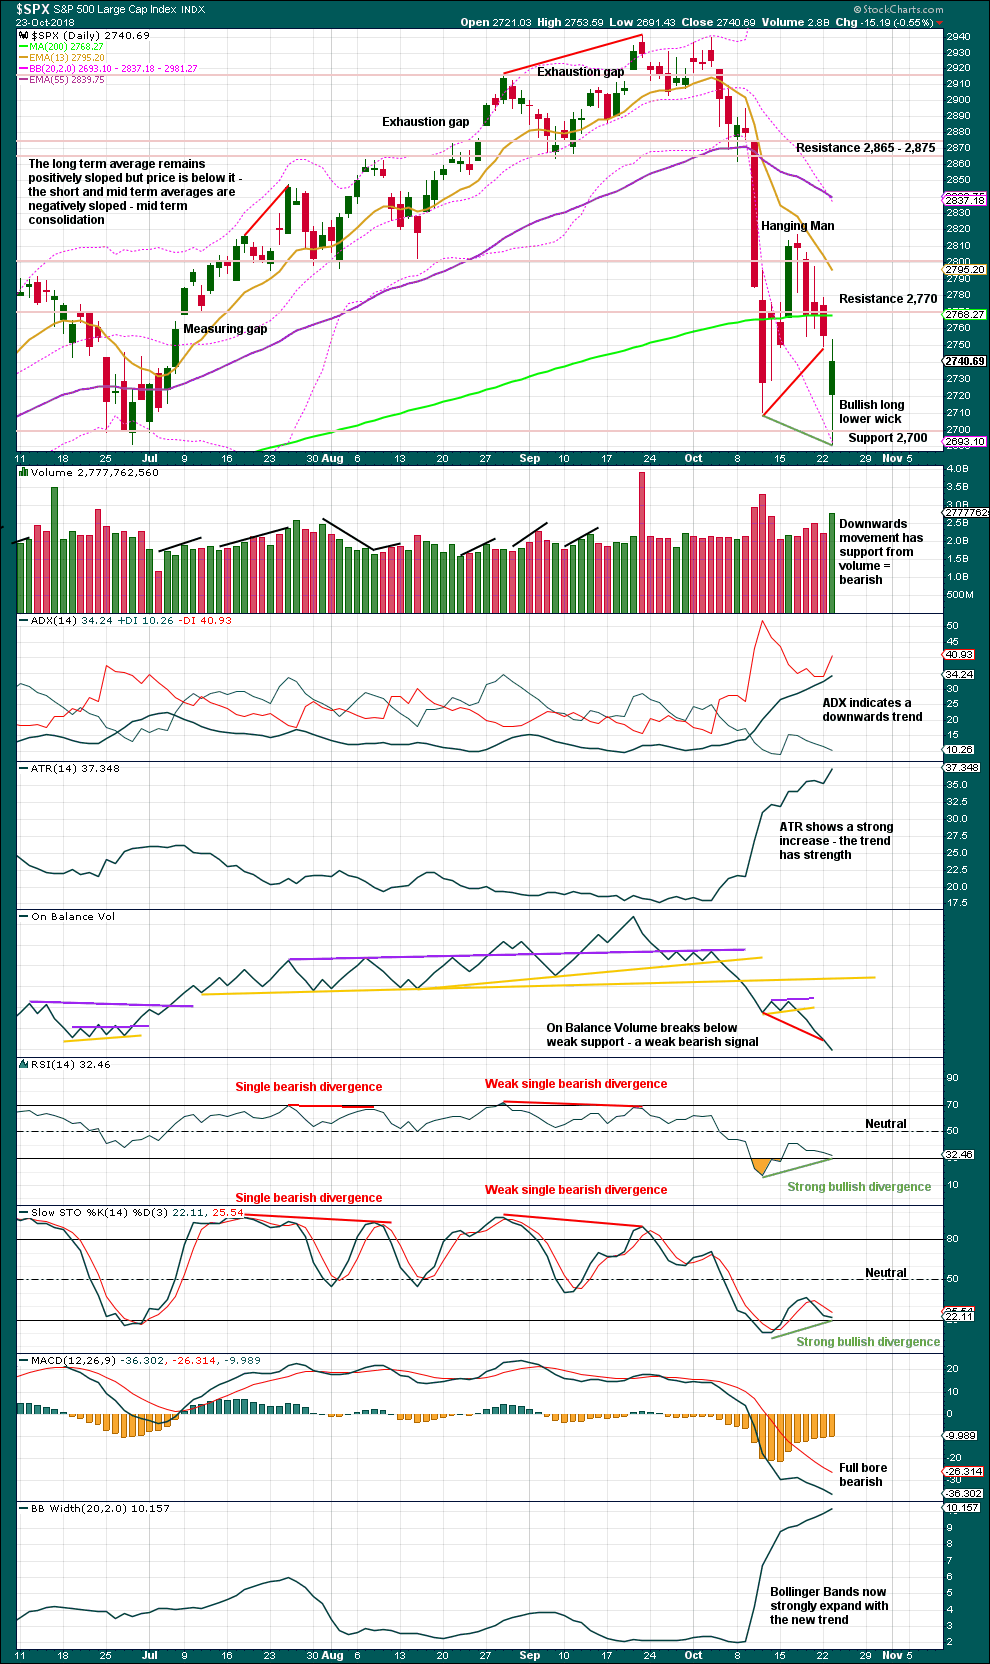
A long lower wick and strong bullish divergence between price and particularly RSI but also Stochastics indicate downwards movement may end here for the mid term. A stronger and more sustained bounce may begin here.
The bounce may be as high as resistance about 2,865 – 2,875.
However, it is slightly concerning that volume supported downwards movement within this session. The strongest hour on the hourly chart was the last hour, which was an upwards hour, but within it the balance of volume was down.
BREADTH – AD LINE
WEEKLY CHART
Click chart to enlarge. Chart courtesy of StockCharts.com.
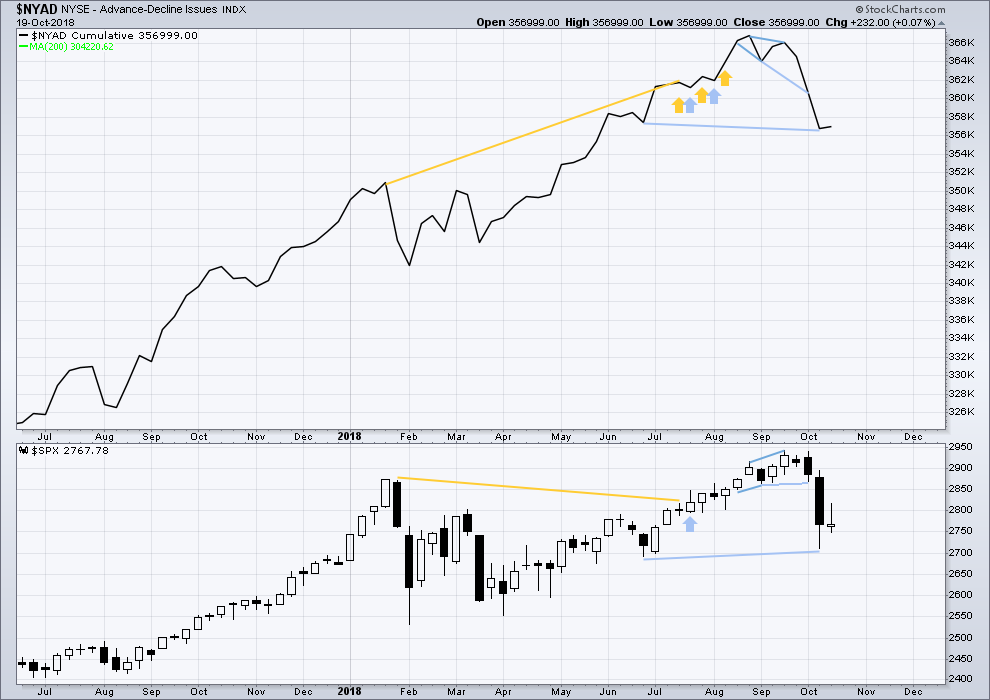
When primary wave 3 comes to an end, it may be valuable to watch the AD line at the weekly time frame as well as the daily.
The AD line has made a slight new low below the prior swing low of the week beginning 25th June, but price has not. This mid term divergence is bearish, but it is weak.
Upwards movement within last week has support from a slight increase in the AD line. There is no new short term divergence.
DAILY CHART
Click chart to enlarge. Chart courtesy of StockCharts.com.
There is normally 4-6 months divergence between price and market breadth prior to a full fledged bear market. This has been so for all major bear markets within the last 90 odd years. With no longer term divergence yet at this point, any decline in price should be expected to be a pullback within an ongoing bull market and not necessarily the start of a bear market. New all time highs from the AD line on the 29th of August means that the beginning of any bear market may be at the end of December 2018, but it may of course be a lot longer than that. My next expectation for the end of this bull market may now be October 2019.
Breadth should be read as a leading indicator.
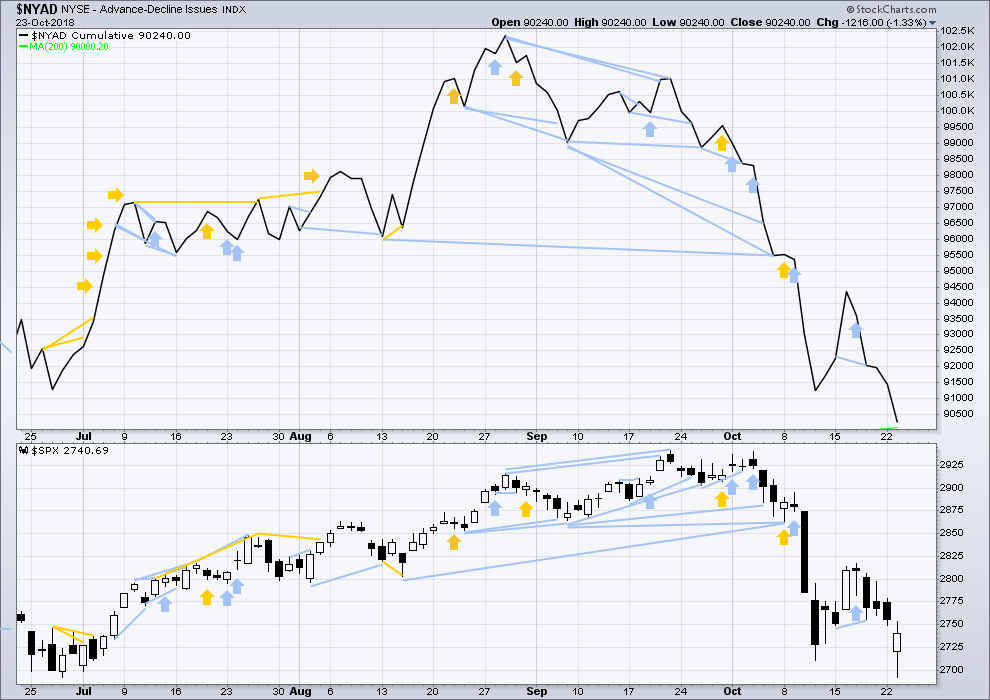
The AD line has made a new low below the prior low of the 15th of October, but price has not. This divergence is short term and bearish; it is reasonable, but it is not very strong. This supports the first two Elliott wave counts.
Downwards movement today has support from a decline in the AD line. There is no new short term divergence, either bullish or bearish.
Both of mid and small caps made new lows today. All have long lower candlestick wicks. Downwards movement has some support from market breadth.
VOLATILITY – INVERTED VIX CHART
WEEKLY CHART
Click chart to enlarge. Chart courtesy of StockCharts.com. So that colour blind members are included, bearish signals
will be noted with blue and bullish signals with yellow.
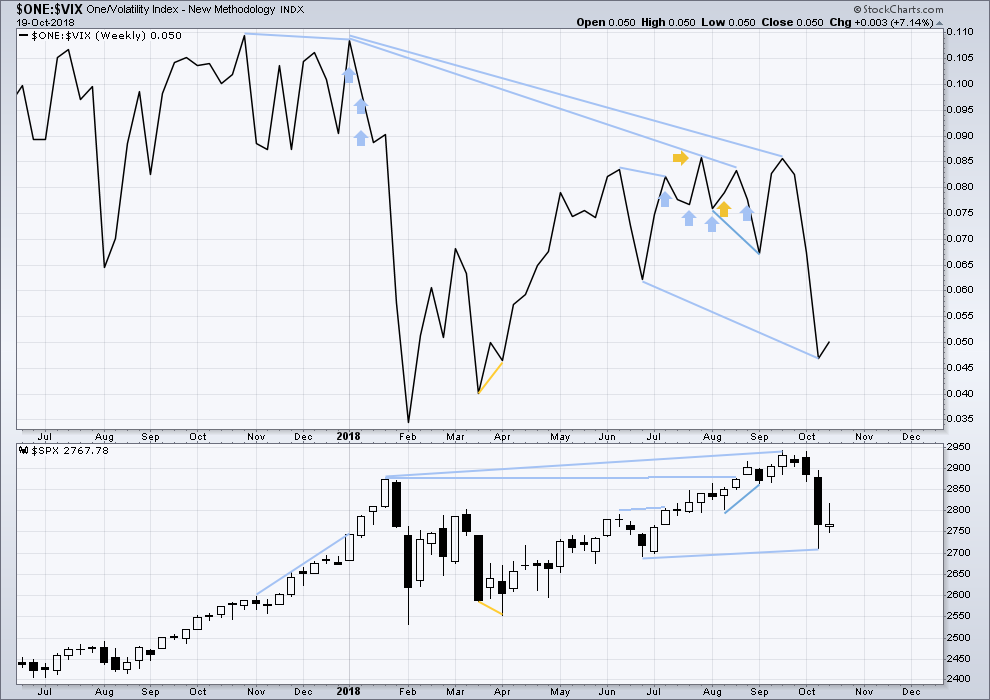
Primary wave 4 has now arrived and is showing reasonable strength. There is continuing mid term bearish divergence with inverted VIX making a new low below the prior swing low of the week beginning 25th June, but price has not yet made a corresponding new low.
As primary wave 4 continues this weekly chart may offer a bullish signal at its end.
Last week completed an inside week with the balance of volume upwards and a green weekly candlestick. A small upwards movement from inverted VIX offers no new short term divergence.
DAILY CHART
Click chart to enlarge. Chart courtesy of StockCharts.com. So that colour blind members are included, bearish signals
will be noted with blue and bullish signals with yellow.
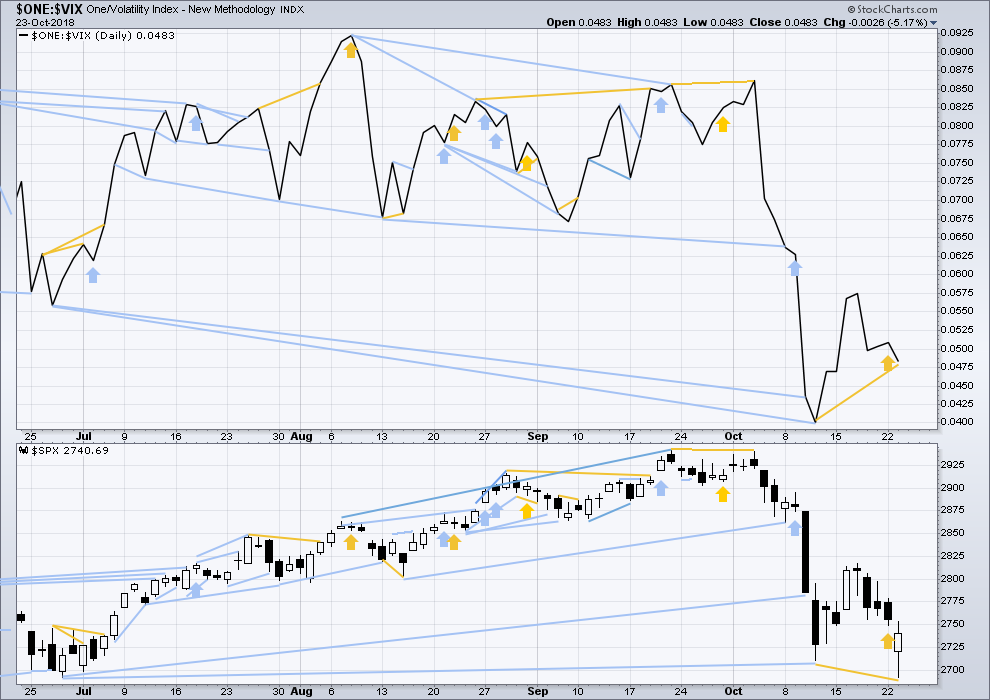
Normally, volatility should decline as price moves higher and increase as price moves lower. This means that normally inverted VIX should move in the same direction as price.
Price has made a new swing low today below the prior low of the 11th of October, but inverted VIX has not. This new low does not have a corresponding normal increase in VIX. This divergence is bullish.
DOW THEORY
The following lows need to be exceeded for Dow Theory to confirm the end of the bull market and a change to a bear market:
DJIA: 23,344.52.
DJT: 9,806.79.
S&P500: 2,532.69.
Nasdaq: 6,630.67.
ANALYSIS OF INTERMEDIATE WAVE (4)
TECHNICAL ANALYSIS
Click chart to enlarge. Chart courtesy of StockCharts.com.
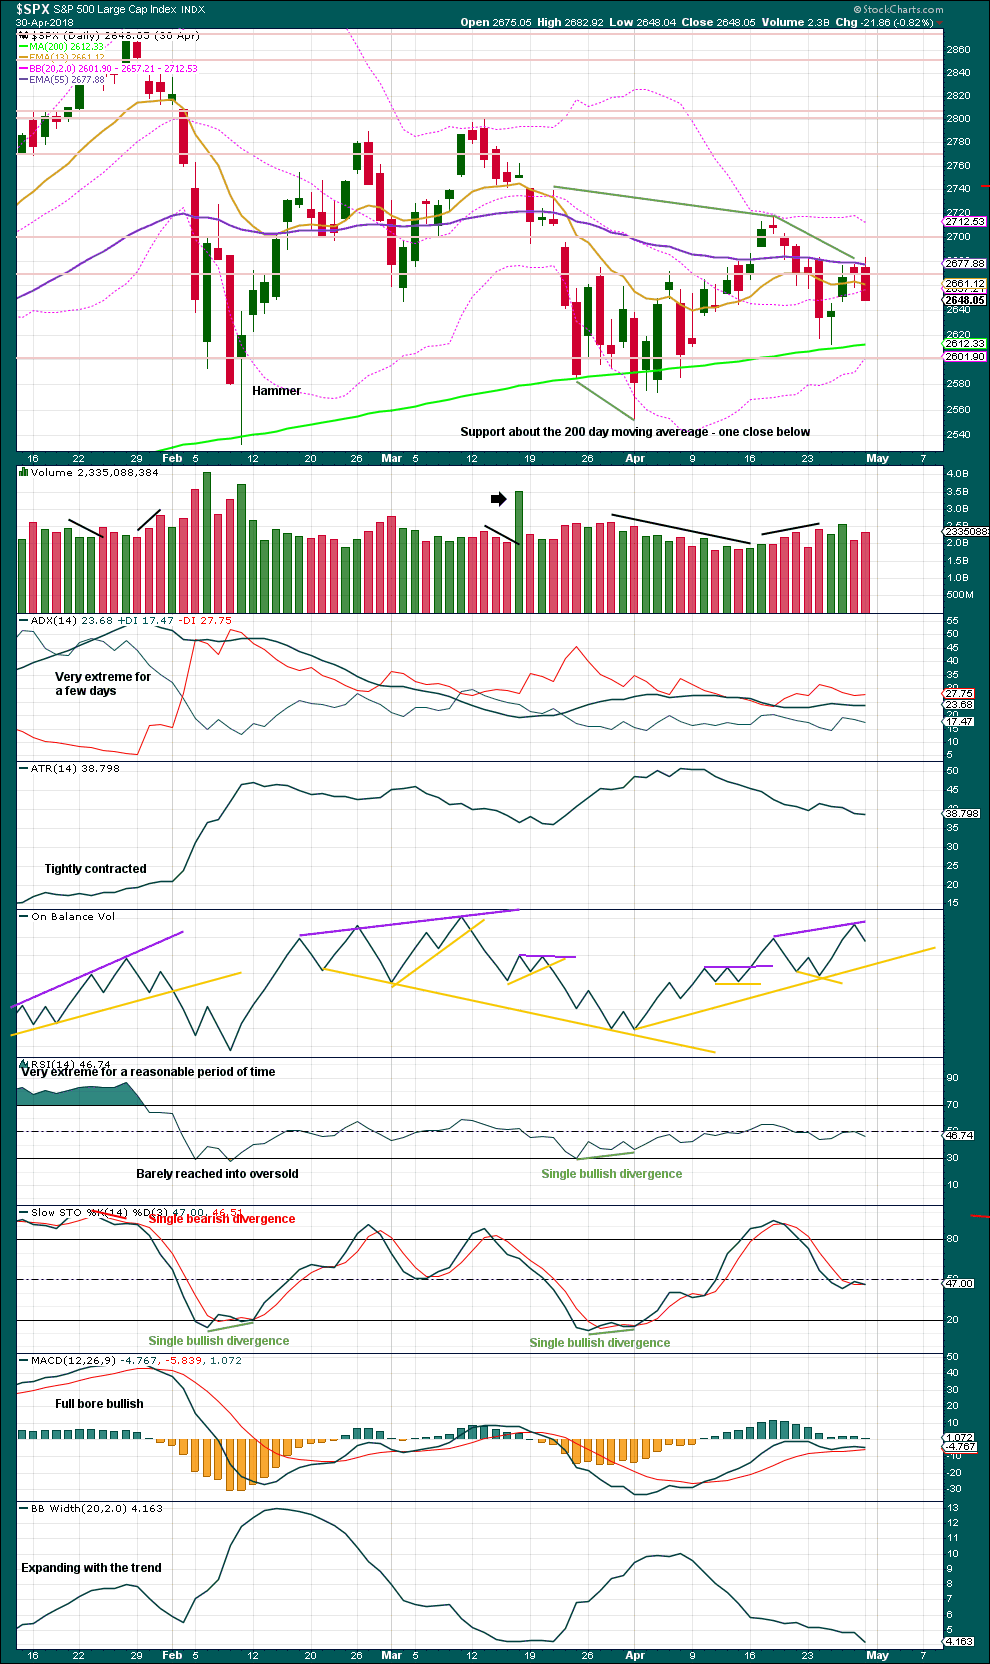
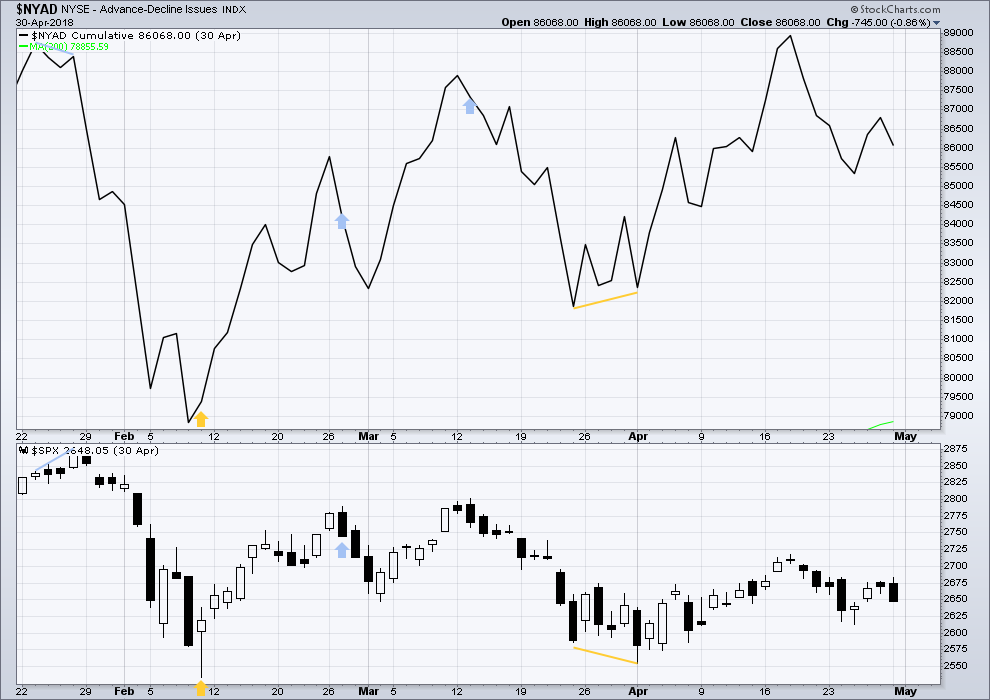
Intermediate wave (4) was a large symmetrical triangle. The deepest wave was the first wave. At its low there was a clear candlestick reversal pattern and bullish divergence between price and Stochastics.
RSI barely managed to reach into oversold.
The current correction for primary wave 4 may behave differently, but there should be some similarities.
It is expected that primary wave 4 may be stronger than intermediate wave (4).
VIX
Click chart to enlarge. Chart courtesy of StockCharts.com.
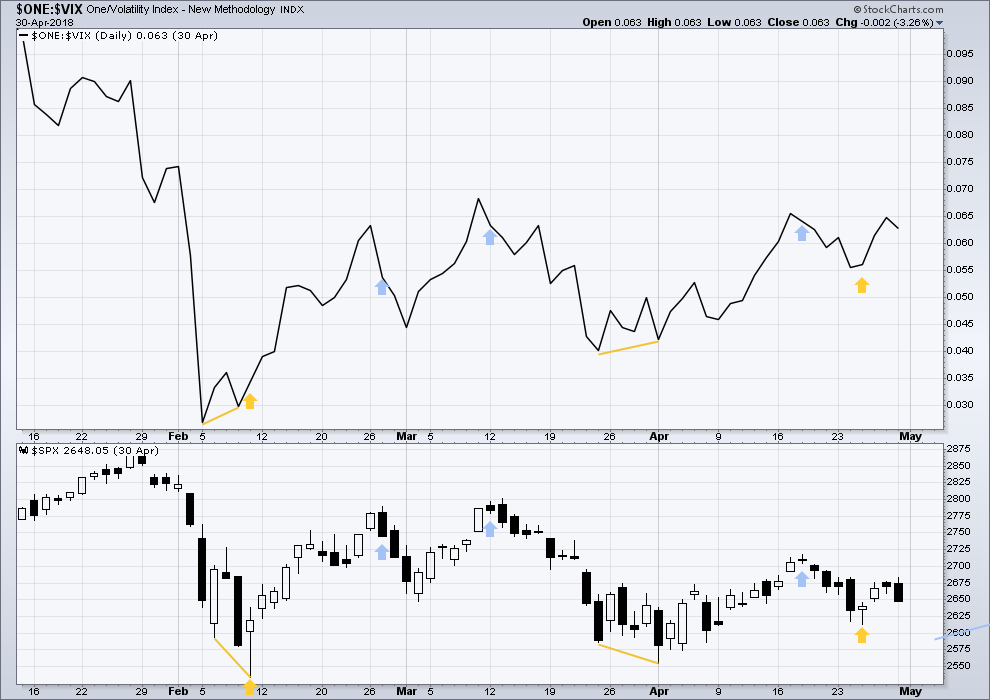
This is a daily chart.
At the two major lows within intermediate wave (4), inverted VIX exhibited single short term bullish divergence.
At highs within intermediate wave (4), inverted VIX exhibited one single day bullish divergence with price.
AD LINE
Click chart to enlarge. Chart courtesy of StockCharts.com.
This is a daily chart.
At the two major lows within intermediate wave (4), there was bullish divergence between price and the AD line. At the two major highs within intermediate wave (4), there was each one instance of single day bearish divergence.
Published @ 08:29 p.m. EST.
—
Careful risk management protects your trading account(s).
Follow my two Golden Rules:
1. Always trade with stops.
2. Risk only 1-5% of equity on any one trade.

Panic on the interwebs! I don’t know if you guys follow Twitter or Fintwit or any any of that nonsense but it’s quite the show today, LOL
Looks like we should have all sheltered not in gold (down half a handle), but in the safe-haven that is TSLA
Hahaha, lol
ROTFLMAO one more time.
I have a Tesla short position….I KNOW!!!! LOL!!! However, my spread very small is at a target price way below market but with a good 4x payoff if I hit, and out in March. So it is a pure “hold and see” bet. Anytime is okay…before March.
My levels below the market. Price now in the middle of my original “1st target” for the A/W down to end…but the second target below now looks very much in play!
Did some trading newbie suggest this would be a boring inside day? Oops!!!! LOL!!!!!!!!!!!!
Well this is unexpected.
At today’s low there will probably be double bullish divergence between price and RSI / Stochastics. If there is, then I would still be expecting intermediate (B) to begin.
If the last small bounce yesterday was a fourth wave, then the alternate which sees intermediate (A) as a five fits best by a long margin. Now minor 5 is completing as an impulse.
No end of wave capitulation from VIX….!
Do we see 60 tomorrow?
Very possible!
When I look at a chart of VIX (as opposed to inverted VIX) the high today is lower than the prior swing high of the 11th of October. That’s some good divergence, bullish for the S&P.
2680 is a major 1.272% extension that has potential as a turn spot.
And I note: Rodney’s early morning call was spot on. W/A down not complete yet! Furthermore, the eventual bottom could be very close…or a long, long way down from here. And all the banksters and all the kings men may not be able to stop the sell off again…
Interesting to see if we get the buyers comming back in to protect the low
If by buyers, you mean banksters, well then yes of course.
They’re holding it up due to massive SPX gamma exposure through Oct 26 expiry…plus margin call waterfall. If you’re not aware of that, probably ought not to be gambling….
It appears the banksters didn’t do what you were suggesting
They absolutely did, what market are you looking at!!! Getting run over just means they weren’t successful.
If the banksters were buying the dip, who exactly was selling?
Got THAT right!! 🙂
I see a possible double bottom here, which would be a least short term bullish. Whether it will be enough to truly launch a B wave up, I don’t know.
Yup, double bottom off the major 61.8% at 2690 that held it yesterday. High potential to be good for at least a while.
Yeah Kevin. They’re gonna defend the hell out of that at least through Friday, but don’t put it past sellers to overcome the central banks eventually.
Everyone runs out of bullets eventually. Then it gets down to the knife work…
Could be a nested start to a 3rd wave down.
Chris…did you see that???!
The bears literally took what the banksters tried to turn into a bullish engulfing candle and used it open up a severe Can-O-Whup-A$$.
We are dying laughing over here!!! 🙂
Duh!!!! We were on that trade too! Boom! t minus 30 points to Margin Calls, man it’s gonna be beautiful!
Ai! YiYi! Multiple five figure round-trips today!
Nice!!
🙂 🙂 🙂
We like, BIG LOTS, and that ain’t no lie!
You other brothers can’t de-ny!…
Sir Verne Mix-A-Lot… 🙂
Yes, I agree Kevin – I think this is a C and could go down quite a way.
Yesterday sure looked like a 5 wave push up. Today, we’ve got what appears to be an A down, and now a B up. If anyone has different takes I’d like to hear them. Implication…don’t expect much more up before we get a C down to complete some kind of ABC or other corrective structure here. Of course I could becompletely wrong, corrections within corrections within corrections, yuck!
Yea, it’s definitely unclear ATM.
Let’s get the big final washout already!
This is getting frustrating!
Now that’s more like it… the next few days should be interesting!
lol, poor Powell…..FED save in 3,2,1
ROTFLMAO!!!
🙂
Looks like a small range inside day is developing. Of course things can change.
If anyone is looking for a day trade, NFLX is pulling back towards the 61.8% (324.3) of yesterday’s up move off the opening lows. That has high potential as a turn point IMO. But wait for it…
Talk about a lack of range or direction
Watch for a possible turn at 2722.9 (50%), or more likely 2715.5, the 61.8%, or if that is blown then 2705 the 78.6%. Then buy triggers (5 min trend line break, polarity inversion, etc). If you are into B wave trading, or just short term intra-day trading.
The 324.3 level in NFLX was tagged perfectly and price has given early indications of a turn. I’m in, but with twitchy fingers, I don’t want to ride NFLX down to 300!!!! Lol!
Long at the 78.6! Let’s rock!
Indeed! Might want to “risk off” with a portion of the position pretty quick. I only expect “inside” up and down today myself, so I’m about as short term as one can get here on the long side.
For now.
My comment about NFLX going to 300 (I thought I was joking) is very much in play! NFLX now down 6.3% on the DAY! Equal weighted FAANGM ticker is down 3.1% on the DAY. Wow. If we presume that there is extreme amounts of institutional money in the FAANGM group, and that there is relatively low levels of retail involvement in the market at this juncture…then the big boy$ are distributing big time. Late comers may join in soon (today, tomorrow, Friday), and we could indeed get the washout end of the intermediate W or A down.
Now a double bottom on on the 78.6% at 2705. Could be the turn point today. How about some buy triggers…
Well, wasn’t it The Monkeys who sang, “I’m A Believer”. This market has a habit of making monkeys out of men and women. I am not a believer the low is in of this current leg down. I am looking for one more new low to complete Intermediate A of Primary 4. Even though B waves are notoriously difficult to trade, if we get a new low with positive divergence on NYMO with SPX below its lower BB, I would accept the risk. At that point it would be a set up for a good long position, IMHO. Looking for 2680-2660.
If we go straight up from here, then I will have missed it with no regrets.
Have a great day. I am traveling today away from computer.
I don’t think regrets about not taking a B wave up long are ever proper! It’s a dangerous and often very ugly (whipsaws!) wave.
I’m curious what technicals are informing you that the A down might not be over? I also have that suspicion…but of course I’ve learned that Lara’s call is far more likely than my suspicion!
“I thought the market was more or less a give and take
It seems the more I gave, the less I got!
The market was out to get me!
That’s the way it seemed!
Disappointment heartbreak of all my dreams…
Then I saw Elliott Wave!
Now I’m a Believer!
Not a trace…of doubt in my mind!
I’m with Lara OOOOOH!!!!
I’m a believer, I couldn’t leave her if I tried.”
Lol!!!
Dang you, Kevin! Now I’ve got that silly tune stuck in my head… probably all day!!!
Please, blame where blame is due…RODNEY!!!
Indeed, you are right. And it’s still stuck there in my head!!!
Turns out I was wrong today. Now price is at new lows, and falling. 🙁
It’s interesting how many deeply brutalized stocks are out there that have just been destroyed since spring or summer ’18. DWDP 77->54, BLUE 233->118, EA 150->99, FSLR 80->44, HAL 55->35. I could keep going and keep going. Many of them are sitting on key 62 and 78% fibo’s and look juicy…but…nyet.
Hi Lara,
Thanks for your hard work. I have a question regarding the following statement in your summary:
“Primary wave 4 should be expected to exhibit reasonable strength. This is the last multi week to multi month consolidation in this ageing bull market, and it may now begin to take on some characteristics of the bear market waiting in the wings.”
Would it be reasonable to assume the alternate count to the low 2600s would have a higher chance of occurring given the summary statement above? In other words, if this last consolidation will take on the characteristics of the bear market waiting in the wings, then it would seem that the alternate would be more like a bear market than the main wave count. Reply at your convenience. Thanks.
Possibly. But I expect that support at the teal trend channel may be stronger.
That trend line has only been overshot during cycle wave IV, and it has not been breached at all ever. It holds the entire bull market since March 2009. It has very strong technical significance.
That’s pretty much the reason I expect primary wave 4 to not move too low. Support there is about 2,615 at this time.
My view. Note that until that trend line is broken…I’m not yet a wave B “believer”. I suspect it will be. But the proof is in the price action.
The 5 minute view looking at the fibo’s under the market.
And the same 5 minute view a few hours later. Did I ever mention how powerful the 78.6% derived fibo retrace level is? Yea, I might have.
Am feeling happier now!
Tree Shaken as Verne would say overnight and lets see a string wave up!!
Happy trading all!!
Trust me to buy too early!
Bad idea…very bad…. 🙁
Maybe he forgot the “not” to buy?
Yet another remarkable bankster gaming of futures. Cleared the deck yesterday, ready to reload shorts and VIX. I’ve mentioned this before, this market is very very dangerous, and the bankster ramp yesterday only very narrowly avoided a historic margin call event that would have waterfalled to limit down. In my humble opinion, as a PM of well over 10 figures, rallies should be used to unweight longs, add to shorts or go to cash. While there might a tradeable low near term, no point in setting your self up to get hammered. Mind your stops….
You mean it’s a fake bounce Verne
Sorry I meant Chris
Whoops, forgot my (NOT TRADING ADVICE) disclaimer my compliance department mandates whenever I post even a hint of a recommendation….
I agree with Chris that this is a very dangerous market and we “know” more down is coming. It may be after a B wave here. Yet it could be starting up later today. B’s are intrinsically difficult and risky IMO!!
Another quick hint people. When looking at VIX for clues, you have to distinguish between price, and price action, price suppression, and true capitulation. The upside gap that remained open yesterday was important, as well as the flagging action the last several trading sessions. Back next week! 🙂
Foist!
🙂