Upwards movement continues as expected from the main Elliott wave count. This wave count has support from classic technical analysis, particularly signals from the AD line and On Balance Volume.
Summary: Yesterday’s low may be the end of a multi week consolidation. A new bull run may begin here to a target at 2,940. However, the risk still remains that a low is not yet in place. If price does move a little lower, then risk is at 2,553.80.
Look for a breach of the Elliott channel on the hourly chart by upwards movement for confidence in a low. Thereafter, a new high above 2,683.55 would add confidence that a low is in place. At that point, the invalidation point may be pulled up to 2,617.32.
Always practice good risk management. Always trade with stops and invest only 1-5% of equity on any one trade.
New updates to this analysis are in bold.
The biggest picture, Grand Super Cycle analysis, is here.
Last historic analysis with monthly charts is here. Video is here.
An alternate idea at the monthly chart level is given here at the end of this analysis.
An historic example of a cycle degree fifth wave is given at the end of the analysis here.
MAIN ELLIOTT WAVE COUNT
WEEKLY CHART
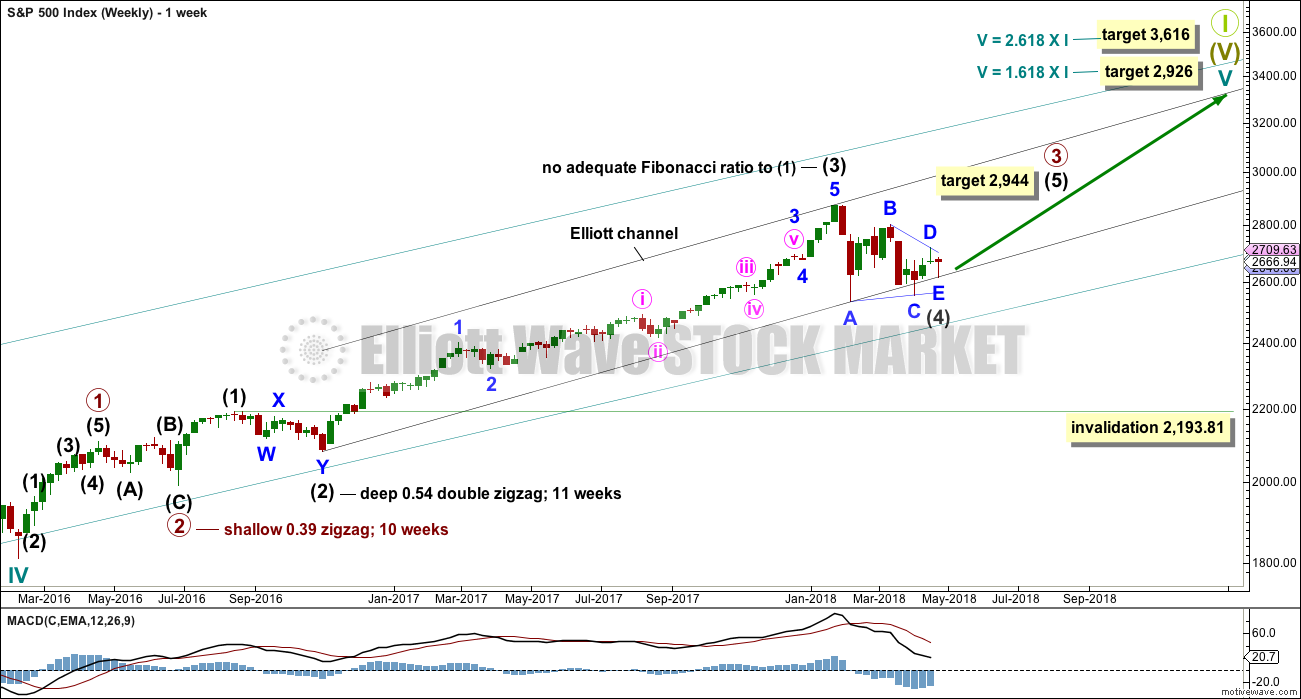
Cycle wave V must complete as a five structure, which should look clear at the weekly chart level. It may only be an impulse or ending diagonal. At this stage, it is clear it is an impulse.
Within cycle wave V, the third waves at all degrees may only subdivide as impulses.
Intermediate wave (4) has breached an Elliott channel drawn using Elliott’s first technique. The channel is redrawn today using Elliott’s second technique: the first trend line from the ends of intermediate waves (2) to (4) at today’s low, then a parallel copy on the end of intermediate wave (3). Intermediate wave (5) may end either midway within the channel, or about the upper edge.
At least three wave counts remain valid at the daily chart level. It is possible still that a low may not be in place; intermediate wave (4) could still continue further. Intermediate wave (4) may not move into intermediate wave (1) price territory below 2,193.81. However, it would be extremely likely to remain within the wider teal channel (copied over from the monthly chart) if it were to be reasonably deep. This channel contains the entire bull market since the low in March 2009, with only two small overshoots at the end of cycle wave IV. If this channel is breached, then the idea of cycle wave V continuing higher would be discarded well before the invalidation point is breached.
If intermediate wave (4) ends anytime within this week, then it would total a Fibonacci 13 weeks. It would have excellent proportion with intermediate wave (2), and there would be perfect alternation if it is over as a shallow triangle.
At this stage, there are still three possible structures for intermediate wave (4): a triangle, a combination, and a flat correction. All three will be published. The triangle is preferred because that would see price continue to find support about the 200 day moving average. While this average continues to provide support, it is reasonable to expect it to continue (until it is clearly breached).
DAILY CHART
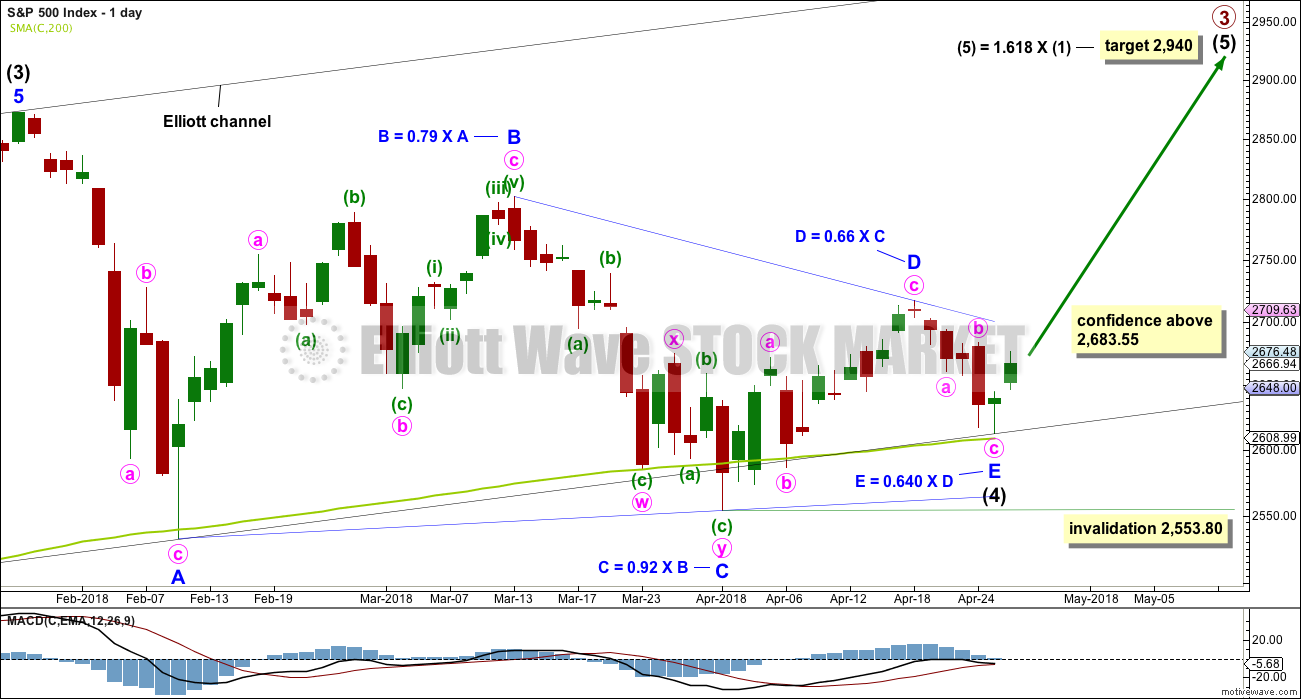
It is possible that intermediate wave (4) is a complete regular contracting triangle, the most common type of triangle. Minor wave E may have ended at yesterday’s low, finding support just above the 200 day moving average and ending reasonably short of the A-C trend line. This is the most common look for E waves of triangles.
Intermediate wave (3) exhibits no Fibonacci ratio to intermediate wave (1). It is more likely then that intermediate wave (5) may exhibit a Fibonacci ratio to either of intermediate waves (1) or (3). The most common Fibonacci ratio would be equality in length with intermediate wave (1), but in this instance that would expect a truncation. The next common Fibonacci ratio is used to calculate a target for intermediate wave (5) to end.
It must still be accepted that the risk with this wave count is that a low may not yet be in place; intermediate wave (4) could continue lower. For this triangle wave count, minor wave E may not move beyond the end of minor wave C below 2,553.80.
HOURLY CHART
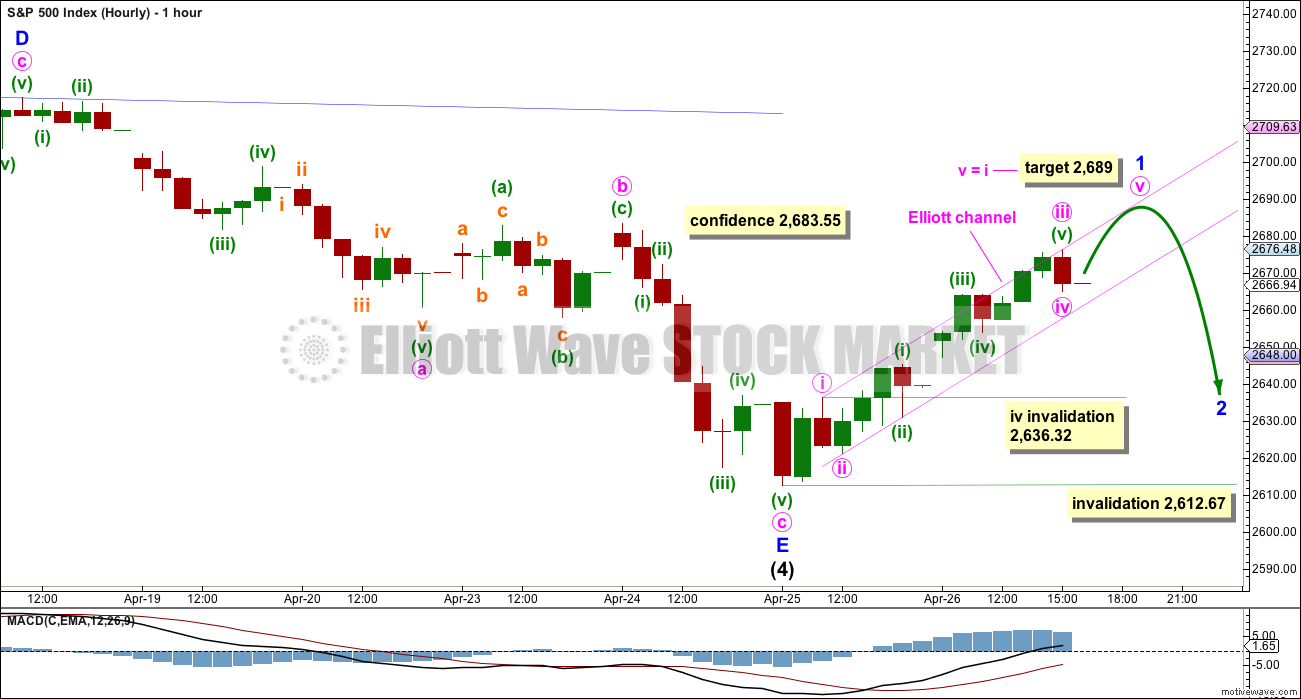
Minor wave E subdivides as a complete zigzag.
A new high above 2,683.55 would add further confidence that a low may be in place. This point is the start of minute wave c within minor wave E. A new high above the start of minute wave c could not be a second wave correction within minute wave c, so at that stage minute wave c would have to be over.
Intermediate wave (5) must subdivide as a five wave structure. At the hourly chart level, the structure should begin to unfold with a five up. So far this is labelled minor wave 1, which is incomplete.
Within minor wave 1, minute waves i through to iv may be complete. A small Elliott channel is drawn about this upwards impulse using Elliott’s first technique. If minute wave iv moves lower tomorrow, then it may find support about the lower edge of this channel. A target is calculated for minute wave v to end; if minute wave v moves lower, then this target must also move correspondingly lower.
Minute wave iv may not move into minute wave i price territory below 2,636.32.
While price remains within the Elliott channel, assume that minor wave 1 is incomplete and expect more upwards movement. If price breaks below the lower edge of the channel with clearly downwards movement (not sideways), then assume that minor wave 1 is over and minor wave 2 has arrived. At that stage, draw a Fibonacci retracement along the length of minor wave 1 and use the 0.382 and 0.618 Fibonacci ratios as targets for minor wave 2.
Looking back at some second wave corrections on the S&P from the start of cycle wave V on the 11th February, 2016 (the low on the weekly chart), they are at depths of 0.41, 0.40, 0.30, 0.54, 0.25, 0.88 and 0.44. Clearly this market has a wide range of depths for its second wave corrections, so neither Fibonacci ratio may be favoured. Minor wave 2 may be very shallow, but it may also be very deep. On balance, it does seem that shallow corrections are more common than deep corrections in current market conditions.
Minor wave 1 may be over in one more session. Minor wave 2 may unfold over about one or two sessions. Minor wave 2 may not move beyond the start of minor wave 1 below 2,612.67.
ALTERNATE WAVE COUNTS
DAILY CHART – COMBINATION
I have charted a triangle a great many times over the years, sometimes even to completion, only to see the structure subsequently invalidated by price. When that has happened, the correction has turned out to be something else, usually a combination. Therefore, it is important to always consider an alternate when a triangle may be unfolding or complete.
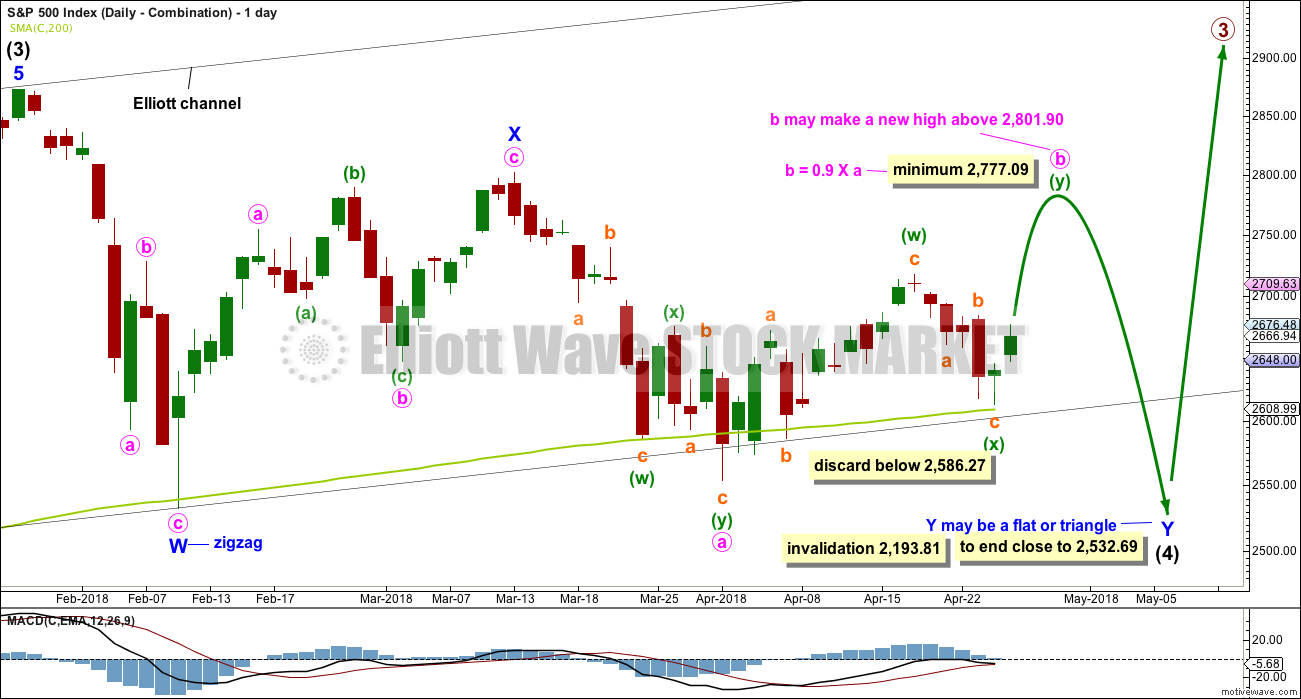
Double combinations are very common structures. The first structure in a possible double combination for intermediate wave (4) would be a complete zigzag labelled minor wave W. The double should be joined by a three in the opposite direction labelled minor wave X, which may be a complete zigzag. X waves within combinations are typically very deep; if minor wave X is over at the last high, then it would be a 0.79 length of minor wave W, which is fairly deep giving it a normal look. There is no minimum nor maximum requirement for X waves within combinations.
The second structure in the double would most likely be a flat correction labelled minor wave Y. It may also be a triangle, but in my experience this is very rare, so it will not be expected. The much more common flat for minor wave Y will be charted and expected.
A flat correction would subdivide 3-3-5. Minute wave a must be a three wave structure, most likely a zigzag. It may also be a double zigzag.
Minute wave b must now reach a minimum 0.90 length of minute wave a. Minute wave b may be unfolding as a double zigzag. Within a double zigzag, the second zigzag exists to deepen the correction when the first zigzag did not move price deep enough. Double zigzags normally have a strong slope like single zigzags. To achieve a strong slope the X wave within a double zigzag is normally brief and shallow, most importantly shallow (it rarely moves beyond the start of the first zigzag). A new low now below 2,586.27 should see the idea of a double zigzag for minute wave b discarded.
The purpose of combinations is to take up time and move price sideways. To achieve this purpose the second structure in the double usually ends close to the same level as the first. Minor wave Y would be expected to end about the same level as minor wave W at 2,532.69. This would require a strong overshoot or breach of the 200 day moving average, which looks unlikely but does have precedent in this bull market.
Minute wave b may make a new high above the start of minute wave a if minor wave Y is an expanded flat. There is no maximum length for minute wave b, but there is a convention within Elliott wave that states when minute wave b is longer than twice the length of minute wave a the idea of a flat correction continuing should be discarded based upon a very low probability. That price point would be at 3,050. However, if price makes a new all time high and upwards movement exhibits strength, then this idea would be discarded at that point. Minute wave b should exhibit obvious internal weakness, not strength.
At this stage, the very bullish signal this week from the AD line making a new all time high puts substantial doubt on this wave count. It has very little support from classic technical analysis.
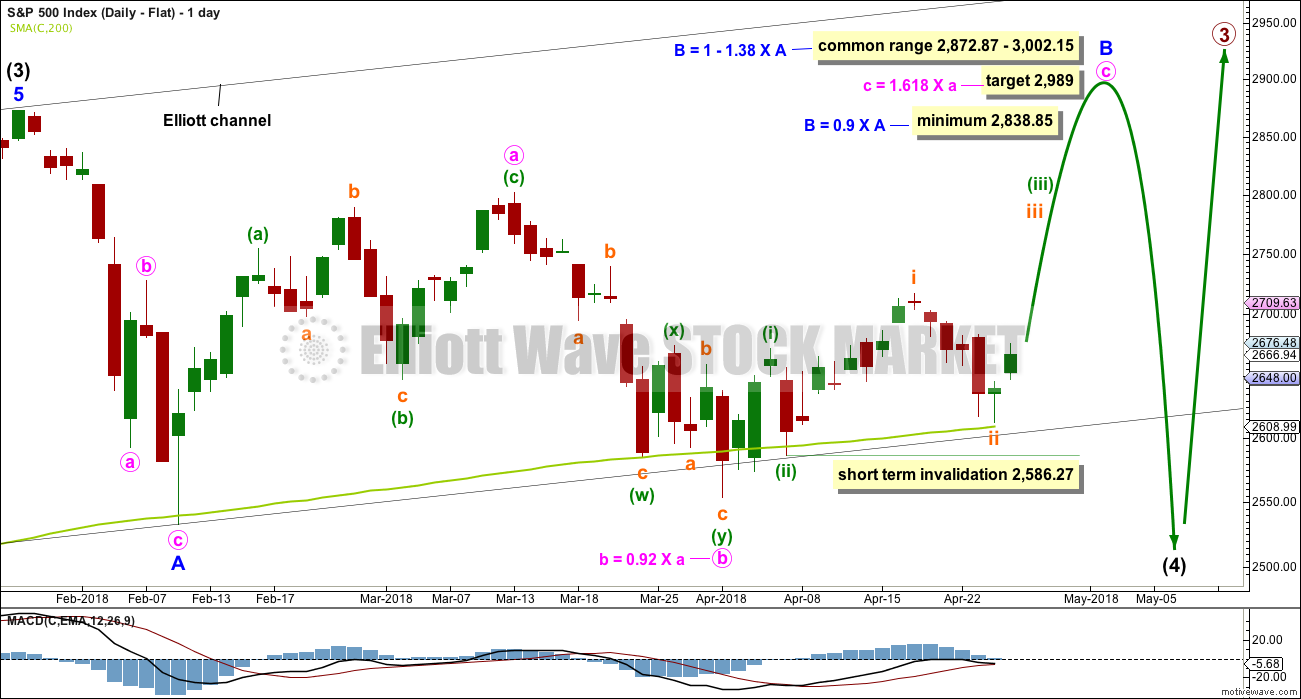
DAILY CHART – FLAT
Flat corrections are very common. The most common type of flat is an expanded flat. This would see minor wave B move above the start of minor wave A at 2,872.87.
Within a flat correction, minor wave B must retrace a minimum 0.9 length of minor wave A at 2,838.85. The most common length for minor wave B within a flat correction would be 1 to 1.38 times the length of minor wave A at 2,872.87 to 3,002.15. An expanded flat would see minor wave B 1.05 times the length of minor wave A or longer, at 2,889.89 or above. A target is calculated for minor wave B to end, which would see it end within the common range.
Minor wave B may be a regular flat correction, and within it minute wave a may have been a single zigzag and minute wave b may have been a double zigzag. This has a very good fit.
However, minute wave c must be a five wave structure for this wave count and now the depth and duration of subminuette wave ii looks wrong. The probability that minute wave c upwards is unfolding as an impulse is now reduced. It is possible that it could be a diagonal, but that too has a relatively low probability as the diagonal would need to be expanding to achieve the minimum price target for minor wave B, and expanding ending diagonals are not very common.
At its end minor wave B should exhibit obvious weakness. If price makes a new all time high and exhibits strength, then this wave count should be discarded.
This wave count would require a very substantial breach of the 200 day moving average for the end of intermediate wave (4). This is possible but may be less likely than a smaller breach.
TECHNICAL ANALYSIS
WEEKLY CHART
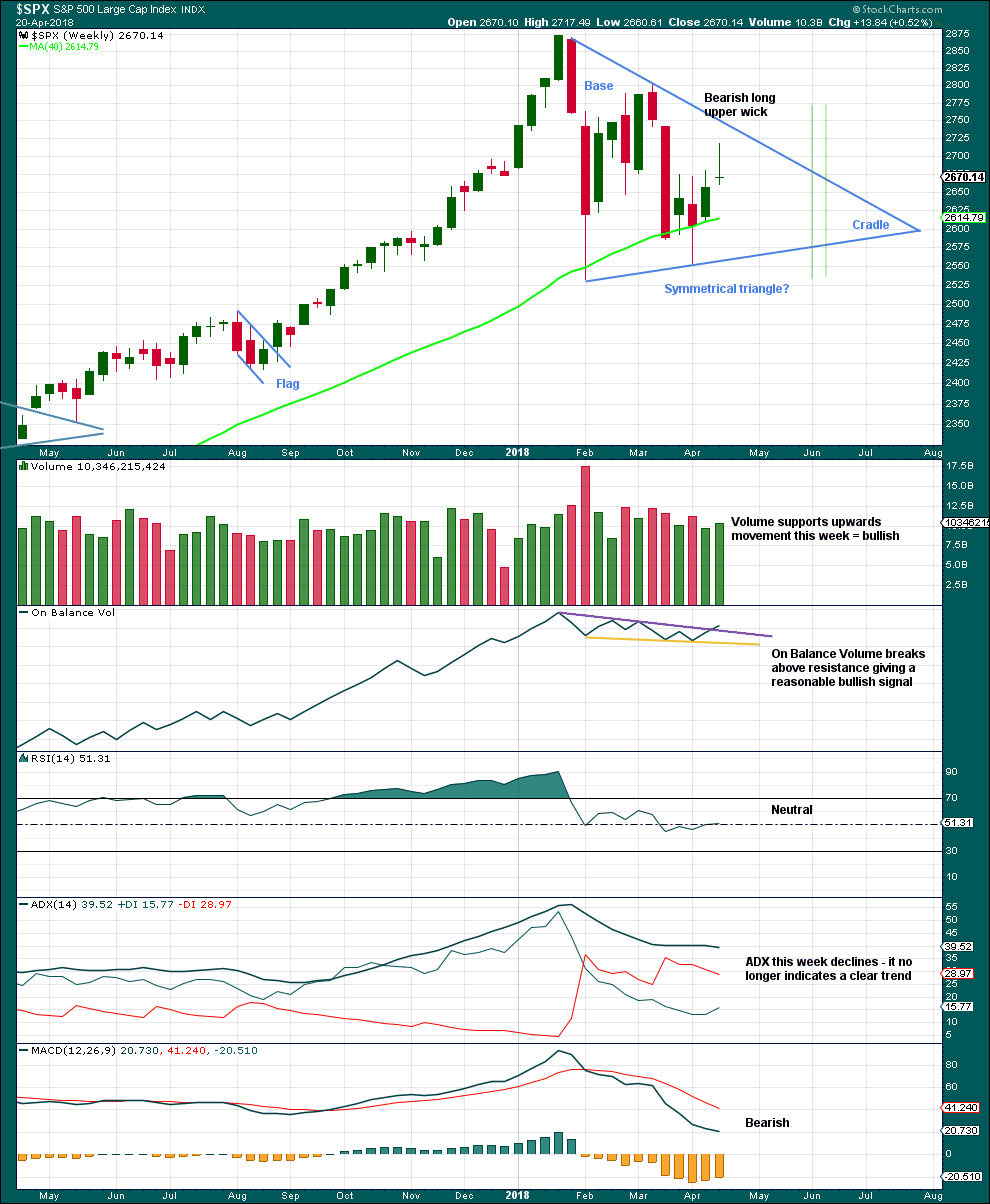
Click chart to enlarge. Chart courtesy of StockCharts.com.
A classic symmetrical triangle pattern may be forming. These are different to Elliott wave triangles. Symmetrical triangles may be either continuation or reversal patterns, while Elliott wave triangles are always continuation patterns and have stricter rules.
The vertical green lines are 73% to 75% of the length of the triangle from cradle to base, where a breakout most commonly occurs.
From Dhalquist and Kirkpatrick on trading triangles:
“The ideal situation for trading triangles is a definite breakout, a high trading range within the triangle, an upward-sloping volume trend during the formation of the triangle, and especially a gap on the breakout.”
For this example, the breakout has not yet happened. There is a high trading range within the triangle, but volume is declining.
The triangle may yet have another 7 – 8 weeks if it breaks out at the green lines.
On Balance Volume gives a reasonable bullish signal last week with a breakout from a small range, above resistance. The signal is neither strong nor weak. The trend line broken has a shallow slope, is somewhat long held, and has been tested three or four times before.
A bullish signal from On Balance Volume and support last week for upwards movement offer good support to the main Elliott wave count. The bearish long upper wick though suggests a pullback for the short term, which is also what the main Elliott wave count expects.
DAILY CHART
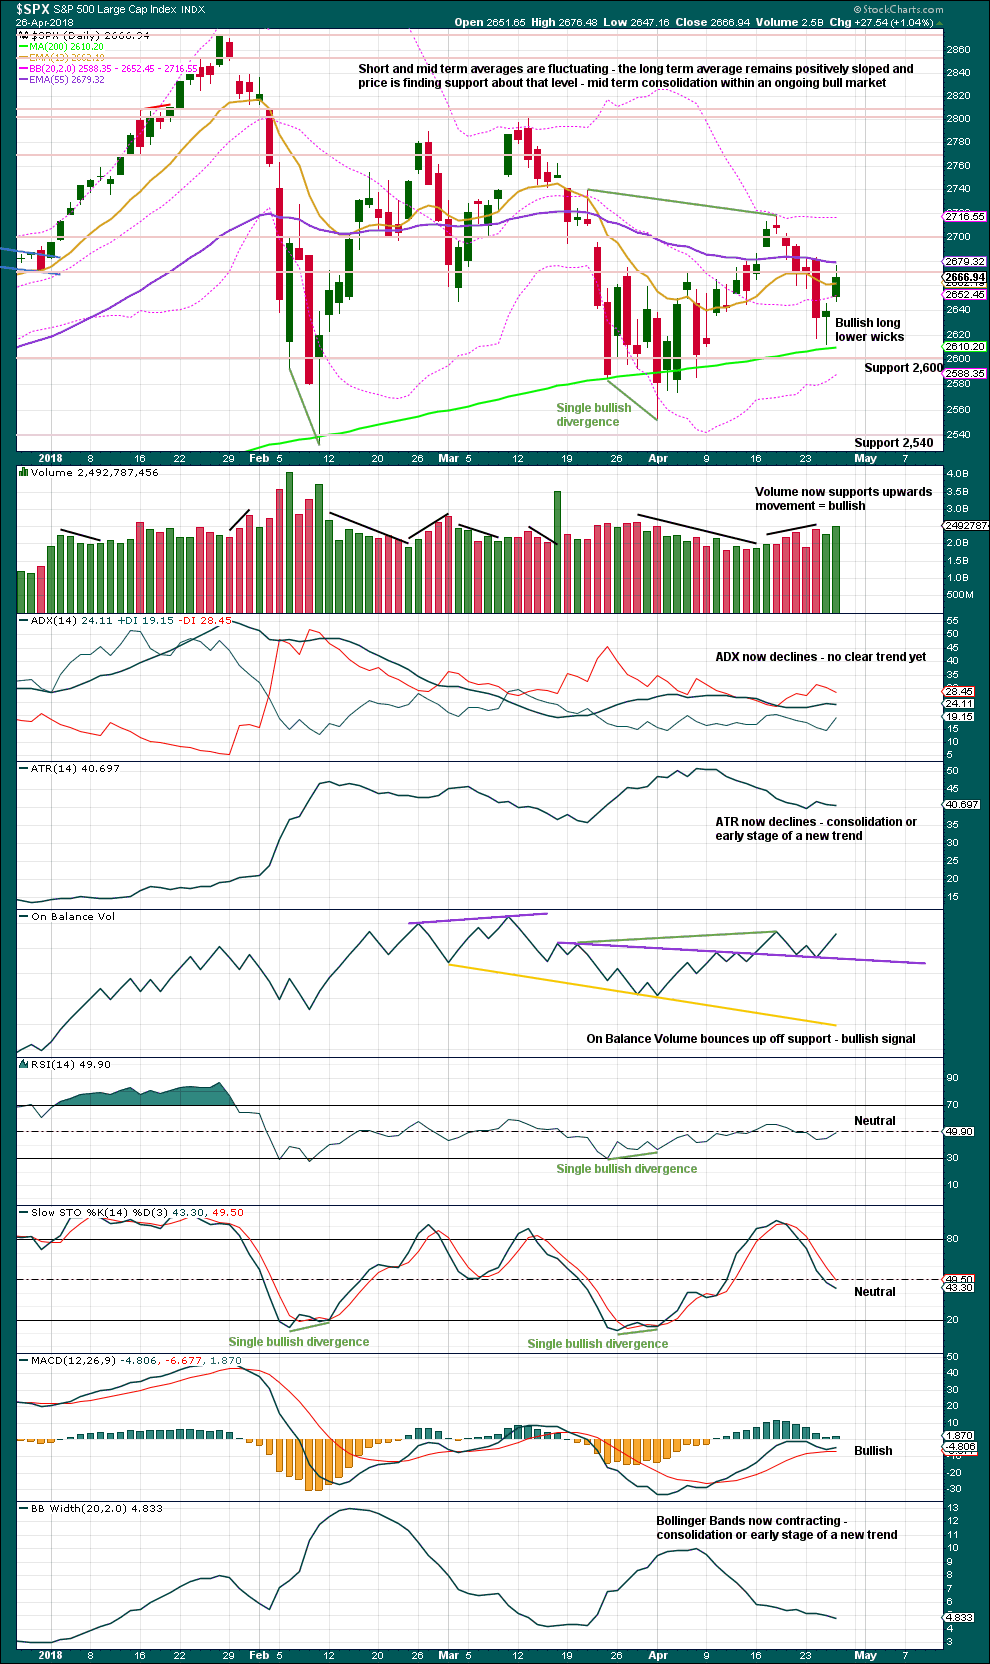
Click chart to enlarge. Chart courtesy of StockCharts.com.
Volume and On Balance Volume support the main Elliott wave count.
VOLATILITY – INVERTED VIX CHART
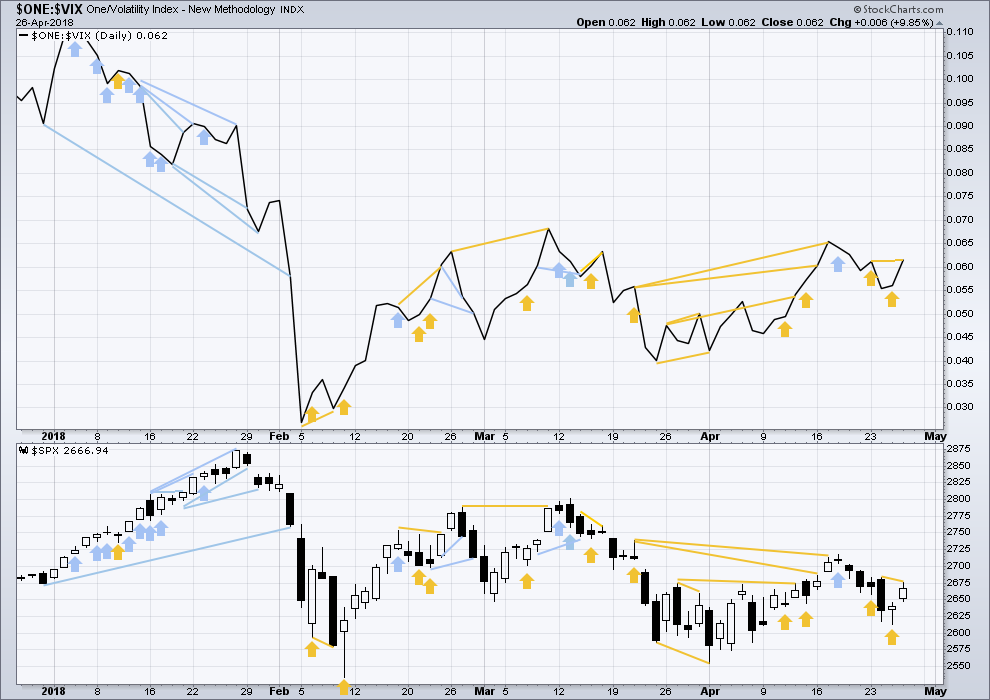
Click chart to enlarge. Chart courtesy of StockCharts.com.
So that colour blind members are included, bearish signals will be noted with blue and bullish signals with yellow.
Normally, volatility should decline as price moves higher and increase as price moves lower. This means that normally inverted VIX should move in the same direction as price.
Inverted VIX has made a small new swing high above the prior high of the 23rd of April, but price has not. If VIX is a leading indicator, then this divergence is bullish.
BREADTH – AD LINE
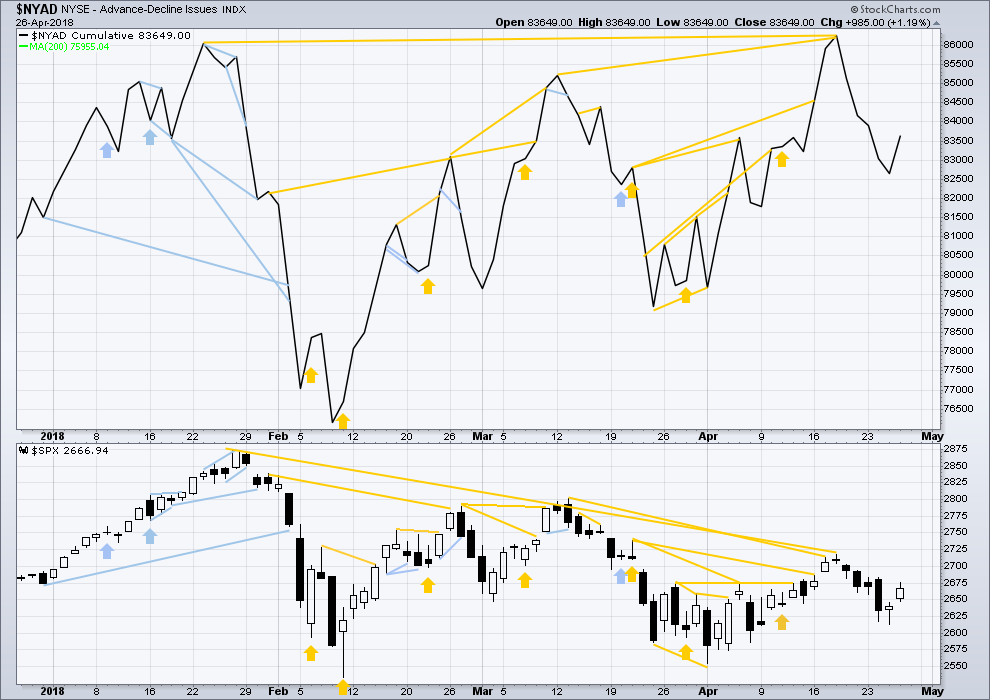
Click chart to enlarge. Chart courtesy of StockCharts.com.
There is normally 4-6 months divergence between price and market breadth prior to a full fledged bear market. This has been so for all major bear markets within the last 90 odd years. With no longer term divergence yet at this point, any decline in price should be expected to be a pullback within an ongoing bull market and not necessarily the start of a bear market. A new all time high from the AD line this week means that any bear market may now be an absolute minimum of 4 months away.
All of small, mid and large caps have made at least slight new lows below their prior swing lows of the 13th of April. This pullback has support from falling market breadth.
Breadth should be read as a leading indicator.
The new all time high from the AD line remains very strongly bullish and supports the main Elliott wave count.This new all time high from the AD line will be given much weight in this analysis. This is the piece of technical evidence on which I am today relying most heavily in expecting a low may be in place here or very soon.
There has been a cluster of bullish signals from the AD line in the last few weeks. This also overall offers good support to the main Elliott wave count.
Both price and the AD line have moved higher. The rise in price has support from rising market breadth. There is no divergence.
DOW THEORY
The following lows need to be exceeded for Dow Theory to confirm the end of the bull market and a change to a bear market:
DJIA: 23,360.29.
DJT: 9,806.79.
S&P500: 2,532.69.
Nasdaq: 6,630.67.
At this stage, only DJIA has made a new major swing low. DJT also needs to make a new major swing low for Dow Theory to indicate a switch from a bull market to a bear market. For an extended Dow Theory, which includes the S&P500 and Nasdaq, these two markets also need to make new major swing lows.
Charts showing each prior major swing low used for Dow Theory may be seen at the end of this analysis here.
Published @ 08:42 p.m. EST.

Updated hourly chart:
the channel as drawn yesterday was breached, but price turned and is moving slowly up. so the channel is redrawn using Elliott’s second technique which now contains all this movement so far
the target is recalculated. still waiting for minor 1 to complete, and then would expect a correction for minor 2.
Any significant suspicion the minor 1 is already over?
there is reasonable suspicion, yes.
especially with this last hourly candlestick now mostly outside the new channel
but then… this market does like to breach channels and then continue in its old direction. one of its less desirable qualities.
Worth noting: I have both SPX and NDX on a weekly timeframe buy (stochRSI x-over), and a daily timeframe buy (same trigger). SPX isn’t actually there yet at the daily level…but once today is complete, assuming no sudden plunge, it will be. The hourly timeframds are both still in a sell. When the hourlies goes long…so do I in a larger way.
Selling FB May 18 180/185 bear call credit spread for 0.99 per spread. Risk is 500 per spread if Fb trading above 185 on May 18. ROI is about 20% for three weeks if under 180.00
I’m outta here. Boring banksters!
Have a wonderful and relaxing week-end everyone! 🙂
Hmmm….if you know what they are going to do, and they are the big money…isn’t that a massive edge?
Looks like they plan to maintain the suspense to the very final tick…haha! 🙂
O.K., Mr. Market chimed in before folk could respond with a fill of that phony gap…sorry! 🙂
Here is little quiz on market psychology.
Based on the price action we have seen today, what are you expecting to happen into the close? 🙂
looks like a sell off is coming soon….
Selling June 15 10/11 bull put credit spread. Nice plungerooni in NQ.
I got 0.21 per contract. I would be happy to pay 10.79 for QID calls come June if price below 11.00 wink! wink! 😀
Oops! I meant QID SHARES (but you knew that!) 🙂
They are dumping cash to keep the intra-day gaps open..hehe! They are SO silly! 🙂
Heavy shorting of volatility…..hmmnnnn…!!
Okay, last one and I’ll stop showing these…I’ll just say, “I like this set up a lot”. I call it the “squeeze, approach, and go”. First you get a squeeze (or half squeeze as the case may be), price gets close or touches (through is okay too) the bollinger, then price turns and shows at least one solid bar going the other way. It’s a good entry with a “self defined” close stop. Again, I use 21 period keltners and bollingers, FWIW.
Note the setup “sqeeze, approach” on the upside following in the chart. BUT in this case, there was no go!! No clear turn bar, until much later and from my perspective, that set up is thus dead and other considerations are at work. Waiting for the turn bar is key to raising the probabilities.
“Waiting for the turn bar is key to raising the probabilities.”
thanks Kevin, that’s an excellent point
A move back below 2669.30 could signal a sell-off into the close….
i’ve got a 62% fibo at 2668.66 and a symmetric projection of an earlier move down to exactly that price too. And…and…hitting it….a little green, boom, moving up. We’ll see if it holds…
No it failed and hit and turned off a lower 38% fibo at 2667.8. I don’t think there will be a sell off into the close. The main says price should just about be entering “3 space” (of a v wave up) soon, as I see it. Today so far is bullish since the early morning low, but very choppy: a 1-2 1-2 perhaps?. It certainly hasn’t YET given crystal evidence that price is in a new v up, so I’m being very cautious.
Equity markets will rarely run off in completely different directions. NQ suggesting caution for immediate bullish expectations imho…
Phony gap higher above today’s range by several indices on 5 min chart….
The kind of price action we are seeing in futures is quite suspect. We saw the same lunacy in NQ yesterday so I would not be very surprised to see a similar outcome.
Yesterday was a ramp into the close…opposite today?
….Ooopsie!!! 🙂
Hi everyone
I think that if the SPX closes out this month below 2640.8
That will mark 3 monthly candlesticks down.
Lets see how Monday does for the last day of this month.
This almost feels like were in the year 2000 and the market made its all time high and if thats correct then we will be lucky for the SPX to get to 2830, 6 months after the January high.
If we can go higher then that the 2830 by early june then we will see another ATH of any where of 1 – 5%
which then suggest this is like 1999 followed by 2 more waves up higher that bring 2 – 5% on each on of those.
This monthly close is key and also what happens next month as well.
Please give feedback.
Thank You
2640, “this month”, meaning, the close of Monday? If the move up from April 25 is a completed five wave 1 up and price is now in a 2 down, that’s possible. I view it as unlikely given the action here today, though. And if price today pushes back up above yesterday’s high, I’d say forget about it. I view historical comparison ala what you are doing as indicative of possibilities…but not strong evidence that a similar pattern will in fact play out. The evidence here supports more up into next week, as I see it. However, if price moves back to fresh lows today…then yes, price is probably in a 2 not a v up, and 2640 is a reasonable target.
Hi Kevin
Im also basing my model on the
Wilshire 5000 to GDP on Warren Buffets site
Back in 2000 the number was 148.5% to GDP
January of this year we reached and all time high of 152% to GDP
Just a thought there.
Some possible targets for the top of the v wave: 38% of 1-3 is 2683.5, and 62% is 2698.7. The latter is the most likely as I see it; a 62% fibo is just above at 2704.3. The preponderance of the evidence tells me price will be up in or just above the 2700 zone next week, and then that 2 wave down will be due (or perhaps…the next leg down of the combination??).
It’s not impossible that the pullback we’ve seen so far is not iv, but in fact the 2 after a completed 5 wave up. In which case, Verne will be correct and price will move lower before pushing up above yesterday’s high. Right now, I’d say we’ve got a 1 of the new v complete, and the 2 of that v is in progress now. But ya gotta consider and have a plan for the “alternative” view!!
Big impulse down in ES. Current move up bears (pun intended) close watching. A new low there spells trouble ahead for bulls….
Beautiful trade on NQ!
I saw that RIDICULOUS ramp higher yesterday and thought to myself….”MFM!!!”
(More free money!) 🙂 🙂 🙂
VIX gaps higher are always intetesting. Suggests a few forcible unwinds, like rats leaving a sinking ship….
A number of my bear call credit spreads have moved rapidly in the money allowing me to buy back short calls and retain long calls at less than zero cost basis. This is the basic idea of positional spreads.
So you score zero if the break is down now, and score big if the break is up. I find this a little odd, given that your typical bias is bearish. Here there’s a bearish type move…and you take advantage of it by zeroing out your short side profit potential, in favor of your long profit potential. Don’t get me wrong I LOVE the play, it just seems a little contrary to what you described initially as your plan. Was your intent to execute this maneuver in the opposite direction (close the long side) if the market moved up today? Or are you secretly bullish, and would have STILL closed your short side if the market went up?
I have a long standing habit of always being positioned with Lara’s main count. The reason is very simlple. She has been right far more often than not. 🙂
And you are right about my being bearish. My long calls are now hedging positions. The spread was not intended for profit, but protection…
Many many levels of tactics to implement your strategy, interesting. Thanks.
As a trader, I am completely agnostic. If the market had gone up, I would have also closed the profitable leg of the bull put spread. In fact that I expect will happen at some point, and as you see, I will end up positioned with BOTH calls and puts,
courtesy of Mr. Market. Capisce?? 🙂
The 5 wave up may be complete already; a high above the wave 3 high was achieved. So while this may be an expanding flat kind of 4 here, and the 5 hasn’t launched yet (most likely?)…it could be the case that the 5 up is complete (finishing a 1 up), and now the larger higher level 2 starts up. I’m being a tad cautious, particularly since I scored in the first 10 minutes on various positions and don’t want to bleed aways todays profits, lol!!
The 100% of wave ii at 2661.5 is just below a 62% fibo at 2662.6. My best guess is this will be a stop and turn zone for the ending of the iv. Price on the 5 minute is also running into lower BB and KC channel lines.
Low of 2661.6. Niiice!!! Now GO DOG!!!! Gimme a 1 of a 5 please….a little concerned that this is a 3-3-5 correction, and this 5 wave down isn’t complete, this little push back up being a 4 of that 5 down….
‘Fraid we’re going lower…. 🙂
Pushed a little deeper and bounced cleanly off a 78.6% fibo, and with authority. Not going any lower than that today, unless there some exogeneous event. iv wave over, v has launched. In my opinion.
What if E is not yet done? I am still seeing negative divergences on what is supposed to be an impulse up….
I’ll start seriously entertaining that possibility if and only if price here gets below 2652, which is where this supposed iv reached 1.62 the length of the ii. Not definitive, but strongly indicative to me that “something’s not right with this bullish count”. I don’t think it’s going to happen…but hey, the market speaks! We just anticipate a bit…and react a lot. Now price bounced pretty decently off a 78.6% fibo at 2658.9. We’ll see if this shifts back to some uptrending here on the 5 minute….and yes, thar she blows matey!!!!
We know a big move is coming out of this triangle, but we are not sure what direction. If it is a descending triangle it will break to the downside, if it is a contracting triangle of a fourth wave it will break to the upside. Even if it morphs into something else the coiling motion of the last several months still portends a big directional move. The waves have all been in sub-waves of three so I think the case for the triangle is strong.
You can tie yourself up in knots trying to follow the triangle legs, or you can prepare for the break, whatever direction. I have chosen the latter.
I have opened credit spreads with strikes above and below the A-C and B-D trend-lines as the directional break will be confirmed when price breaches either of them, very likely with a brief back-test. When that happens, I have a very simple adjustment to make, and that is exit one short leg of my credit spreads, depending on what direction Mr Market heads. Now, can anything be simpler?? We are not talking about straddles, strangles, iron condors, butterflies and the like. This is a low risk approach that has worked well for me. Have a great weekend everyone! 🙂
Thx Verne for your idea! One question. How far expiration wise do u go? Also u said closing one short leg, did u mean short leg or short option ? Thx
I like to go out at least 30 days, 45 is even better to give trade a bit of room to breathe. And yes, if price breaks up for example, you buy back the short calls of the bear call spread and you’re set! Most welcome! 🙂
Vern – When you say credit spreads . Would you mean for a long credit spread – buying a call ( say at the market ) then writing ( selling ) a further out call ? limit of loss , and limit of gain ?
Example – SPY
buy the 266 , sell the 269 ?
A short credit spread – buying a put , then writing a out put ?
Do both sides ?
Yes. You limit your risk by the width of the spread. A 269.50/270 SPY call credit spread means you sell the 269.50 call and buy the 270 call and get paid (granted not a lot!) to open the trade. Your risk for the half point spread is 50.00 if spread held through expiration and price is above 270.
When using a spread trade to get positioned for an expected big move, a narrow point spread is the way to go imho, for obvious reasons. You are just trying to get positioned for the move as cheaply as possible, not make a bundle on the spread trade.
You will need a level 3 trading account for these trades.
Thank you , Vern
🙂
Verne thanks for the details on how you “collar” the market with two credit spreads. Sweet! I’m seeing if I can get level 3 rights in my IB IRA right now; don’t know if it’s allowed or not.
We need every possible advantage against “they-who-must-not be-named”! 🙂
that is a really nice explanation Verne. thank you very much for kindly sharing this with the membership!
🙂 🙂
Three charts of interest.
First, a weekly, showing the high-high cycle. Per this cycle, a swing high at the weekly level is due NEXT WEEK.
The daily, showing my expected zone for a likely turn back down, based on the high-high cycle timing combined with the upper bollinger and keltner band positions and the descending upper down channel line (see weekly for the overall down channel view).
Lastly, the hourly with the iv wave low projected at both 1.0 and 1.62 of the ii wave.
The weekly…
The daily…
And the hourly…
Thanks for sharing Kevin. Great work!
To emphasize you’re point on your daily turnaround target, I want to mention the gap down from March 21/22 trading days… 2711.93 tick would close that gap.
And also on the weekly chart, there is a gap down from March 16/19, and to 2752.01 tick would close that gap… maybe that’s where the swing high might end next week that you’re predicting.
Also a word about tomorrow: most of the heavy weight’s earnings after hours today were solid. Intel had great earnings, Microsoft had great guidance, and Amazon just crushed everything imaginable and also raised it’s Prime membership fee…
It might be another gap open and go tomorrow just like today… with high volume given the size of these companies.
When you catch the first wave…
Did you say wave, Doc? 🙂
I did, and by catching the first…I can quickly paddle out and catch the turd!!! Nice little 2nd wave there, wabbit!