Upwards movement was expected for the session. The session began with a sharp fall, which was then followed by a steady rise to close above the open.
Summary: Today’s low may be the end of a multi week consolidation. A new bull run may begin here to a target at 2,944. However, the risk still remains that a low is not yet in place. If price does move a little lower, then risk is at 2,553.80.
Look for a breach of the Elliott channel on the hourly chart by upwards movement for confidence in a low. Thereafter, a new high above 2,683.55 would add confidence that a low is in place. At that point, the invalidation point may be pulled up to 2,617.32.
Always practice good risk management. Always trade with stops and invest only 1-5% of equity on any one trade.
New updates to this analysis are in bold.
The biggest picture, Grand Super Cycle analysis, is here.
Last historic analysis with monthly charts is here. Video is here.
An alternate idea at the monthly chart level is given here at the end of this analysis.
An historic example of a cycle degree fifth wave is given at the end of the analysis here.
MAIN ELLIOTT WAVE COUNT
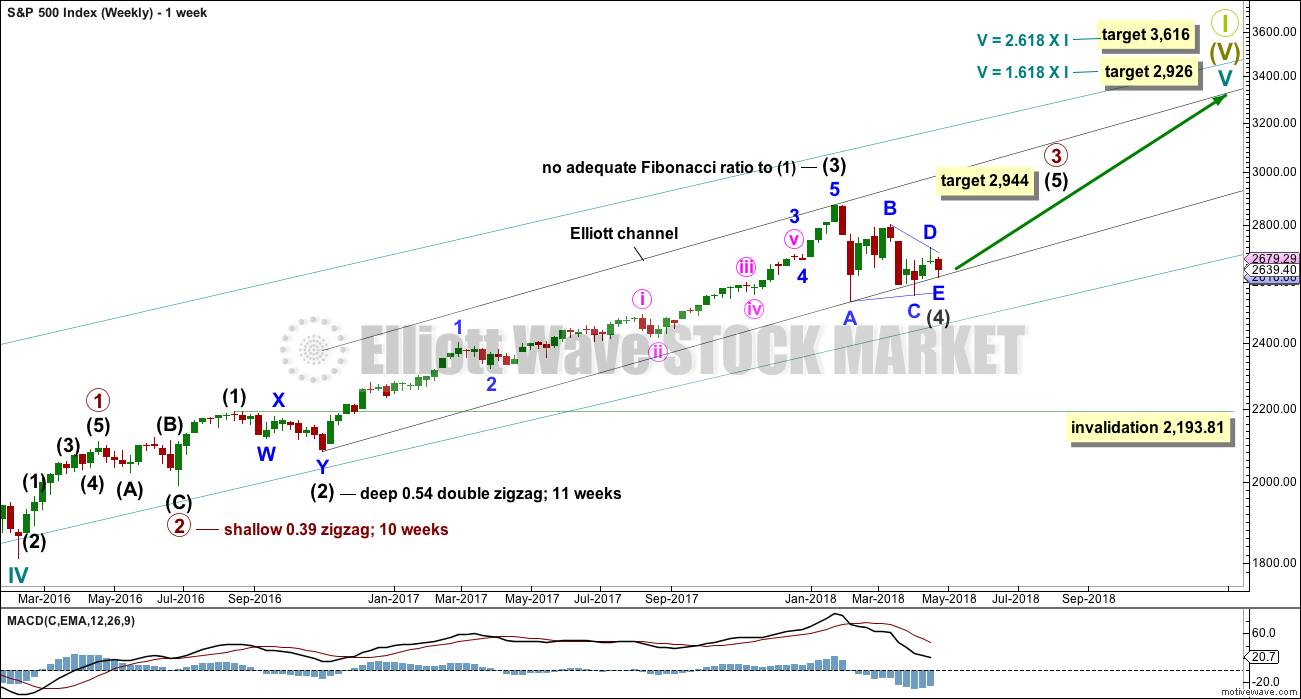
WEEKLY CHART
Cycle wave V must complete as a five structure, which should look clear at the weekly chart level. It may only be an impulse or ending diagonal. At this stage, it is clear it is an impulse.
Within cycle wave V, the third waves at all degrees may only subdivide as impulses.
Intermediate wave (4) has breached an Elliott channel drawn using Elliott’s first technique. The channel is redrawn today using Elliott’s second technique: the first trend line from the ends of intermediate waves (2) to (4) at today’s low, then a parallel copy on the end of intermediate wave (3). Intermediate wave (5) may end either midway within the channel, or about the upper edge.
At least three wave counts remain valid at the daily chart level. It is possible still that a low may not be in place; intermediate wave (4) could still continue further. Intermediate wave (4) may not move into intermediate wave (1) price territory below 2,193.81. However, it would be extremely likely to remain within the wider teal channel (copied over from the monthly chart) if it were to be reasonably deep. This channel contains the entire bull market since the low in March 2009, with only two small overshoots at the end of cycle wave IV. If this channel is breached, then the idea of cycle wave V continuing higher would be discarded well before the invalidation point is breached.
If intermediate wave (4) ends anytime within this week, then it would total a Fibonacci 13 weeks. It would have excellent proportion with intermediate wave (2), and there would be perfect alternation if it is over as a shallow triangle.
At this stage, there are still three possible structures for intermediate wave (4): a triangle, a combination, and a flat correction. All three will be published. The triangle is preferred because that would see price continue to find support about the 200 day moving average. While this average continues to provide support, it is reasonable to expect it to continue (until it is clearly breached).
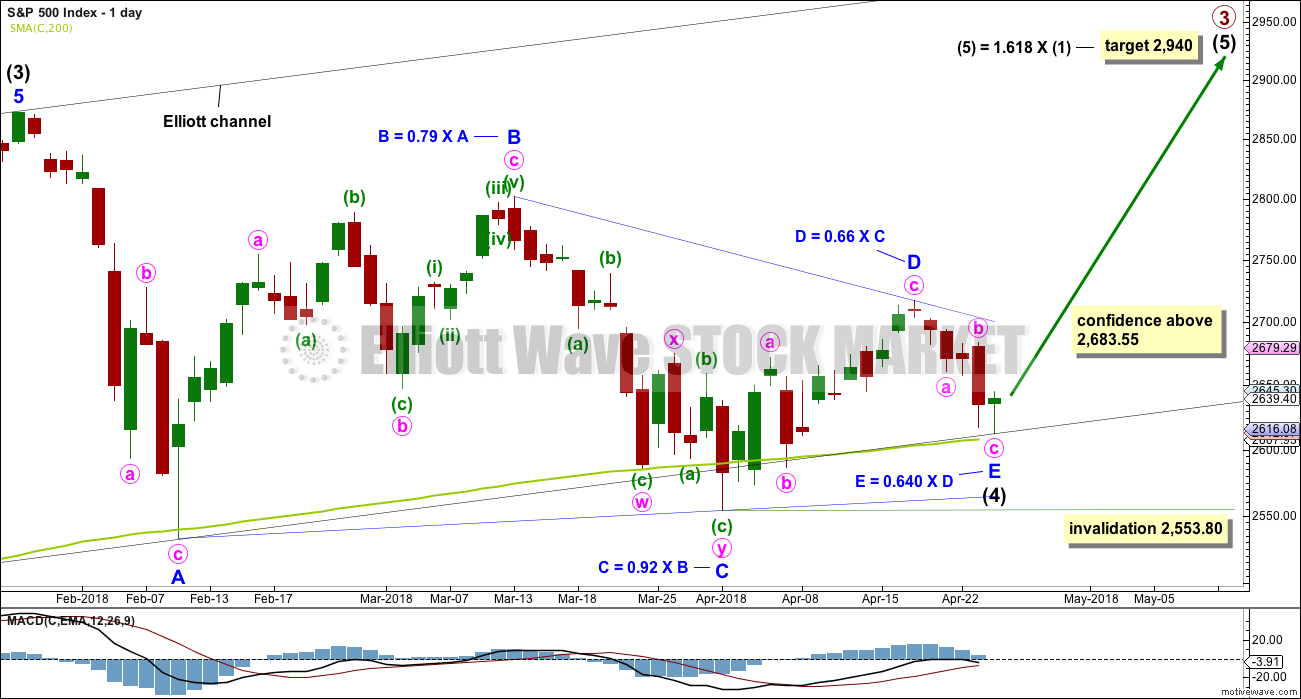
DAILY CHART
It is possible again today that intermediate wave (4) is now a complete regular contracting triangle, the most common type of triangle. Minor wave E may have ended at today’s low, finding support just above the 200 day moving average and ending reasonably short of the A-C trend line. This is the most common look for E waves of triangles.
Intermediate wave (3) exhibits no Fibonacci ratio to intermediate wave (1). It is more likely then that intermediate wave (5) may exhibit a Fibonacci ratio to either of intermediate waves (1) or (3). The most common Fibonacci ratio would be equality in length with intermediate wave (1), but in this instance that would expect a truncation. The next common Fibonacci ratio is used to calculate a target for intermediate wave (5) to end.
It must be accepted today that the risk with this wave count is that a low may not yet be in place; intermediate wave (4) could continue lower. For this triangle wave count, minor wave E may not move beyond the end of minor wave C below 2,553.80.
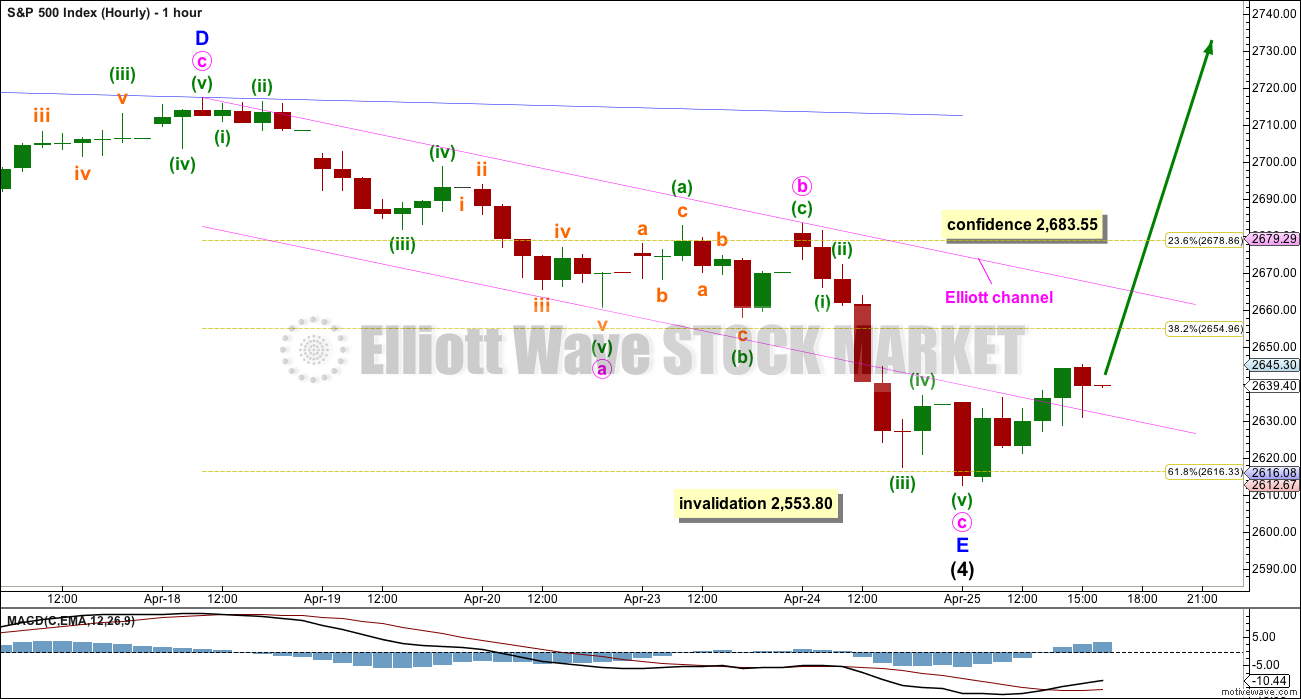
HOURLY CHART
Minor wave E still subdivides as a complete zigzag. There is no adequate Fibonacci ratio between minute waves a and c.
A channel is drawn about minor wave E using Elliott’s technique for a correction. The earliest confidence that a low may be in place would come with a breach of the upper edge of this channel by upwards movement.
Thereafter, a new high above 2,683.55 would add further confidence that a low may be in place. This point is the start of minute wave c. A new high above the start of minute wave c could not be a second wave correction within minute wave c, so at that stage minute wave c would have to be over and the invalidation point may move up to the end of minor wave E at 2,617.32.
Triangles most commonly end with wave E falling reasonably short of the A-C trend line. The first movement after the completion of a triangle is often swift and sharp. While this is true very often, it is not true always. I have also seen triangles come to a conclusion and price begin a little more slowly to move out of them, only accelerating when price breaks out of support / resistance zones.
ALTERNATE WAVE COUNTS
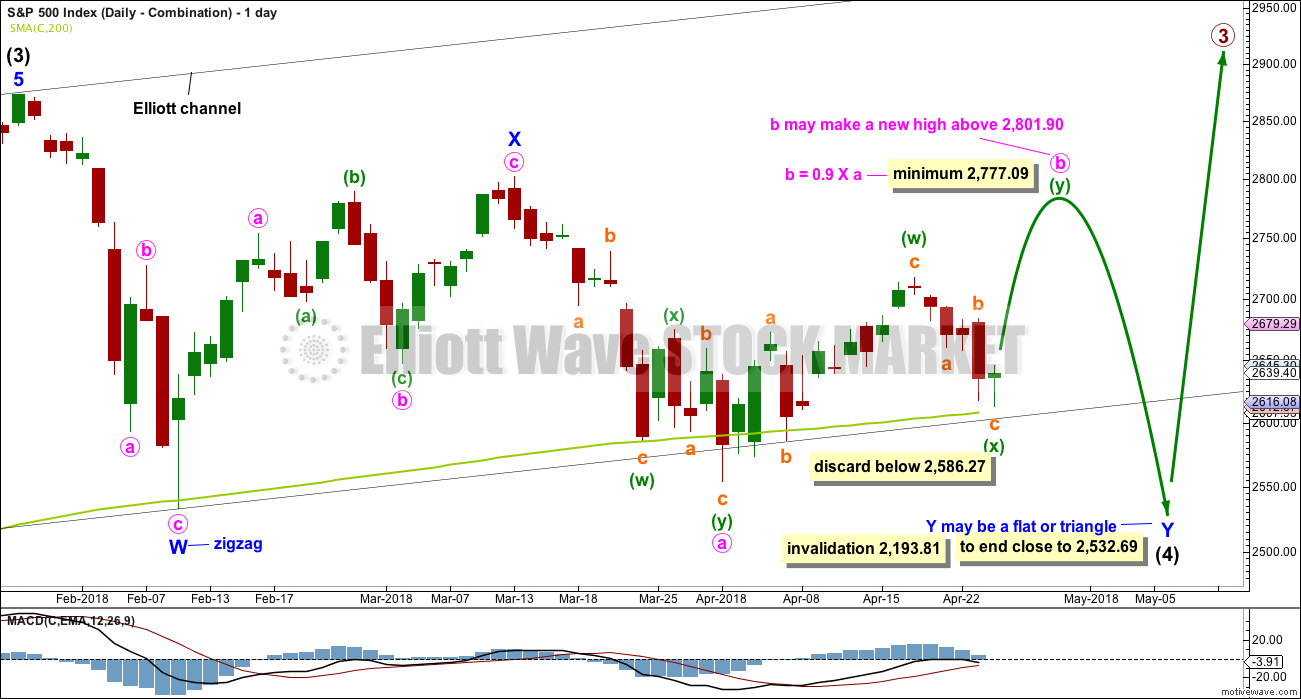
DAILY CHART – COMBINATION
Double combinations are very common structures. The first structure in a possible double combination for intermediate wave (4) would be a complete zigzag labelled minor wave W. The double should be joined by a three in the opposite direction labelled minor wave X, which may be a complete zigzag. X waves within combinations are typically very deep; if minor wave X is over at the last high, then it would be a 0.79 length of minor wave W, which is fairly deep giving it a normal look. There is no minimum nor maximum requirement for X waves within combinations.
The second structure in the double would most likely be a flat correction labelled minor wave Y. It may also be a triangle, but in my experience this is very rare, so it will not be expected. The much more common flat for minor wave Y will be charted and expected.
A flat correction would subdivide 3-3-5. Minute wave a must be a three wave structure, most likely a zigzag. It may also be a double zigzag.
Minute wave b must now reach a minimum 0.90 length of minute wave a. Minute wave b may be unfolding as a double zigzag. Within a double zigzag, the second zigzag exists to deepen the correction when the first zigzag did not move price deep enough. Double zigzags normally have a strong slope like single zigzags. To achieve a strong slope the X wave within a double zigzag is normally brief and shallow, most importantly shallow (it rarely moves beyond the start of the first zigzag). A new low now below 2,586.27 should see the idea of a double zigzag for minute wave b discarded.
The purpose of combinations is to take up time and move price sideways. To achieve this purpose the second structure in the double usually ends close to the same level as the first. Minor wave Y would be expected to end about the same level as minor wave W at 2,532.69. This would require a strong overshoot or breach of the 200 day moving average, which looks unlikely but does have precedent in this bull market.
Minute wave b may make a new high above the start of minute wave a if minor wave Y is an expanded flat. There is no maximum length for minute wave b, but there is a convention within Elliott wave that states when minute wave b is longer than twice the length of minute wave a the idea of a flat correction continuing should be discarded based upon a very low probability. That price point would be at 3,050. However, if price makes a new all time high and upwards movement exhibits strength, then this idea would be discarded at that point. Minute wave b should exhibit obvious internal weakness, not strength.
DAILY CHART – FLAT
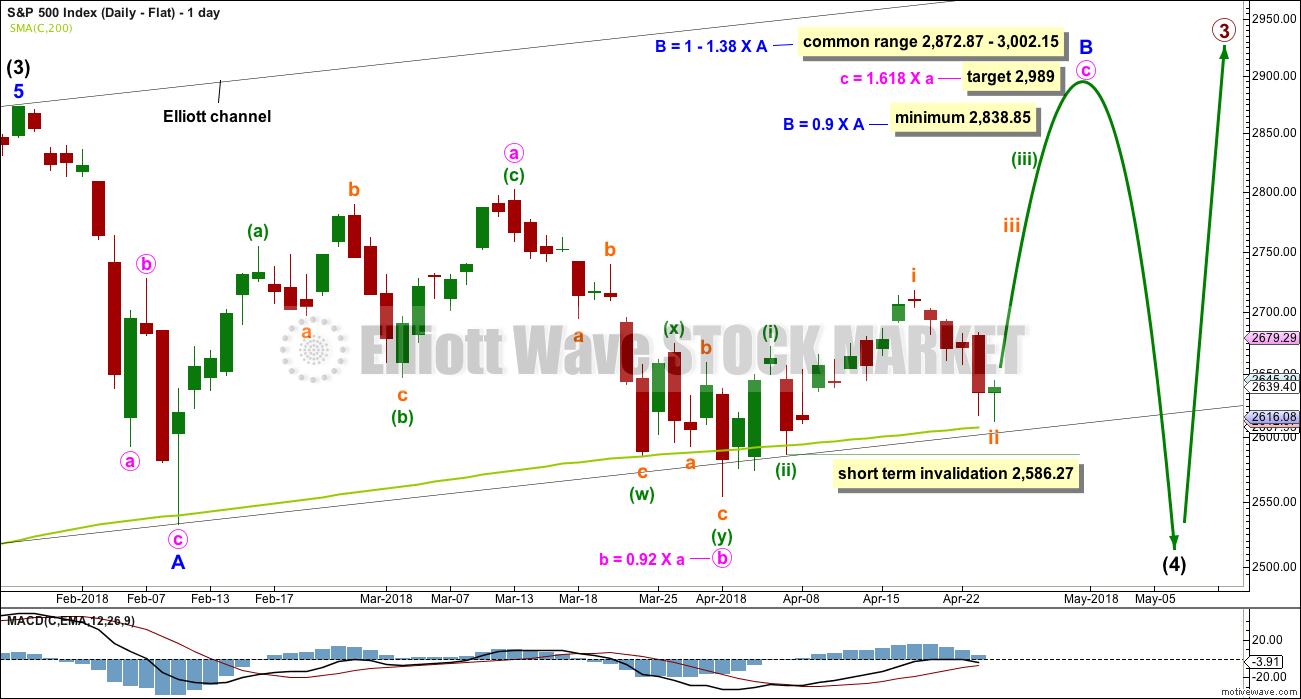
Flat corrections are very common. The most common type of flat is an expanded flat. This would see minor wave B move above the start of minor wave A at 2,872.87.
Within a flat correction, minor wave B must retrace a minimum 0.9 length of minor wave A at 2,838.85. The most common length for minor wave B within a flat correction would be 1 to 1.38 times the length of minor wave A at 2,872.87 to 3,002.15. An expanded flat would see minor wave B 1.05 times the length of minor wave A or longer, at 2,889.89 or above. A target is today calculated for minor wave B to end, which would see it end within the common range.
Minor wave B may be a regular flat correction, and within it minute wave a may have been a single zigzag and minute wave b may have been a double zigzag. This has a very good fit.
However, minute wave c must be a five wave structure for this wave count and now the depth and duration of subminuette wave ii looks wrong. The probability that minute wave c upwards is unfolding as an impulse is now reduced. It is possible that it could be a diagonal, but that too has a relatively low probability as the diagonal would need to be expanding to achieve the minimum price target for minor wave B, and expanding ending diagonals are not very common.
At its end minor wave B should exhibit obvious weakness. If price makes a new all time high and exhibits strength, then this wave count should be discarded.
This wave count would require a very substantial breach of the 200 day moving average for the end of intermediate wave (4). This is possible but may be less likely than a smaller breach.
TECHNICAL ANALYSIS
WEEKLY CHART
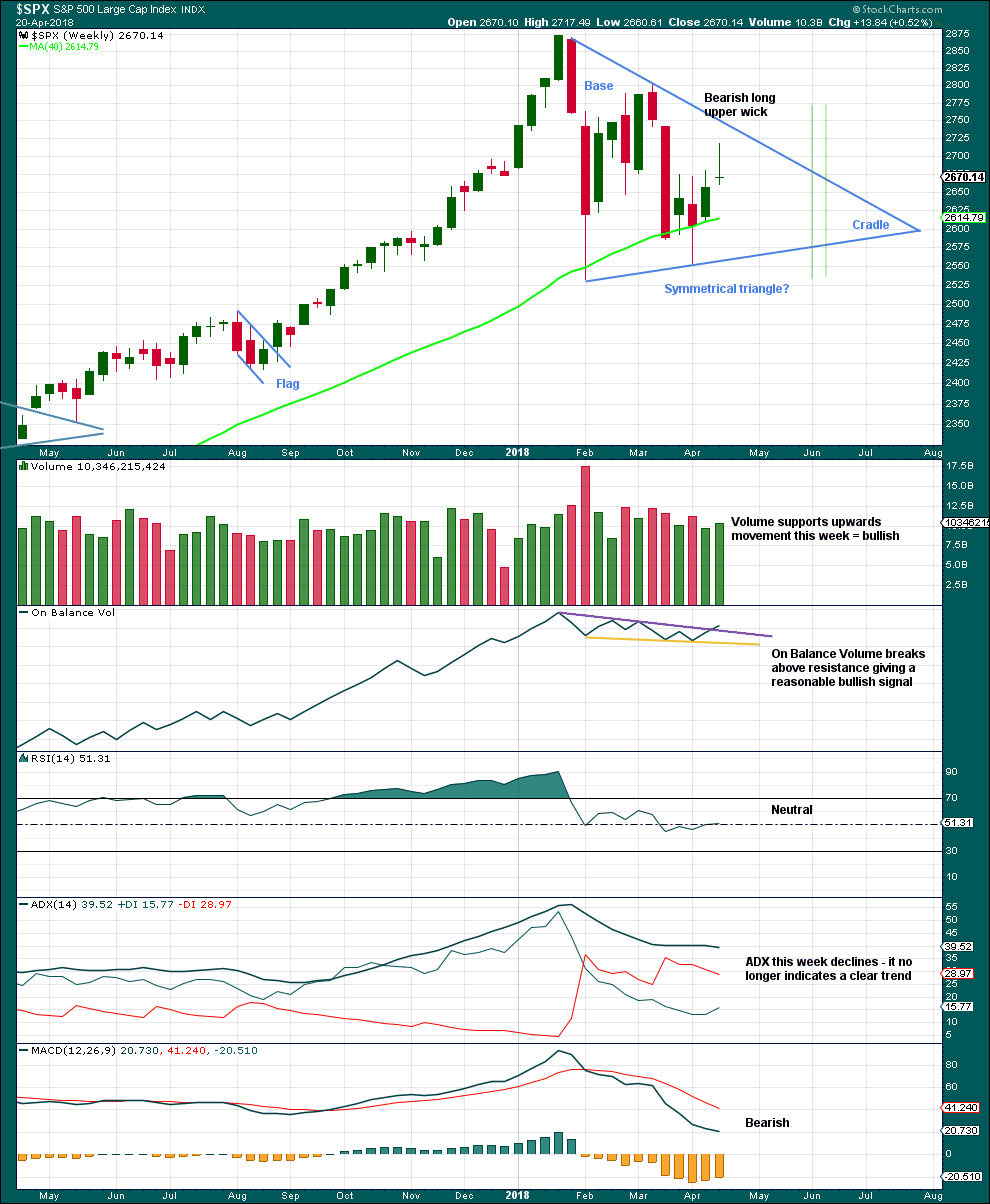
Click chart to enlarge. Chart courtesy of StockCharts.com.
A classic symmetrical triangle pattern may be forming. These are different to Elliott wave triangles. Symmetrical triangles may be either continuation or reversal patterns, while Elliott wave triangles are always continuation patterns and have stricter rules.
The vertical green lines are 73% to 75% of the length of the triangle from cradle to base, where a breakout most commonly occurs.
From Dhalquist and Kirkpatrick on trading triangles:
“The ideal situation for trading triangles is a definite breakout, a high trading range within the triangle, an upward-sloping volume trend during the formation of the triangle, and especially a gap on the breakout.”
For this example, the breakout has not yet happened. There is a high trading range within the triangle, but volume is declining.
The triangle may yet have another 7 – 8 weeks if it breaks out at the green lines.
On Balance Volume gives a reasonable bullish signal last week with a breakout from a small range, above resistance. The signal is neither strong nor weak. The trend line broken has a shallow slope, is somewhat long held, and has been tested three or four times before.
A bullish signal from On Balance Volume and support last week for upwards movement offer good support to the main Elliott wave count. The bearish long upper wick though suggests a pullback for the short term, which is also what the main Elliott wave count expects.
DAILY CHART
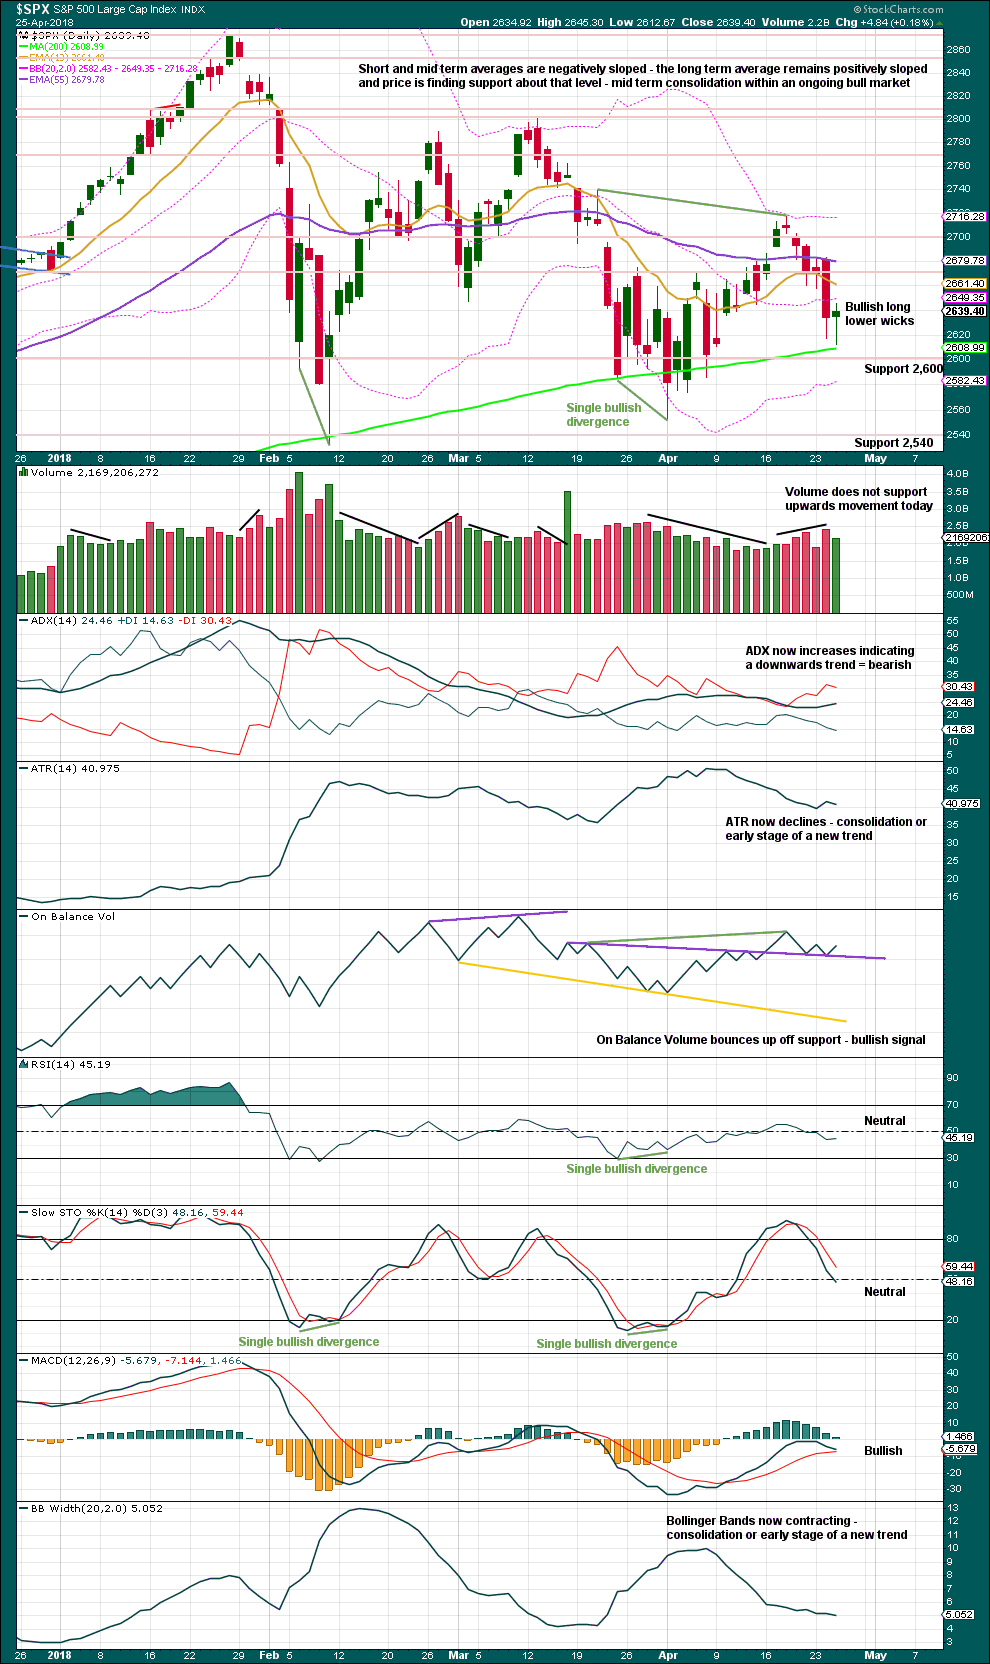
Click chart to enlarge. Chart courtesy of StockCharts.com.
Now two long lower wicks close to the 200 day moving average look increasingly bullish. Although volume does not well support upwards movement within this session, volume is not especially light at this time.
Weight should be given to the bullish signal from On Balance Volume today. This supports the main Elliott wave count.
VOLATILITY – INVERTED VIX CHART
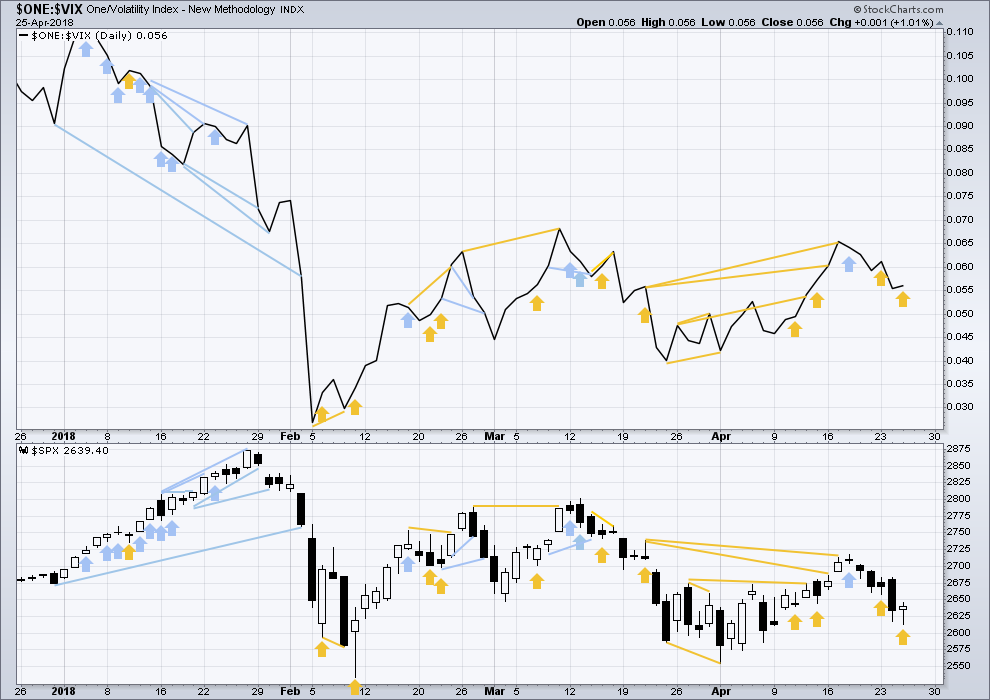
Click chart to enlarge. Chart courtesy of StockCharts.com.
So that colour blind members are included, bearish signals will be noted with blue and bullish signals with yellow.
Normally, volatility should decline as price moves higher and increase as price moves lower. This means that normally inverted VIX should move in the same direction as price.
Price today moved lower with a lower low and a lower high, but inverted VIX has moved higher. This divergence is bullish and offers a little support to the main Elliott wave count.
BREADTH – AD LINE
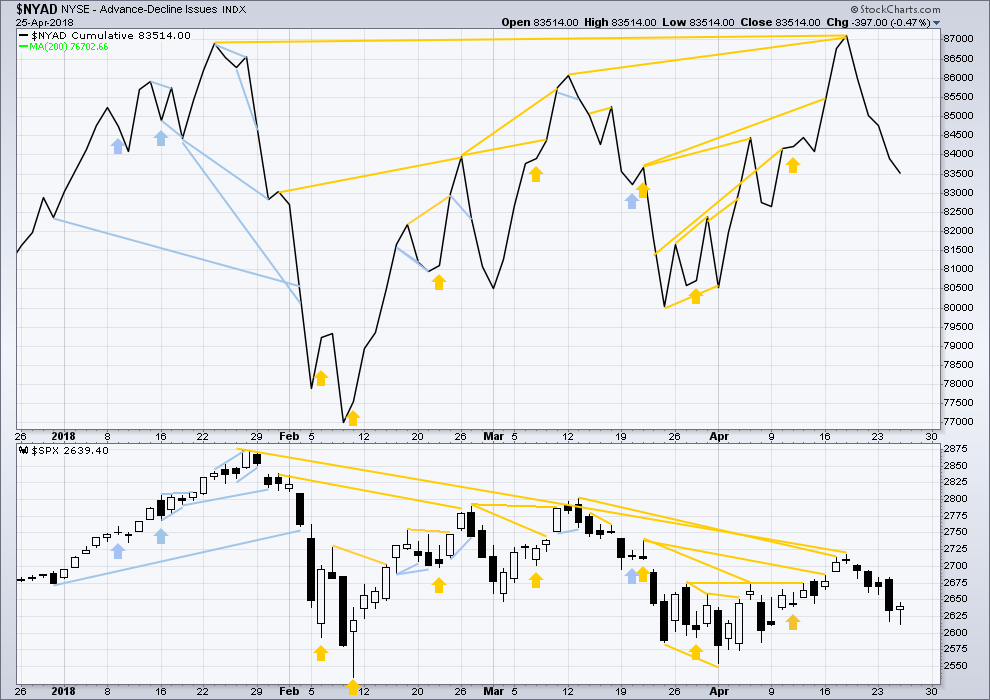
Click chart to enlarge. Chart courtesy of StockCharts.com.
There is normally 4-6 months divergence between price and market breadth prior to a full fledged bear market. This has been so for all major bear markets within the last 90 odd years. With no longer term divergence yet at this point, any decline in price should be expected to be a pullback within an ongoing bull market and not necessarily the start of a bear market. A new all time high from the AD line this week means that any bear market may now be an absolute minimum of 4 months away.
Today all of small, mid and large caps have made at least slight new lows below their prior swing lows of the 13th of April. This pullback has support from falling market breadth.
Breadth should be read as a leading indicator.
The new all time high from the AD line remains very strongly bullish and supports the main Elliott wave count.This new all time high from the AD line will be given much weight in this analysis. This is the piece of technical evidence on which I am today relying most heavily in expecting a low may be in place here or very soon.
There has been a cluster of bullish signals from the AD line in the last few weeks. This also overall offers good support to the main Elliott wave count.
The new low today in price comes with support from a declining AD line. There is no divergence.
DOW THEORY
The following lows need to be exceeded for Dow Theory to confirm the end of the bull market and a change to a bear market:
DJIA: 23,360.29.
DJT: 9,806.79.
S&P500: 2,532.69.
Nasdaq: 6,630.67.
At this stage, only DJIA has made a new major swing low. DJT also needs to make a new major swing low for Dow Theory to indicate a switch from a bull market to a bear market. For an extended Dow Theory, which includes the S&P500 and Nasdaq, these two markets also need to make new major swing lows.
Charts showing each prior major swing low used for Dow Theory may be seen at the end of this analysis here.
Published @ 09:45 p.m. EST.

Okay, my last one of the day and I promise to get up and go eat and play some pinball or guitar or pool (no, resting some tendenitis in my shoulder) or something…
I just noticed on the daily, that an upper half squeeze occurred with the mid March top and turn, and again at the mid April top and turn. That latter half squeeze is ongoing here, and price is moving up towards it (2700 area). Hmmm…perhaps the combination wave count will live, that’s just about the zone for the combo to turn back down in. Definitely something to keep our eye on.
The price action today and a lot of the feedback I’m hearing and wave counts are all pointing to a strong rally. I am setup small long in anticipation of this rally but find it hard to believe we are going to touch ATH with rates where they are now. They’ve rallied quite a bit from when we were last at highs. It’s obviously possible but it is holding me back from being overly bullish.
What is the alternative scenario if we can’t reach new ATH? Thanks.
Either the combination or the flat. And of those, the combination looks better.
A rally to 2,777.09 minimum, followed by a deep pullback to end below 2,553.80 and close to 2,532.69.
Updated hourly chart:
So far it looks like a third wave impulse ending. When the fourth wave correction turns up it should remain within the upwards sloping best fit channel (the new one). It can’t move back down into first wave price territory, but it shouldn’t get anywhere near that point.
A five up does not yet look complete. I’m labelling it minor 1.
When it’s done, a pullback for minor 2 may offer another entry point for long positions.
The first second wave correction within a new trend for the S&P is not always deep. I don’t have a ratio of deep to shallow, but I’m just wanting to warn folks here that if you’re waiting for a deep minor 2 to jump in, it’s not necessarily going to happen.
price has very nearly tagged the 61.8% retrace at 2677, and that’s the obvious and likely place for the (micro) violet circle iv to start. I’ll be watching for a pullback to the 2653-64 area, the range of the prior (lower degree) green (iv). And then taking fresh buy triggers. I expect this will play out early to mid-session tomorrow.
looks about right!
but it’s pink Kevin, not violet. violet is micro degree, pink is minute.
maybe it’s a girl thing, but I really like colour. lots of it!
also… doing a Super Happy Morning Dance today. the markets are behaving nicely and the technicals looking good!
lmao here. PINK! That’s so funny because I literally stared at it thinking “now what is that color?” and pink never entered my mind, even though it is obviously pink! Just another facet of my mental disturbances I guess.
I like to encode information into color on the chart. I don’t actually care much for the “green/red” bar look, as I think it diverts too much attention from the trend. I really prefer to have my bars color coded based on trend strength. Sadly, with MotiveWave and its Java API for custom indicators, I’m challenged in doing that (step 1: learn Java. step 2: learn a build environment like Eclipse. step 3: translate custom scripts from thinkscript to Java. step 4: get it properly built and installed into MW. There goes several days and probably a few tons of frustration along the way!). How I wish they had a Thinkorswim type of simple scripting interface (ala ThinkScript).
Here’s an example of what I call a “half squeeze” on SPX 5 minute chart. Orange bands are bollingers, blue bands are keltners (both 21 period). See where the orange comes into the blue on the low side (only)? Price approaches…and turns like a frightend elephant encountering a mouse and takes off!! I notice this action ALOT, and I’m am increasingly using it as a trade setup. It’s the “half squeeze” indicator!
Thank you very much Kevin for sharing that! Looks like a very nice entry point technique.
Bitcoin (GBTC – exchange tradeable with “issues”) indeed launched into a 5 wave move up as I outline a few weeks back. I’ve been grabbing bites here and there. It’s now just about complete with the 4 wave (I believe of the 3 wave up, though I could be off by one on that), a triangle. A 5 “should be” kicking off Real Soon Now. In case anyone is interested…should be a minimum 10% move up, and potentially quite a bit more (20%+). As always, “I could be wrong…”
thanks for this chart, I have a little etherium mine (a dozen GPUs just for kicks), and I also buy and sell ETH and it seems to follow BTC
62% retrace of April 18 high to April 25 low is 2677, and that’s the next key fibo decision point. Lots of resistance there from April 20 and 23rd. I highly suspect that’ll be it for today. What we DO have here is a pretty clear motive wave launch, per Lara’s main count! While price could still be in the flat or combination structure, and thus subject to yet another major sell off upcoming in a few days, it also gives a signal that the intermediate 4 triangle may be fully cooked! I’m taken some longs here and there, and will be moving my stops up with this rise generally to BE. Let ‘er rip!!!
Bull trap!?
If it plays out as a combo or flat…yup! In particular, a flat structure per Lara’s 2nd alternative here would be a massive bull trap. Can’t confirm the triangle 4 is “it” until price pretty much gets up to new ATH’s!! So I have awhile to earn that $1 that I just might owe Rodney. But if it’s a flat or combo bull trap, he both owes me and gets eaten by the bear!
I’m going to give quite a lot of weight to that new ATH from the AD line last week. That supports the idea that intermediate (4) is now over.
If we make new ATHs in price, then I’ll look for strength / weakness. If it’s strong, I’ll discard the combination and flat wave counts and leave the main. If it’s weak I’ll keep the combination and flat counts.
Really hard to guess market direction but we are at levels that are lofty. I came across this chart and it reminded me why I’m a bear at heart. Long term this will be dealt with. Short term, who knows. I’m not seeing great volume in this move up so it has me concerned.
Agreed, it will be “dealt with”, similar to 2008 and 2000-2002, etc. When that starts is the question. Lara’s long term analysis is extremely valuable in this regard, as are her “indicators” of major market tops that have always occurred and given signals 4+ months in advance. They have haven’t occurred yet in the current situation, and that’s comforting re: taking positional longs.
That weak volume has been a feature of this bull market (from 2009) for years.
With price rising on declining volume at the monthly chart level, I think it means that eventually when this turns to a bear price may fall in a vertical drop. Because light volume means little support below.
It’s quite a scary thought IMO.
But I do not think the high is in yet. It may be upon us this October, if not then I’ll look for October 2019.
Hopefully we won’t have an October 1987 event. Anything is possible at these levels.
Ya never know
I kinda think that’s actually pretty likely….
But not yet.
Pop out of bearish rising wedge….they all end the same way folks… 🙂
The plan is obviously to bait both bulls and bears until the close. Sitting on an option straddle and will add to direction of the break. Smart thing to do is SOH until we have directional break confirmation….
verne, couple questions regarding your plan…what expiration do u use when doing such straddle? how do you decide on break being successful…appreciate your direction…
are we gonna close the gap still?
Not in my opinion. Could be wrong.
SPX now possibly turning at 61% retrace (2653) of entire upmove from lows a few days ago. If that holds…no. If it breaks…anything’s possible.
Sorry, my bad. 62% of move from today’s low to today’s high….
I have to say I am sometimes amazed at how differently we sometimes view market price action…not that that is necessarily bad…but still amazing…! 🙂
Hi Kevin
I don’t understand what your saying here.
If your talking about the recent high of 2717 in SPX and the recent low of 2612 in SPX we would still have more room to go higher to be at the 62% correct?
Thank You
No no no. TODAY’S high vs. TODAY’S open. It retrace 62% of that move and turned back up. Now it’s formed a little double top. I think the push up will likely continue, because everything is conforming so far to Lara’s main EW structure. I give a lot of credence to that, when the market tracks it. If the market turns back down and pushed through the current swing low at 2654, then price is going back into the muck for a few days most likely, and the downside risk increases radically. If price keeps pushing up here…follow the wave count, despite the bearish chatter! Rodney’s hunting those bears so all is good, lol!!!
VIX on the move. Stark divergence from ramp higher….
TY for pointing that out!
Ok, anybody got a count? I’m thinking 1 and 2, then a smaller degree leading diagonal 1 and 2 and then gap up to start the 3?
Yeh Peter,
I tend to agree.
Selling remaining SPY 268 calls into strength. Market makers really tried to pull a fast one so glad I waited them out…wascals! 🙂
gap open and sell off, as usual? it’s not yet a gap open and go, that’s for sure. The longer it goes sideways, the more chance it’s going to fill and go back to rinse cycle. I thought perhaps with the strong openings across the board it might be off to the races time. Nyet…
Yep. I expect the gap will be filled. It could head higher after that but it’s looking bearish to moi…
maybe we both be wrong at the moment…fortunately, I got aboard as it failed to break down after 20 minutes. My “long term” position. Now to trade it around the edges….
BTW, the “inverse head and shoulders” in SPX is playing out according to Hoyle!
I am scaled out of all my longs on this last move up. Neg divergences across many time frames persist.
Looking for big short position on gap closure.
You still may be right. But at the moment…it’s still pushing up fairly strongly. Pausing now at 50% fibo at 2665. Next stop up is 62% at 2677. Then 78% at 2694. Any of these could turn the market. As I said, I’m still expecting some back and forth before the impulse really takes off…but could be wrong!!
Looking better yet?
“I feeeeeel goot!!! The way that I should!…..” Let’s go to 3000!! Lol!!! An up day has felt like forever ago….
I pulled that trade. Too many red flags.
Neg divergences on this ramp higher.
Market makers absolutely ripping off traders with bid/ask on calls. This looks and smells like a bull trap.
Which platform do you use to trade options?
TOS.
The cartel has made it quite clear that they will defend DJI 24K at all costs so we can use that info to our advantage in the short term.
I will be selling to open the DIA 235/240 bull put spread expiring May 4 for a credit of 1.25 per contract sold. The five point spread means risk is 500 per contract (less credit, of course) if the diamonds are trading below 235 on May 4. Risk may be reduced with a narrower spread. I will exit the short 240 puts on any DIA CLOSE below 240. If you are not trading spreads in this market, learn how!
It is the only kind of trade in which you actually have an ADVANTAGE over market makers! Have a great trading day every one!
We have now had a double digit number of taps on the 200 day SMA. Under the circumstances, it seems to me each new tap weakens that pivot, and personally I am now starting to thimk the next big event will be coordinated bteaks below 200 day. SMAs across a number of indices. Getting more bearish. If we don’t clear the BD trendline today I will be on the sidelines for short term trades.
Watch out for several days to up to two weeks of churning action similar to late March/early April. This might be a time to range trade until a clear trend kicks off. And avoid getting whipsawed. We might get 2-4 crosses back and forth of this general price zone very quickly. And a break either way is possible for sure.
Which leads me to note that every EW diagram tonight has price moving up from here. As a contrarian, that makes me suspect the majority of the trading world tomorrow is bullish as well, and therefore there will be a strong sell off.
Per normal for 4th wave, there have been a lot of options to sort through and attempt to prioritize. Nice job sorting through them.
Everyone is seeing triangles. I try to avoid them because they seem to often turn into something else. Consequently, my eyes have been following your daily flat option.
However, I do have a triangle question
Curious if you considered a B wave triangle starting at 2801? If so, what reduced its probability? Do the subwaves not fit well or that the measured move out of it too large for the weekly structure?
apologies for the delayed response Paul, I missed your question earlier.
To see a B wave triangle beginning there, wave A would have to be a three wave structure (just before it, the wave up that is labelled minor B on the main daily chart, it’s a three).
When wave A subdivides as a three, then a flat is indicated. Wave B then must retrace a minimum 0.9 of wave A. In this instance that price point would be 2,559.61.
Your B wave triangle beginning there would now have waves A, B and C complete. Wave C with a low two days ago at 2,612.67.
It’s impossible now for wave E to end at a minimum 2,559.61 because it can’t move below 2,612.67.
This is all getting really complicated so I’ll chart it and show you….
here is your idea charted.
now, it could still work if we relabelled minute a as minute w, the first zigzag in a double zigzag for minor B
then your triangle could be wave x
but it won’t work as A-B-C, a flat correction for minor B. Because within it the triangle cannot meet the minimum 0.9 X a
this works, the subdivisions fit and it can meet all EW rules
BUT
my problem now is that new all time high on the AD line this week, that is so bullish, it strongly indicates a new bull run for price
this idea would be expecting a deep sharp pullback to end below 2,532.69, which would require a substantial breach of the 200 day moving average
and with a new ATH from the AD line, I don’t think that’s very likely now at all.
wave one….
Now I get it. It took me a rethink to understand. I’d respond but I don’t want to be a second wave!
Better than being a turd…! 🙂
Wrong again Verne!! Turd waves are the strongest, haven’t you heard???
A turd wave is the strongest what?
Headed to the mountains looking for spring bear. Don’t tell Lara but spring bear hunting season is open in my area. However, I hunt with a camera and my partner named Hunter of course. I’ll be back late tomorrow or Saturday.
All my longs are positioned and stops set comfortably below. It is nice to see nothing but green as we are starting this next move up. My average Upro entry price is $126.58. If the count is correct, this should eventually exceed $172. I have some concerns as to how to handle Primary 4 which is right around the corner.
Bye y’all.
Don’t let Hunter tell you to stand next to the bear for a picture. That’s sure to wipe out your position, in more ways than one!!
That’s beautiful Rodney, enjoy your mountains.
Crap! My mistake! 🙂
“Those who mistake a third for a turd miss the party!” I think a few might have made this mistake today.
hopefully no one here!