A small inside day changes the Elliott wave counts only slightly at the hourly chart level.
Summary: If resistance about 2,670 – 2,675 can be overcome, then the upwards swing should continue. The first target is at 2,705. If price keeps rising through the first target, then the next target is a zone from 2,752 to 2,766. Do not expect an upwards swing here to move in a straight line. Price is normally choppy and overlapping in swings within consolidations, and this market at this time is consolidating.
A rising wedge on the hourly chart points to a pullback tomorrow. A target would be about 2,616. However, this is contradicted today by support for On Balance Volume and weak bullish signals from inverted VIX and the AD line.
Always practice good risk management. Always trade with stops and invest only 1-5% of equity on any one trade.
New updates to this analysis are in bold.
The biggest picture, Grand Super Cycle analysis, is here.
Last historic analysis with monthly charts is here. Video is here.
An alternate idea at the monthly chart level is given here at the end of this analysis.
An historic example of a cycle degree fifth wave is given at the end of the analysis here.
MAIN ELLIOTT WAVE COUNT
WEEKLY CHART
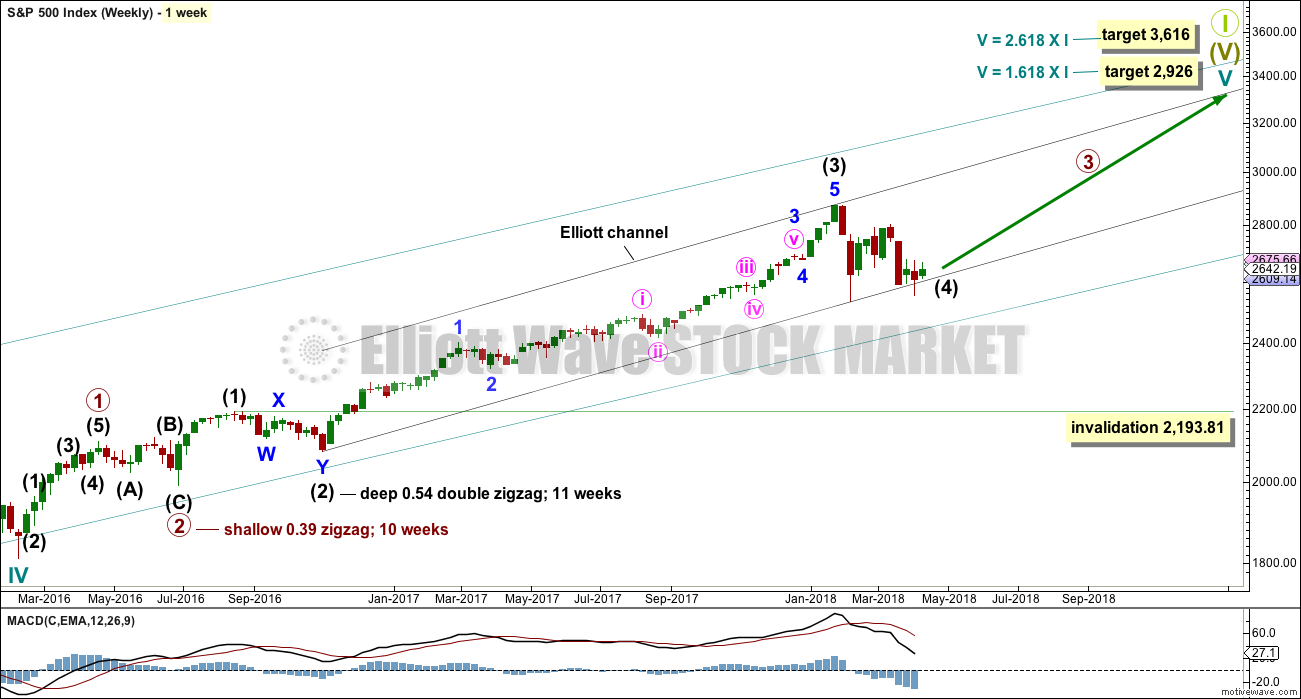
Cycle wave V must complete as a five structure, which should look clear at the weekly chart level. It may only be an impulse or ending diagonal. At this stage, it is clear it is an impulse.
Within cycle wave V, the third waves at all degrees may only subdivide as impulses.
Intermediate wave (4) has breached an Elliott channel drawn using Elliott’s first technique. The channel is redrawn using Elliott’s second technique as if intermediate wave (4) was over at the first swing low within it. If intermediate wave (4) continues sideways, then the channel may be redrawn when it is over. The upper edge may provide resistance for intermediate wave (5).
Intermediate wave (4) may not move into intermediate wave (1) price territory below 2,193.81. However, it would be extremely likely to remain within the wider teal channel (copied over from the monthly chart) if it were to be reasonably deep. This channel contains the entire bull market since the low in March 2009, with only two small overshoots at the end of cycle wave IV. If this channel is breached, then the idea of cycle wave V continuing higher would be discarded well before the invalidation point is breached.
At this stage, it now looks like intermediate wave (4) may be continuing further sideways as a combination, triangle or flat. These three ideas are separated into separate daily charts. All three ideas would see intermediate wave (4) exhibit alternation in structure with the double zigzag of intermediate wave (2).
A double zigzag would also be possible for intermediate wave (4), but because intermediate wave (2) was a double zigzag this is the least likely structure for intermediate wave (4) to be. Alternation should be expected until price proves otherwise.
DAILY CHART – TRIANGLE
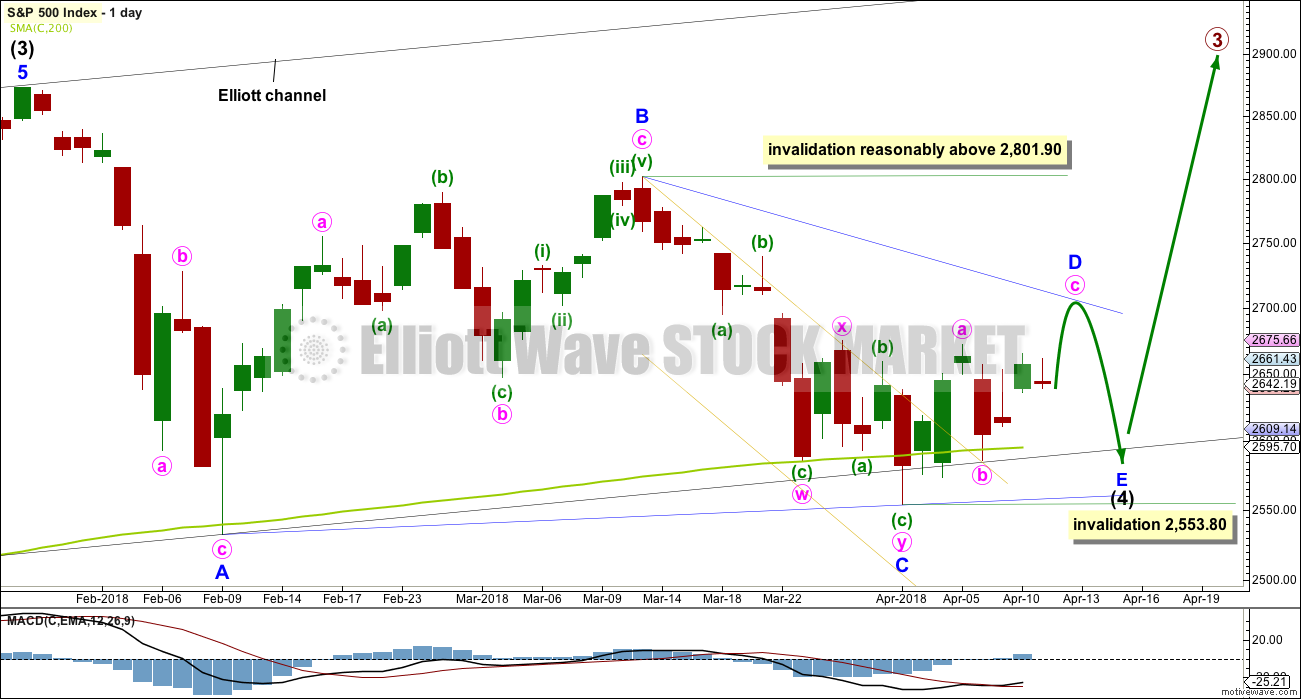
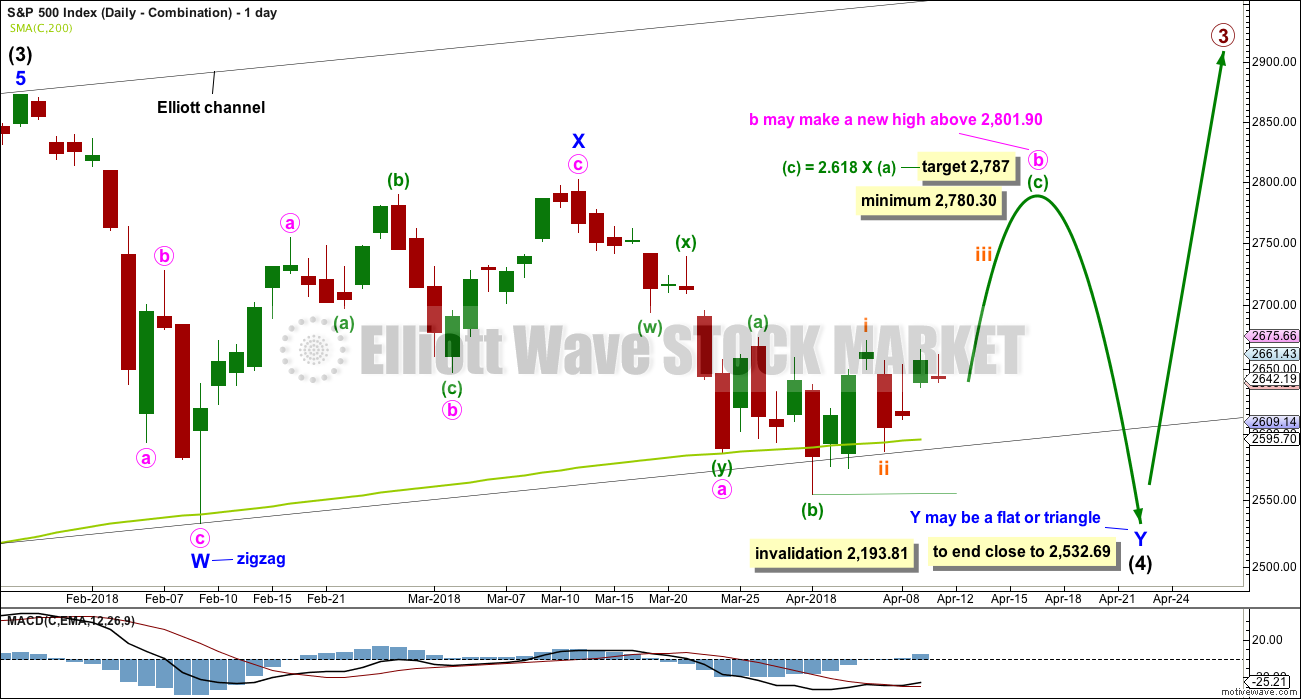
This first daily chart looks at a triangle structure for intermediate wave (4). The triangle may be either a regular contracting or regular barrier triangle. Within the triangle, minor waves A, B and C may be complete.
If intermediate wave (4) is a regular contracting triangle, the most common type, then minor wave D may not move beyond the end of minor wave B above 2,801.90.
If intermediate wave (4) is a regular barrier triangle, then minor wave D may end about the same level as minor wave B at 2,801.90. As long as the B-D trend line remains essentially flat a triangle will remain valid. In practice, this means the minor wave D can end slightly above 2,801.90 as this rule is subjective.
When a zigzag upwards for minor wave D is complete, then this wave count would expect a final smaller zigzag downwards for minor wave E, which would most likely fall reasonably short of the A-C trend line.
If this all takes a further three weeks to complete, then intermediate wave (4) may total a Fibonacci 13 weeks and would be just two weeks longer in duration than intermediate wave (2). There would be very good proportion between intermediate waves (2) and (4), which would give the wave count the right look.
There are now a few overshoots of the 200 day moving average. This is entirely acceptable for this wave count; the overshoots do not mean price must now continue lower. The A-C trend line for this wave count should have a slope, so minor wave C should now be over.
Within the zigzag of minor wave D, minute wave b may not move beyond the start of minute wave a below 2,553.80.
HOURLY CHART
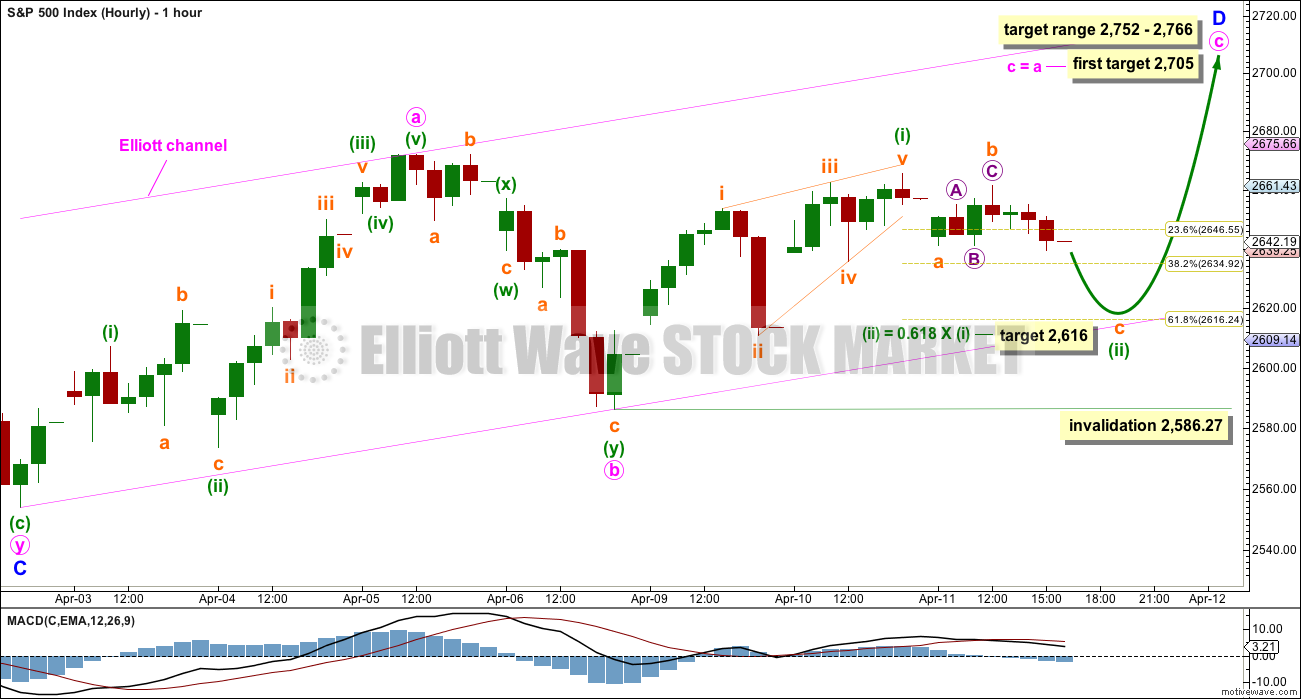
Minor wave D upwards should subdivide as a zigzag. Within the zigzag, minute wave b now shows up on the daily chart as a large red daily candlestick. This would give minor wave D an obvious three wave look on the daily chart, which should be expected.
Minute wave b subdivides as a completed double zigzag. The most common Fibonacci ratio is used to calculate a target for minute wave c. This would see minor wave D shorter than the common length of 0.80 to 0.85 the length of minor wave C.
Minute wave c must subdivide as a five wave structure. So far within it only minuette wave (i) may be complete at yesterday’s high. Minuette wave (i) subdivides as a leading contracting diagonal. Second wave corrections following leading diagonals in first wave positions are commonly very deep. Minuette wave (ii) may end close to the 0.618 Fibonacci ratio of minuette wave (i) about 2,616, which is also where price may find support at the lower edge of the pink Elliott channel.
However, it is also possible at today’s low that minuette wave (ii) could be complete. Weak bullish signals from inverted VIX and the AD line today suggest upwards movement tomorrow, not downwards.
If minuette wave (ii) does move lower, then it may not move beyond the start of minuette wave (i) below 2,586.27.
ALTERNATE HOURLY CHART
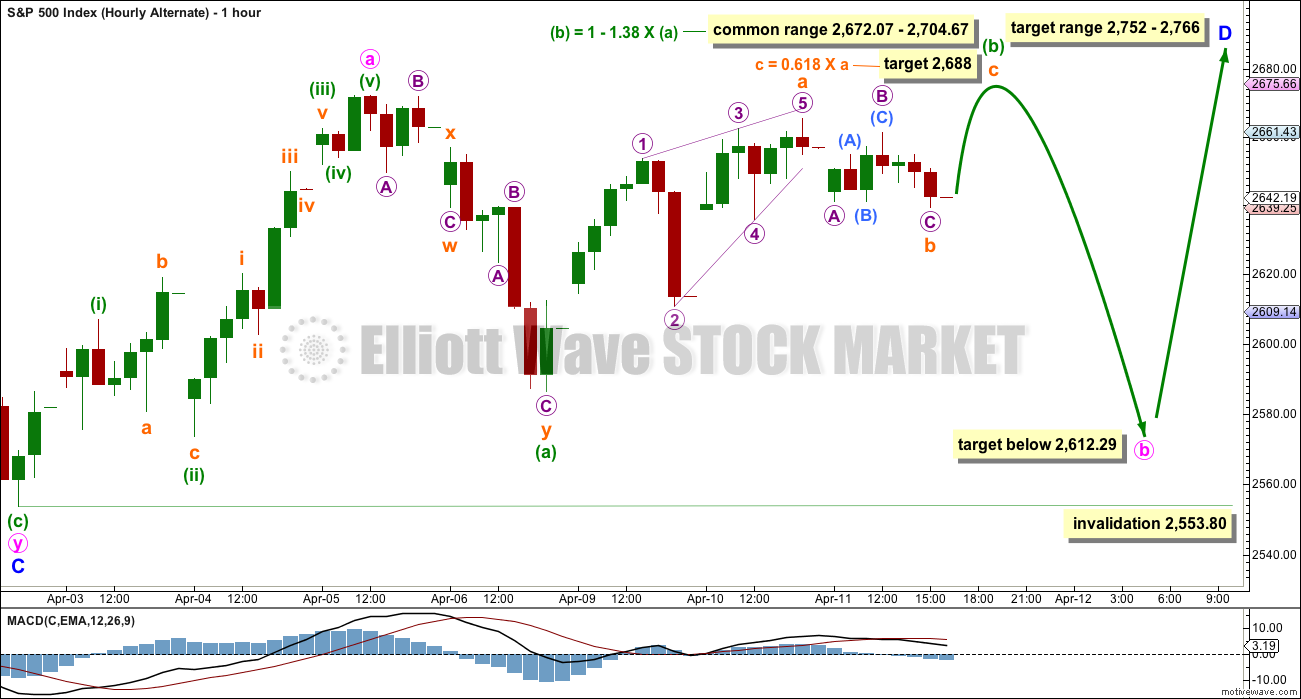
By simply moving the degree of labelling down within the last downwards wave, it is possible that minuette wave (b) may be incomplete.
If minute wave b has begun with a double zigzag downwards for minuette wave (a), then it may be either a flat or a triangle. A flat is more common, so that shall be how this chart is labelled. I have charted and considered a triangle today, but the subdivisions do not fit as well as this idea and at this stage it will not be published in this analysis.
For now let us consider the possibility of minute wave b continuing sideways in a larger range for a flat correction. Within the flat correction, minuette wave (b) has passed the minimum requirement of 0.9 the length of minuette wave (a). The common range for minuette wave (b) would be from 1 to 1.38 times the length of minuette wave (a). The target calculated today would see it end within this range.
Minute wave b may not move beyond the start of minute wave a below 2,553.80.
DAILY CHART – COMBINATION
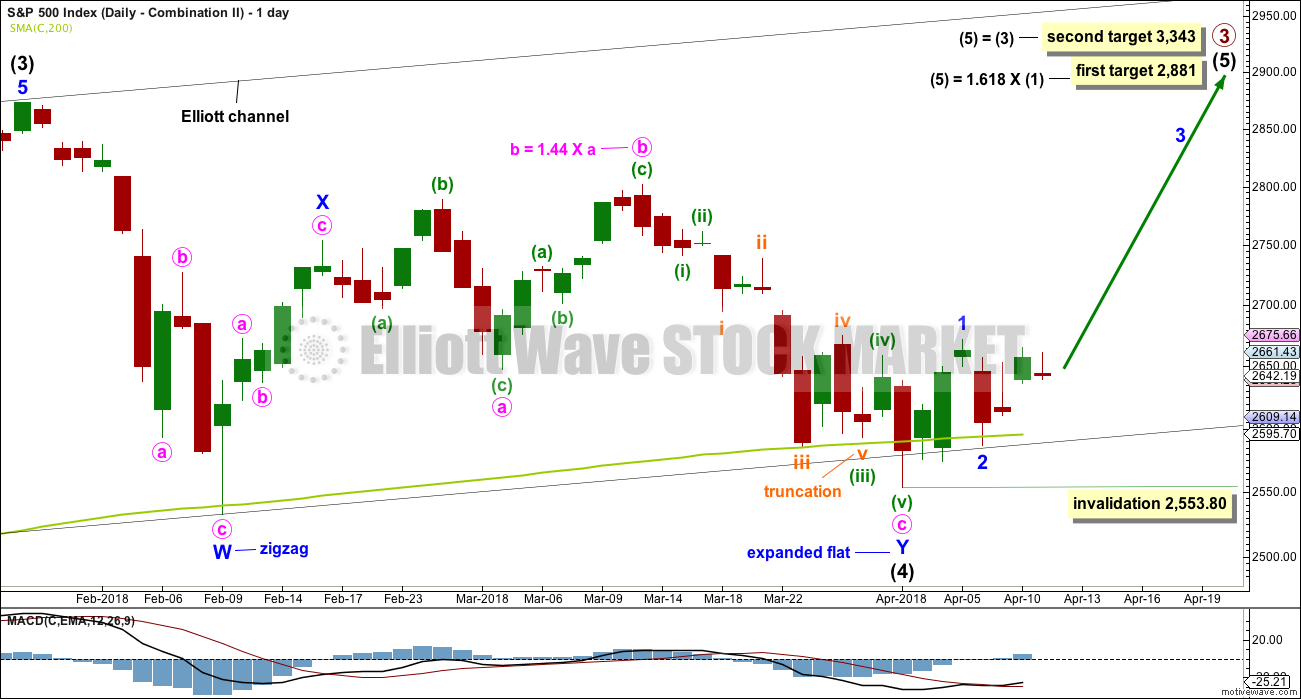
Double combinations are very common structures. The first structure in a possible double combination for intermediate wave (4) would be a complete zigzag labelled minor wave W. The double should be joined by a three in the opposite direction labelled minor wave X, which may be a complete zigzag. X waves within combinations are typically very deep; if minor wave X is over at the last high, then it would be a 0.79 length of minor wave W, which is fairly deep giving it a normal look. There is no minimum nor maximum requirement for X waves within combinations.
The second structure in the double would most likely be a flat correction labelled minor wave Y. It may also be a triangle, but in my experience this is very rare, so it will not be expected. The much more common flat for minor wave Y will be charted and expected.
A flat correction would subdivide 3-3-5. Minute wave a must be a three wave structure, most likely a zigzag. It may also be a double zigzag. On the hourly chart, this is now how this downwards movement fits best, and this will now be how it is labelled.
Minute wave b must now reach a minimum 0.90 length of minute wave a. Minute wave b must be a corrective structure. It may be any corrective structure. It may be unfolding as an expanded flat correction. A target is calculated for it to end. Within minuette wave (c), the correction for subminuette wave ii may not move beyond the start of subminuette wave i below 2,553.80.
The purpose of combinations is to take up time and move price sideways. To achieve this purpose the second structure in the double usually ends close to the same level as the first. Minor wave Y would be expected to end about the same level as minor wave W at 2,532.69. This would require a strong overshoot or breach of the 200 day moving average, which looks unlikely.
DAILY CHART – COMBINATION II
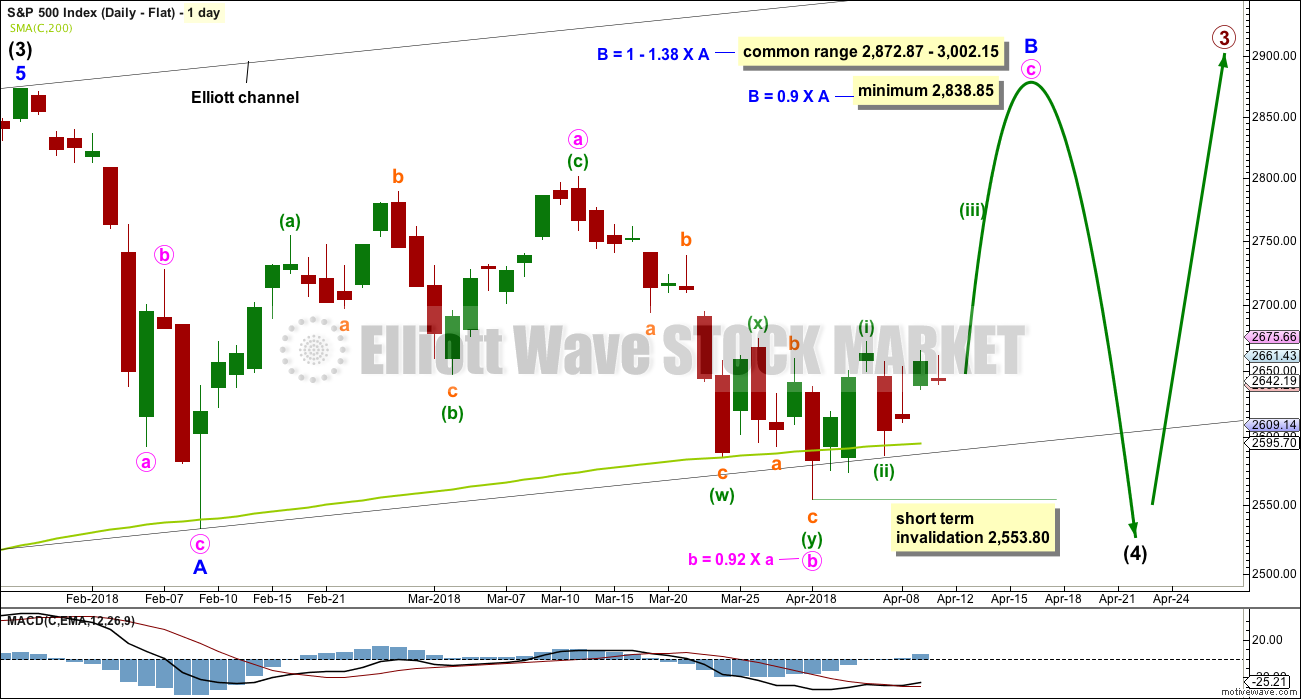
This is another way to label the combination.
Minor wave W is still a zigzag labelled in the same way, over at the first low within intermediate wave (4).
The double is joined by a quick three in the opposite direction labelled minor wave X, subdividing as a zigzag.
Minor wave Y may have begun earlier and may now be a complete expanded flat correction. However, in order to see minor wave Y complete there is a truncated fifth wave as noted on the chart. This reduces the probability of this wave count.
If intermediate wave (4) is a complete double combination, then minor wave Y has ended somewhat close to the end of minor wave W; the whole structure would have an overall sideways look to it.
A target is calculated for intermediate wave (5). Within intermediate wave (5), minor wave 2 may not move beyond the start of minor wave 1 below 2,553.80.
At the hourly chart level, this wave count would expect a five up continuing. The labelling for the short term would be the same as the hourly chart published above for the first wave count.
DAILY CHART – FLAT
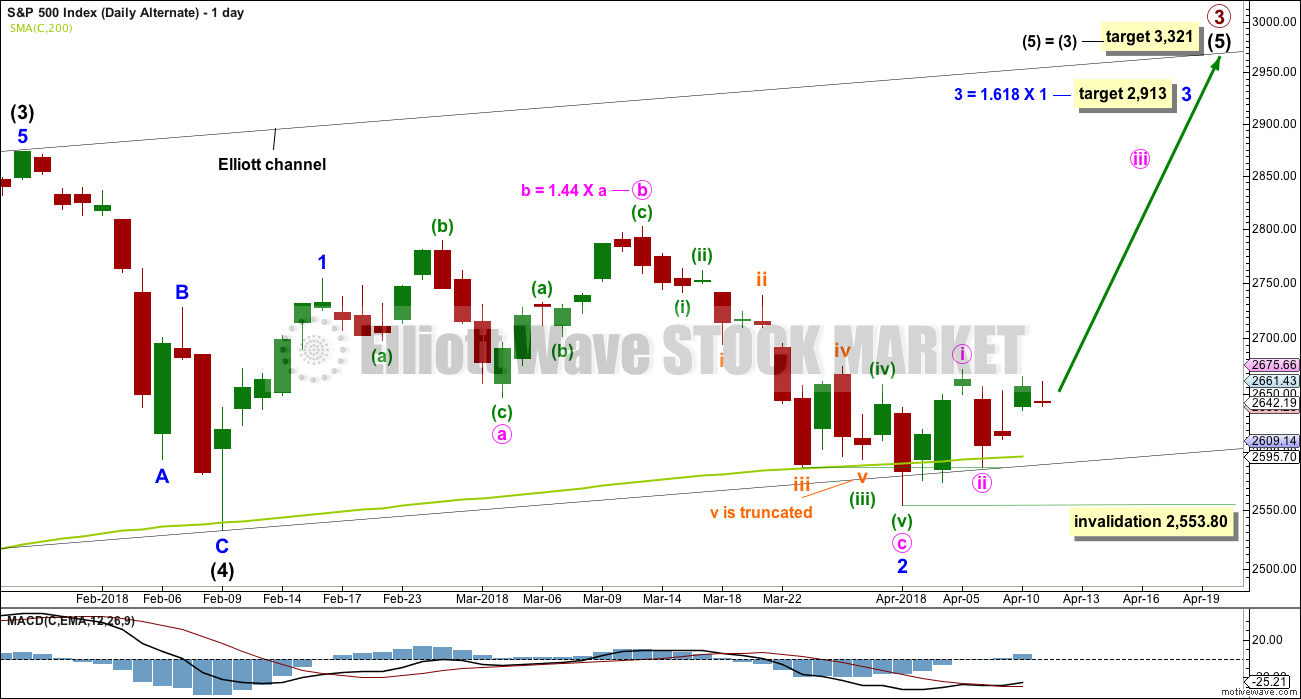
Flat corrections are very common. The most common type of flat is an expanded flat. This would see minor wave B move above the start of minor wave A at 2,872.87.
Within a flat correction, minor wave B must retrace a minimum 0.9 length of minor wave A at 2,838.85. The most common length for minor wave B within a flat correction would be 1 to 1.38 times the length of minor wave A at 2,872.87 to 3,002.15. An expanded flat would see minor wave B 1.05 times the length of minor wave A or longer, at 2,889.89 or above.
Minor wave B may be a regular flat correction, and within it minute wave a may have been a single zigzag and minute wave b may have been a double zigzag. This has a very good fit. The subdivisions at the hourly chart level at this stage would be the same for the last wave down as the main wave count.
This wave count would require a very substantial breach of the 200 day moving average for the end of intermediate wave (4). This is possible but may be less likely than a smaller breach.
DAILY CHART – ALTERNATE
It is possible still that intermediate wave (4) was complete as a relatively brief and shallow single zigzag.
A new all time high with support from volume and any one of a bullish signal from On Balance Volume or the AD line would see this alternate wave count become the main wave count.
The target for minor wave 3 expects the most common Fibonacci ratio to minor wave 1.
Within minor wave 2, there is a truncation as noted on the chart. This must necessarily reduce the probability of this wave count.
Within minor wave 3, minute wave ii may not move beyond the start minute wave i below 2,553.80.
TECHNICAL ANALYSIS
WEEKLY CHART
Click chart to enlarge. Chart courtesy of StockCharts.com.
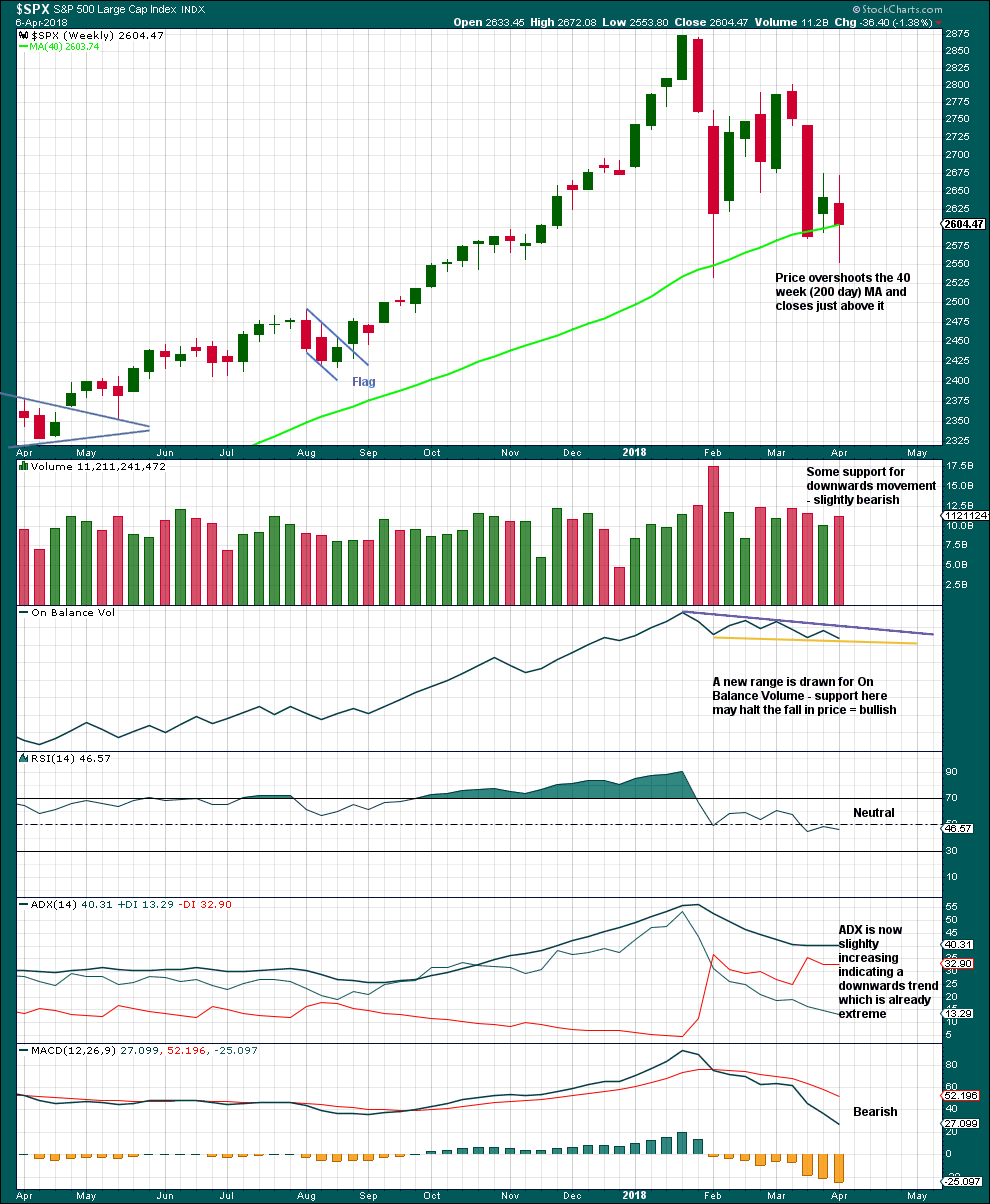
The last completed weekly candlestick has longer upper and lower wicks; it is almost a spinning top. This represents a balance of bulls and bears with the bears slightly winning. A slight increase in volume for downwards movement is only slightly bearish; volume remains lighter than the last two prior downwards movement, so overall volume is declining.
Another downwards week would provide a bearish signal from On Balance Volume. An upwards week would provide a bullish signal. Expect support here until it gives way.
The trend on ADX is extreme because the ADX line is above both directional lines.
DAILY CHART
Click chart to enlarge. Chart courtesy of StockCharts.com.
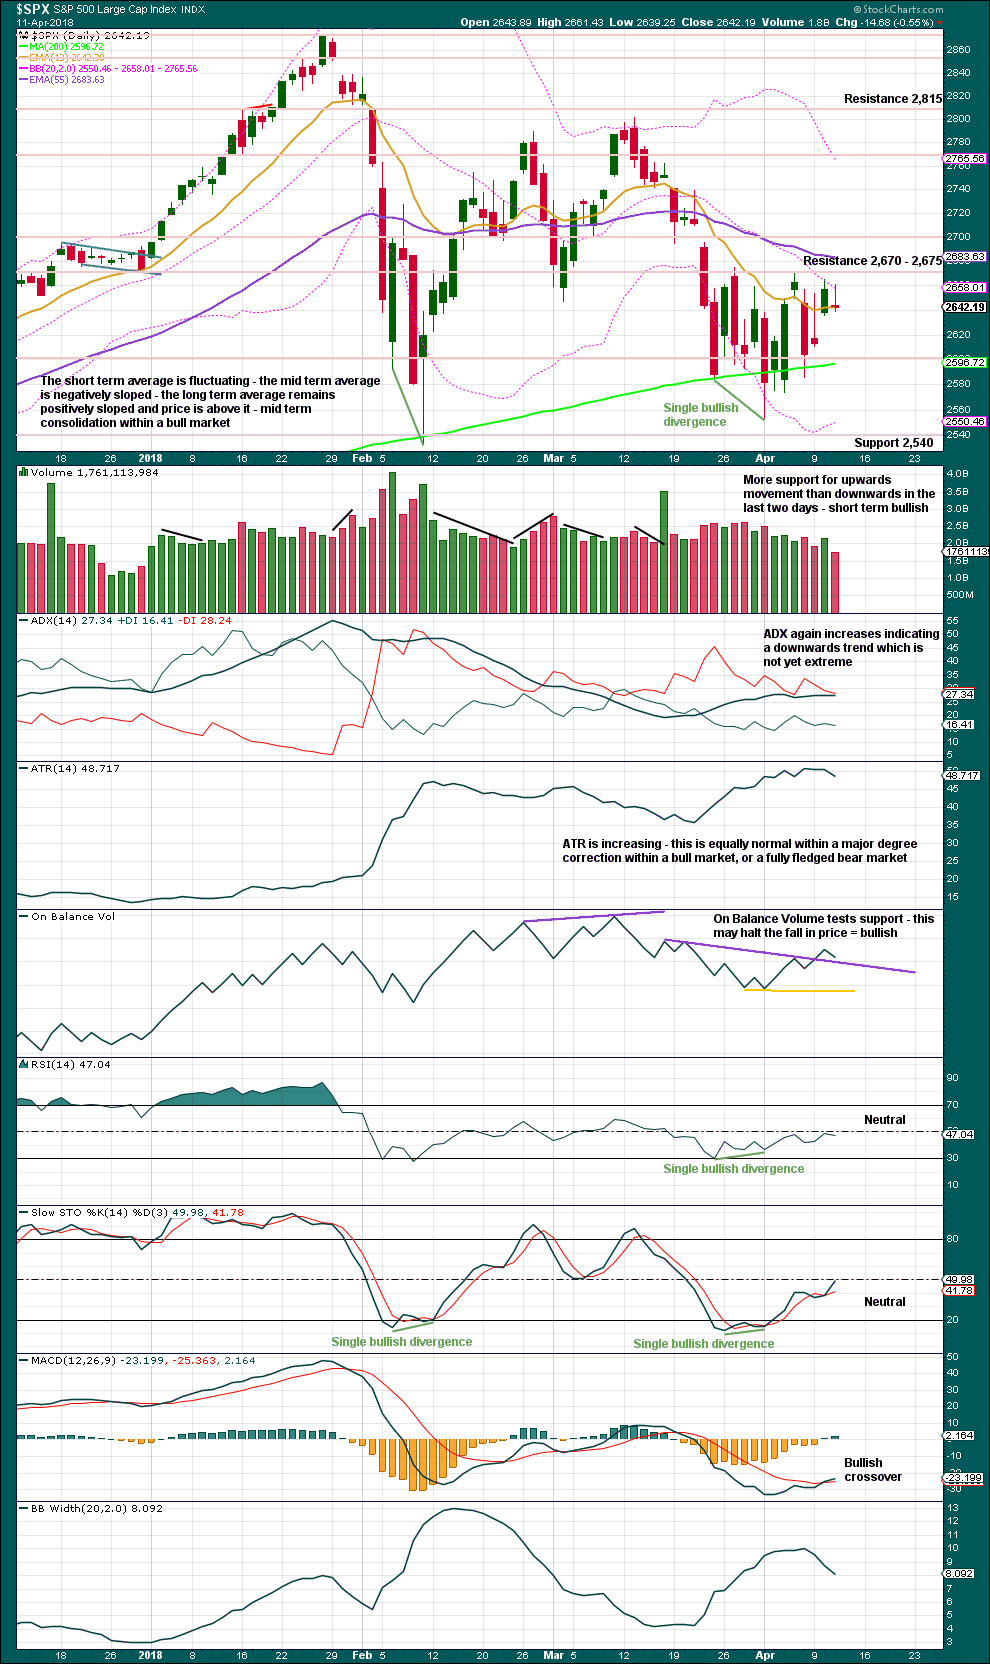
Today completes an inside day that closes red, which has a long upper wick, and the balance of volume was downwards. A decline in volume today does not support downwards movement during the session, so this is short term bullish.
If On Balance Volume provides support here, then tomorrow may see an upwards day. Support here is not strong; this purple line does not have strong technical significance.
There is still strong resistance to overcome about 2,670 – 2,675 before price can be released to move higher.
VOLATILITY – INVERTED VIX CHART
Click chart to enlarge. Chart courtesy of StockCharts.com.
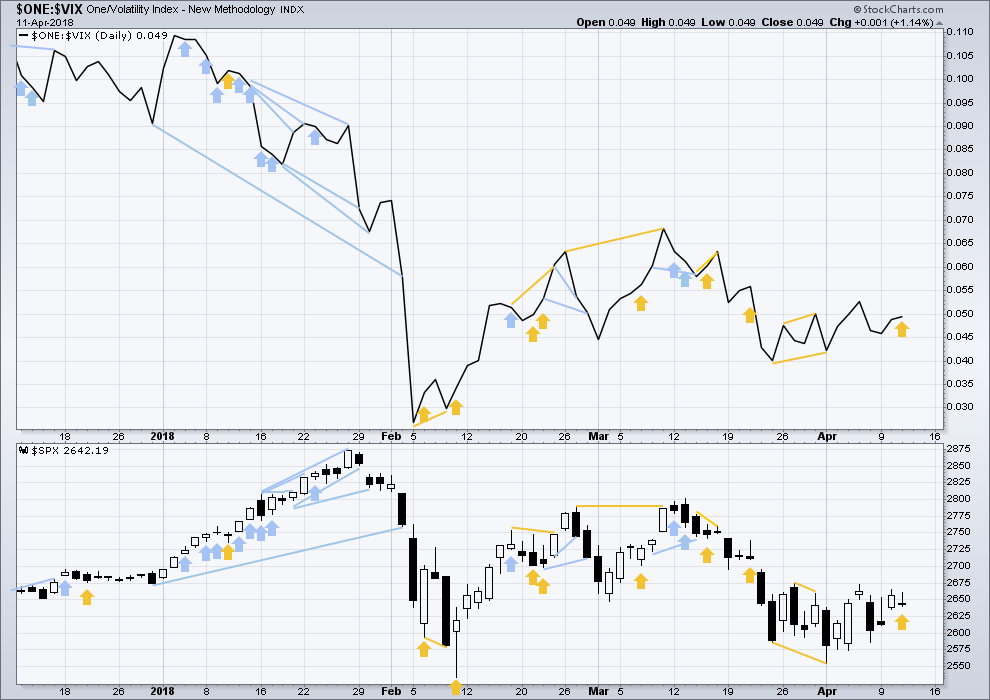
So that colour blind members are included, bearish signals will be noted with blue and bullish signals with yellow.
Normally, volatility should decline as price moves higher and increase as price moves lower. This means that normally inverted VIX should move in the same direction as price.
Price moved lower during the session, but inverted VIX moved higher. This divergence is bullish and suggests an upwards day tomorrow.
BREADTH – AD LINE
Click chart to enlarge. Chart courtesy of StockCharts.com.
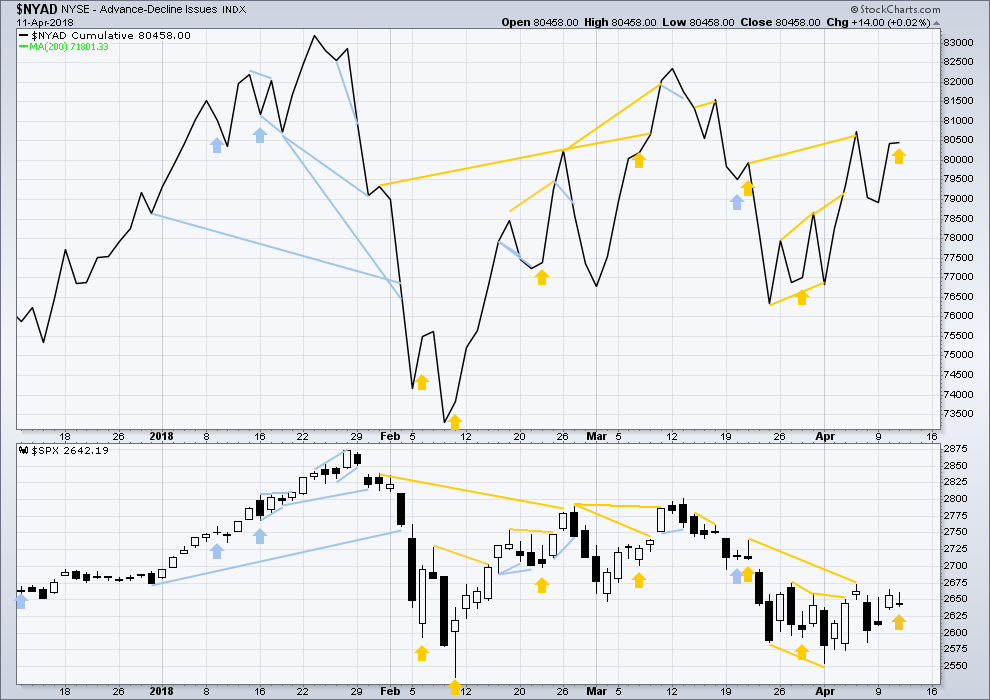
There is normally 4-6 months divergence between price and market breadth prior to a full fledged bear market. This has been so for all major bear markets within the last 90 odd years. With no longer term divergence yet at this point, any decline in price should be expected to be a pullback within an ongoing bull market and not necessarily the start of a bear market.
All of small, mid and large caps last week moved lower. None have made new small swing lows, and for all the fall has been even. There is no divergence to indicate underlying weakness.
Breadth should be read as a leading indicator.
Price moved lower during the session, but the AD line moved very slightly higher. This divergence is bullish, but it is very weak.
DOW THEORY
The following lows need to be exceeded for Dow Theory to confirm the end of the bull market and a change to a bear market:
DJIA: 23,360.29.
DJT: 9,806.79.
S&P500: 2,532.69.
Nasdaq: 6,630.67.
At this stage, only DJIA has made a new major swing low. DJT also needs to make a new major swing low for Dow Theory to indicate a switch from a bull market to a bear market. For an extended Dow Theory, which includes the S&P500 and Nasdaq, these two markets also need to make new major swing lows.
Charts showing each prior major swing low used for Dow Theory may be seen at the end of this analysis here.
Published @ 09:31 p.m. EST.

JPM, WF, and Citi report earnings before market open tomorrow. With strong earning and projections, I can see how it can move the whole market higher… just something to look out for…
GS has also been grinding higher since last week. Been looking at that thanks to Kevin’s pointers… it’s probably primed for a lift off.
Lara
What is the difference between the Weekly service and what we get now please?
It’s only published once a week. It’s three markets: the S&P500, Gold and US Oil. Lowest time frame chart is daily. Text, charts and a video. No hourly charts.
You’re getting the S&P500 daily. With hourly charts, and an update here in comments.
This daily analysis is more fitted to day traders. Lara’s Weekly is designed for longer term investors, and position traders with a longer time horizon. It purposefully ignores small movements at lower time frames so that the focus is on the bigger picture.
I was up early this morning to launch Lara’s Weekly. Already a few long term members have signed up for it. I would like to most sincerely thank you for your support and confidence in my work.
I’m really excited to launch this today! It’s a very exciting day.
Lara,
Please send me details for weekly service.
As above.
You can all see examples of exactly what it is here in EWSM. Go to the home page and take a look at the posts titled “Lara’s Weekly”.
I’ve sent you an email with the details.
Lara,
I have tried to log on to sign up for the Weekly. But it keeps telling me there is no member with that email. I am going to send an email to the webmaster with this note. I want to sign up with an annual or semi-annual renewal basis. Send me a note / email giving me some instructions please.
Thanks.
Cesar’s looking into it now.
I don’t have a six monthly or annual sub for it yet.
When I do it will probably be the same kind of deal that the six monthly sub for the S&P analysis has; pay for five months, get six, at the regular sub rate.
Which would still not be as good as the Grandfather rate of only $20 per month. It works out at $33.33 per month.
Anyhow, we’ll have you sorted if you want to get the $20 rate. Cesar will fix it.
Any update on gold tonight?
Done just now Nick.
Target remains the same.
Hourly chart updated:
If this count is correct then the middle of a third wave up (small) is just ahead. A short sharp upwards thrust?
The target looks inadequate.
Alternate hourly updated:
If this count is correct then the S&P may be in for a C wave down. C waves can be strong.
So… price is coiling. Either a sharp upwards move, or a strong pullback, may be in the wings.
Let us see how this session closes and if there are any signals today from OBV or the AD line.
Any concern about the time proportionality of the circle a vs. the circle b in the latter chart? Does that lower probability in your view Lara?
No, not at all.
B waves can be rather time consuming.
I had a wee thought earlier this morning. Maybe I’ll make a T-shirt that says:
“I hate B waves!”
But that’s a bit negative. Maybe “I love third waves” would be better.
Front and back sides of the same T-shirt. Put me down for one when the order comes in.
There’s another problem now. With a new high as the session draws to a close, the alternate isn’t working ATM. Subinuette c of minuette (b) needs to be a five, and it looks like a three so far.
So onwards and upwards would be my expectation now.
I’m missing that wabbit. Hope he’s okay?
The (theoretical) wave 2 up in bonds (TLT) may be complete. I’ve got a sizeable amount of TBT I’ve accumulated over the last week or so, that is finally slightly in the green. I’m hopeful for an awful lot more, should a real 3 wave down get going here. And it kind of looks like it is…
I see a first bounce off the 23% retrace fibo at 2663. I’m suspicious that was an “a”, and a “c” will be taking price down to 2659 area where the 38% retrace sits. I’ll be watching carefully for a turn and buy triggers there…or lower should it keep pushing.
I want to share with folks that I tried out a few trial subscriptions with other elliott wave based analysts. Bottom line: they are weak, at best, and dangerous at worst. Overly casual analysis with errors, all the bloody time. Even an amateur like myself can see them (well, an amateur who’s learned from Lara’s level of precision for about a year now). For example (no names), a major analyst who is frequently on TV mis-counted bitcoin over the last few days, counting the bottom I cited as a end of a 5 wave as the end of a 3 so no buy recommendation, because his early count was not correct (or…he didn’t consider proper alternates). We are spoiled by Lara’s comprehensive analysis, all time frames, with all significant alternatives, and all done precisely and correctly. Hard to do!!! My appreciation of her work keeps growing.
Agreed! 🙂
Well said Kevin. I have been following and learning Elliott Wave Analysis since the early 1990’s. So, like you, I have seen the work of many. I have been with Lara for over six years now. I have stayed because of the things you mention and more. For instance, her knowledge or ‘real’ trading and involvement with commodities adds a whole new dimension to her analysis. Lara is down to earth and practical in her analysis and commentary. And no where else is there a forum where the proprietor participates regularly as well as answering all questions.
There is a lot of value at EWSM. I enjoy getting to know all the subscribers who comment here as well.
Oh my goodness! What a lovely thing to wake up to. I’m humbled.
Thank you for your kind words guys. It makes me want to work even harder for you all.
Thank you!
A WAR going on in the 2666-2675 range, multiple prior swing highs, and two (at least) major fibo’s, a 62% at 2666.6 and a 50% at 2675. With price stuck right in the middle. Pushing up and through will drive me to pounding the buy button on a lot of issues fast, as my first order guess is a lot of pent up energy from the consolidation zone will be expended quickly in a rapid buying spree.
Please look a money flow indicators; smart money/institutional/pension/hedge funds, whatever you want to call them, have been liquidating longs with ferocity on the rallies since Jan. In fact, many of my models show the YTD peak yesterday. IMHO the central banks are holding it up to let folks out, and the big money folks will not immediately buy until a much better entry point.
I’ve been thinking the “smart money is getting out on every rally” thought for a week or two now myself Chris. And I still think the ultimate low of this big 4 is gonna be around 2466…where “A” = “C” and the channel I showed yesterday is fulfilled. I continue to think we’ll get more up before the big sell off, it’s only right to have a “B wave” suckers rally here.
For sure!!! I just don’t think even 2400 is enough, this looks and finally feels like the opportunity is there for a decline of supercycle degree. The story appears to writing itself and following history.
I’ll politely disagree there, not that it pragmatically matters to me. My current understanding is that epic cyclic market collapses follows about an 18 year cycle, driven by the land value cycle, and as land values fall, the collapse of the credit bubble as interest rates jack up. Not until 2025+ most likely (though there is an example of a 12 year cycle). We’ve got a long ways to go. That said, a “part way” recession that is not driven by falling land values is very, very common, and that’s coming due in the next 1-3 years. The market discounts 9-12 months into the future…
Gotta always play both sides, and a cyclical bear market of 25-35% down to the 2260ish pivot would set up another sustained 1-3yr run, and that is my bull case. That being said, credit/debt markets are poised to explode and the amount of liquidity and wealth destruction required to actually correct those markets likely causes a much deeper recession and a larger degree bear market. Also, the K-Wave cycle was due to peak in 2017.
So many counts and alternates. So many possibilities and complexities. This is what makes 4th waves. Sitting on hands and waiting patiently. Have good day all.
No comments from anyone this morning!
:-/
Kevin, that was a great call on bitcoin yesterday. Today it has started moving higher!
Anyone willing to short SPX on this move higher today?
Thanks Ari, we’ll see if it works out. I have a small position. I might add if things progress well. Only looking for 20-40% profit, lol!!!
As for shorting…if and only if it looks like a turn at a key spot, and gives strong sell signals. Then I will short. Certainly the resistance overhead will qualify as a key spot!! But I do expect it even in a “push through” scenario to have to do multiple jabs, and I don’t want to short the little pullbacks in between. So…only on strong sell triggers.
Oh wow, you meant bitcoin was REALLY up! I just took 1/2…going for that 20-40% with the second half now.
Yeah at it’s high it was up 18%. I’m not in any cryotos, but your buy signals yesterday were correct. I hear a lot about etherium fans though…
Just in case folks don’t know, bitcoin is easily tradable through the ETF (or ETN) called GBTC. All the value of a real security, and all the price movement of the underlying. The drawback? For $1, you get about 15 cents worth of bitcoin. So it’s definitely not the place to “buy bitcoins” to put into your safe deposit box if you will. But for short term trading and accessing the bitcoin market and volatility and leverage, it’s works just fine for me.
Thanks Kevin. I didn’t know about that…
Bitcoin…. the people’s money!
LMAO here!!! Hey, “I only trade it…”, and even then, very very judiciously. Bitcoin reveals to us the true nature of all our money…it’s only worth what we believe it is!! Fiat currency resting on the surface of a fast expanding credit bubble. Again, I suggest “The Secret Life of Banking and Real Estate” as a great text on how money/land value/credit/banking work, through the eyes of American history. Fascinating stuff.
Thanks for the suggestion. Cesar has just bought a copy the other day, on it’s way to us now from the USA.