Upwards movement was expected. An inside day is not conclusive either way with no new high nor low.
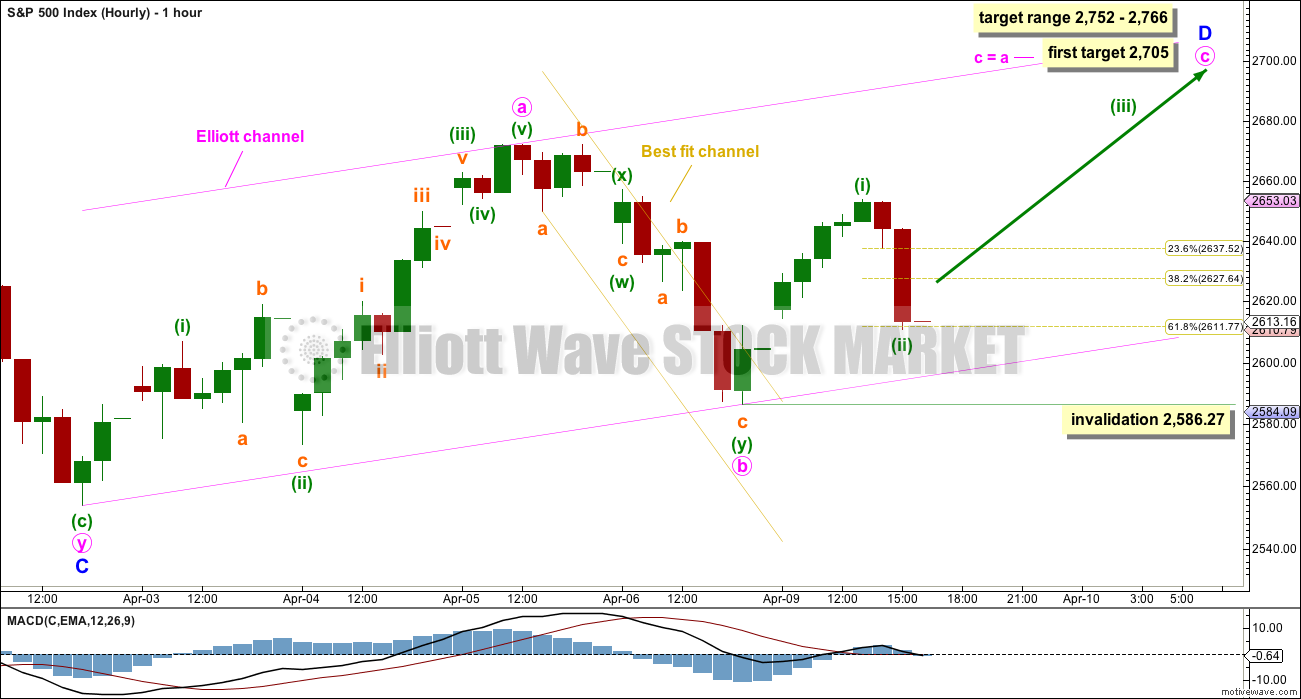
Summary: The upwards swing should continue. The first target is at 2,705. If price keeps rising through the first target, then the next target is a zone from 2,752 to 2,766.
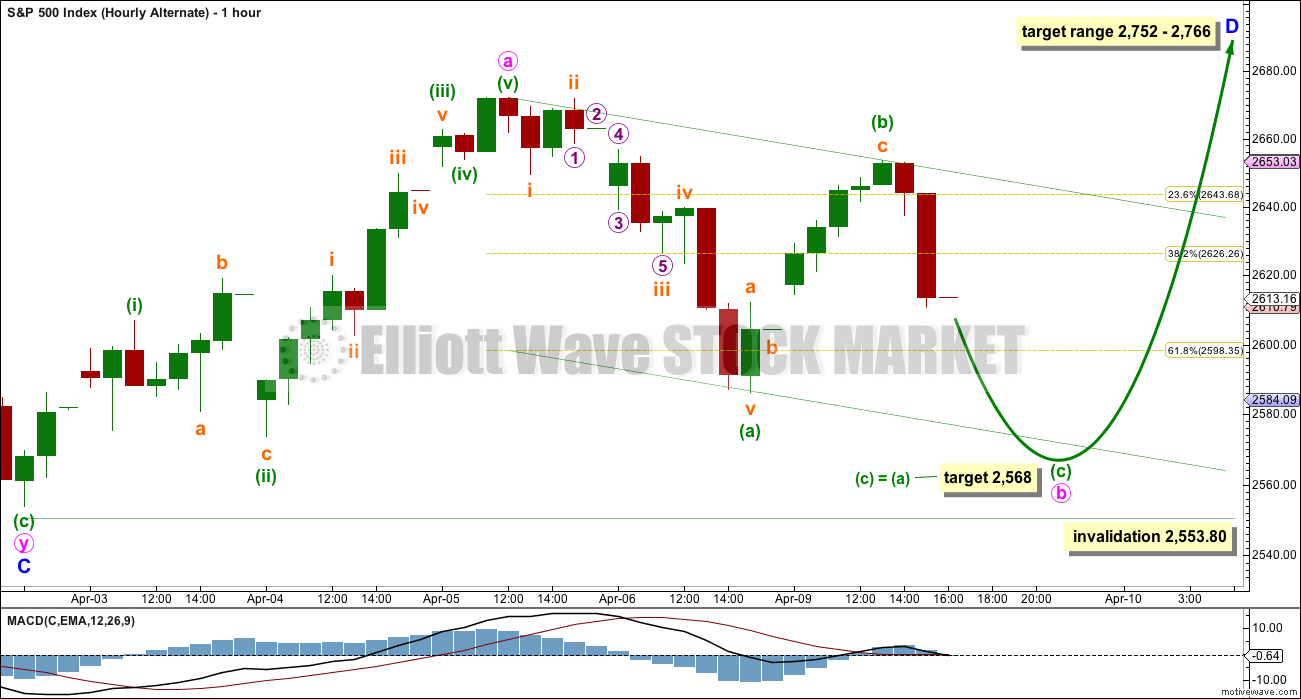
If price makes a new low tomorrow below 2,586.27, then expect a pullback may end about 2,568.
Always practice good risk management. Always trade with stops and invest only 1-5% of equity on any one trade.
New updates to this analysis are in bold.
The biggest picture, Grand Super Cycle analysis, is here.
Last historic analysis with monthly charts is here. Video is here.
An alternate idea at the monthly chart level is given here at the end of this analysis.
An historic example of a cycle degree fifth wave is given at the end of the analysis here.
MAIN ELLIOTT WAVE COUNT
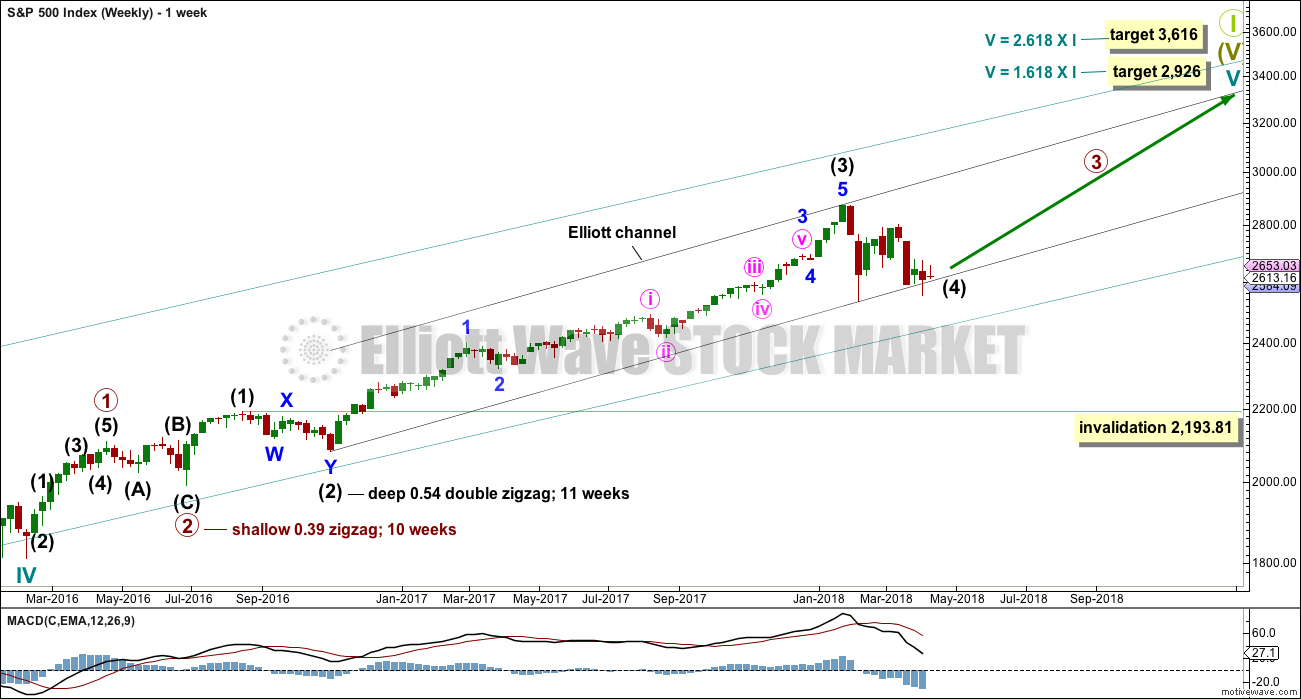
WEEKLY CHART
Cycle wave V must complete as a five structure, which should look clear at the weekly chart level. It may only be an impulse or ending diagonal. At this stage, it is clear it is an impulse.
Within cycle wave V, the third waves at all degrees may only subdivide as impulses.
Intermediate wave (4) has breached an Elliott channel drawn using Elliott’s first technique. The channel is redrawn using Elliott’s second technique as if intermediate wave (4) was over at the first swing low within it. If intermediate wave (4) continues sideways, then the channel may be redrawn when it is over. The upper edge may provide resistance for intermediate wave (5).
Intermediate wave (4) may not move into intermediate wave (1) price territory below 2,193.81. However, it would be extremely likely to remain within the wider teal channel (copied over from the monthly chart) if it were to be reasonably deep. This channel contains the entire bull market since the low in March 2009, with only two small overshoots at the end of cycle wave IV. If this channel is breached, then the idea of cycle wave V continuing higher would be discarded well before the invalidation point is breached.
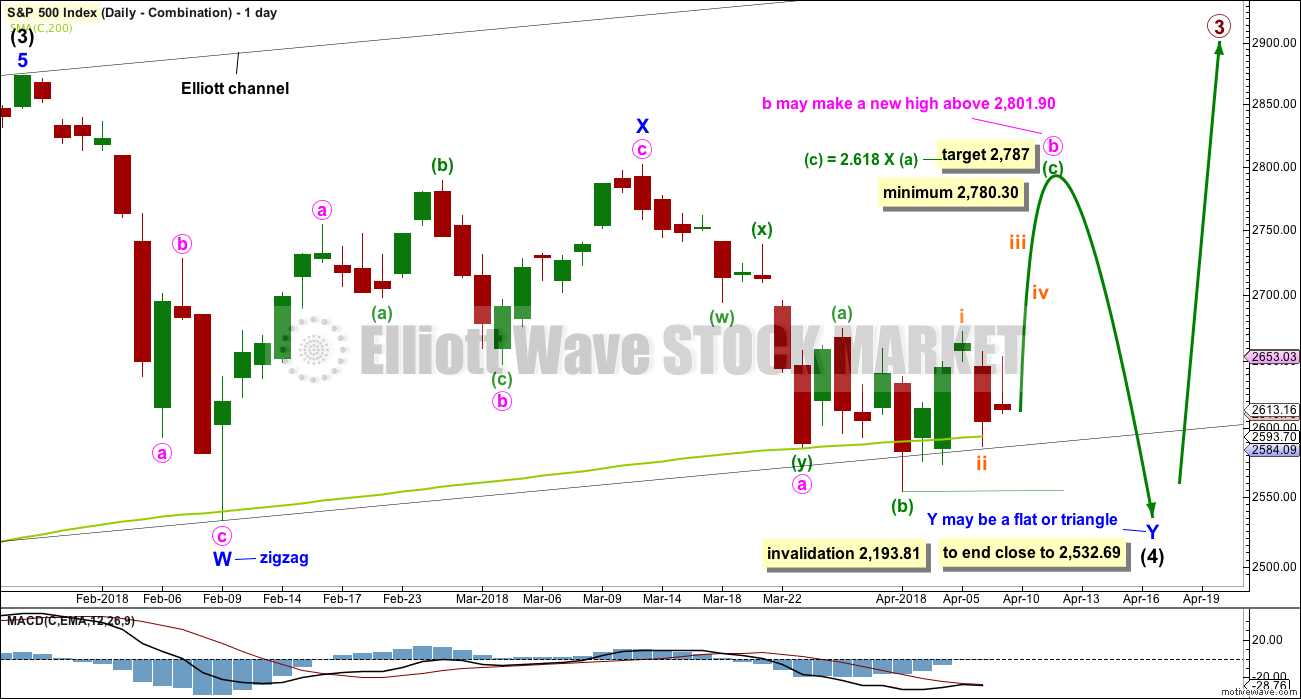
At this stage, it now looks like intermediate wave (4) may be continuing further sideways as a combination, triangle or flat. These three ideas are separated into separate daily charts. All three ideas would see intermediate wave (4) exhibit alternation in structure with the double zigzag of intermediate wave (2).
A double zigzag would also be possible for intermediate wave (4), but because intermediate wave (2) was a double zigzag this is the least likely structure for intermediate wave (4) to be. Alternation should be expected until price proves otherwise.
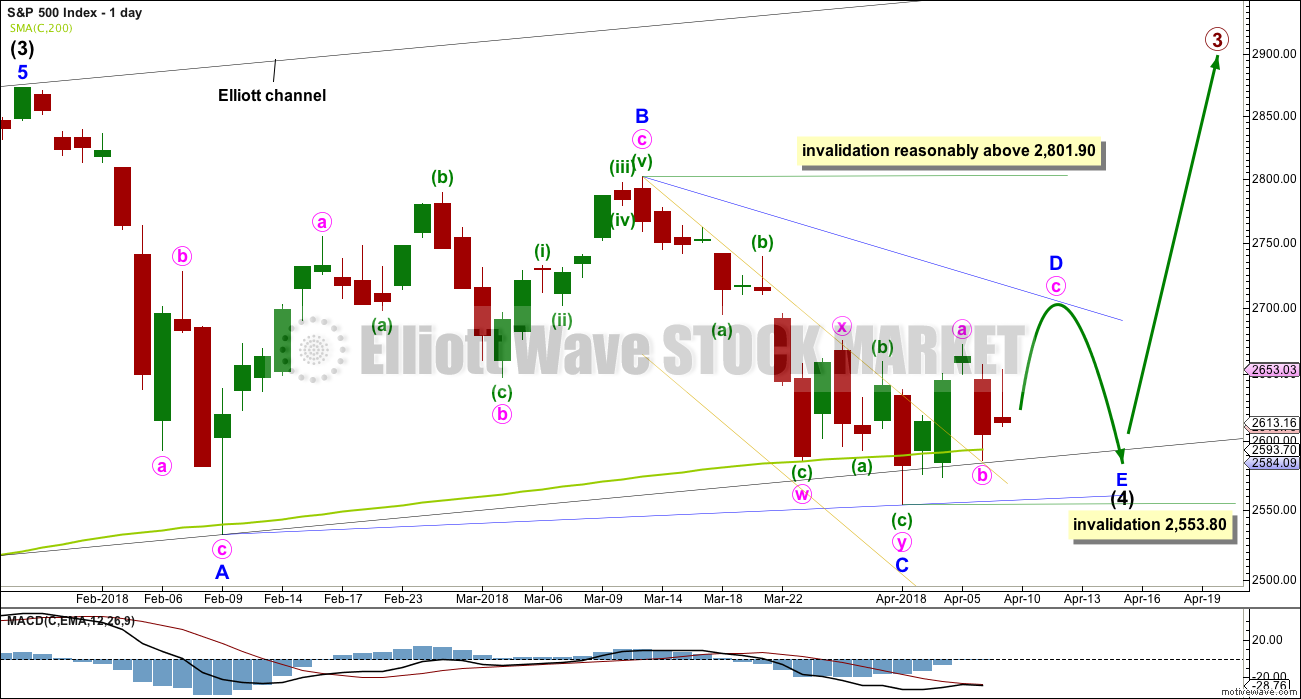
DAILY CHART – TRIANGLE
This first daily chart looks at a triangle structure for intermediate wave (4). The triangle may be either a regular contracting or regular barrier triangle. Within the triangle, minor waves A, B and C may be complete.
If intermediate wave (4) is a regular contracting triangle, the most common type, then minor wave D may not move beyond the end of minor wave B above 2,801.90.
If intermediate wave (4) is a regular barrier triangle, then minor wave D may end about the same level as minor wave B at 2,801.90. As long as the B-D trend line remains essentially flat a triangle will remain valid. In practice, this means the minor wave D can end slightly above 2,801.90 as this rule is subjective.
When a zigzag upwards for minor wave D is complete, then this wave count would expect a final smaller zigzag downwards for minor wave E, which would most likely fall reasonably short of the A-C trend line.
If this all takes a further three weeks to complete, then intermediate wave (4) may total a Fibonacci 13 weeks and would be just two weeks longer in duration than intermediate wave (2). There would be very good proportion between intermediate waves (2) and (4), which would give the wave count the right look.
There are now a few overshoots of the 200 day moving average. This is entirely acceptable for this wave count; the overshoots do not mean price must now continue lower. The A-C trend line for this wave count should have a slope, so minor wave C should now be over.
Within the zigzag of minor wave D, minute wave b may not move beyond the start of minute wave a below 2,553.80.
HOURLY CHART
Minor wave D upwards should subdivide as a zigzag. Within the zigzag, minute wave b now shows up on the daily chart as a large red daily candlestick. This would give minor wave D an obvious three wave look on the daily chart, which should be expected.
Minute wave b subdivides as a completed double zigzag. The most common Fibonacci ratio is used to calculate a target for minute wave c. This would see minor wave D shorter than the common length of 0.80 to 0.85 the length of minor wave C.
Minute wave c must subdivide as a five wave structure, and within it minuette wave (ii) may not move beyond the start of minuette wave (i) below 2,586.27.
Minute wave c may end about the upper edge of the pink upwards sloping Elliott channel, which is drawn about the zigzag of minor wave D.
When upwards movement breaches the upper edge of the yellow downwards sloping best fit channel, that shall provide some confidence that minute wave b should be over and minute wave c upwards should be underway.
ALTERNATE HOURLY CHART
It is also still possible that minute wave b is incomplete as a single zigzag.
The last wave down may also be seen as a complete five wave impulse. This may have been minuette wave (a).
Minuette wave (b) may be over at today’s high. The target calculated for minuette wave (c) expects the most common Fibonacci ratio to minuette wave (a).
Minute wave b may not move beyond the start of minute wave a below 2,553.80.
DAILY CHART – COMBINATION
Double combinations are very common structures. The first structure in a possible double combination for intermediate wave (4) would be a complete zigzag labelled minor wave W. The double should be joined by a three in the opposite direction labelled minor wave X, which may be a complete zigzag. X waves within combinations are typically very deep; if minor wave X is over at the last high, then it would be a 0.79 length of minor wave W, which is fairly deep giving it a normal look. There is no minimum nor maximum requirement for X waves within combinations.
The second structure in the double would most likely be a flat correction labelled minor wave Y. It may also be a triangle, but in my experience this is very rare, so it will not be expected. The much more common flat for minor wave Y will be charted and expected.
A flat correction would subdivide 3-3-5. Minute wave a must be a three wave structure, most likely a zigzag. It may also be a double zigzag. On the hourly chart, this is now how this downwards movement fits best, and this will now be how it is labelled.
Minute wave b must now reach a minimum 0.90 length of minute wave a. Minute wave b must be a corrective structure. It may be any corrective structure. It may be unfolding as an expanded flat correction. A target is calculated for it to end. Within minuette wave (c), the correction for subminuette wave ii may not move beyond the start of subminuette wave i below 2,553.80.
The purpose of combinations is to take up time and move price sideways. To achieve this purpose the second structure in the double usually ends close to the same level as the first. Minor wave Y would be expected to end about the same level as minor wave W at 2,532.69. This would require a strong overshoot or breach of the 200 day moving average, which looks unlikely.
DAILY CHART – COMBINATION II
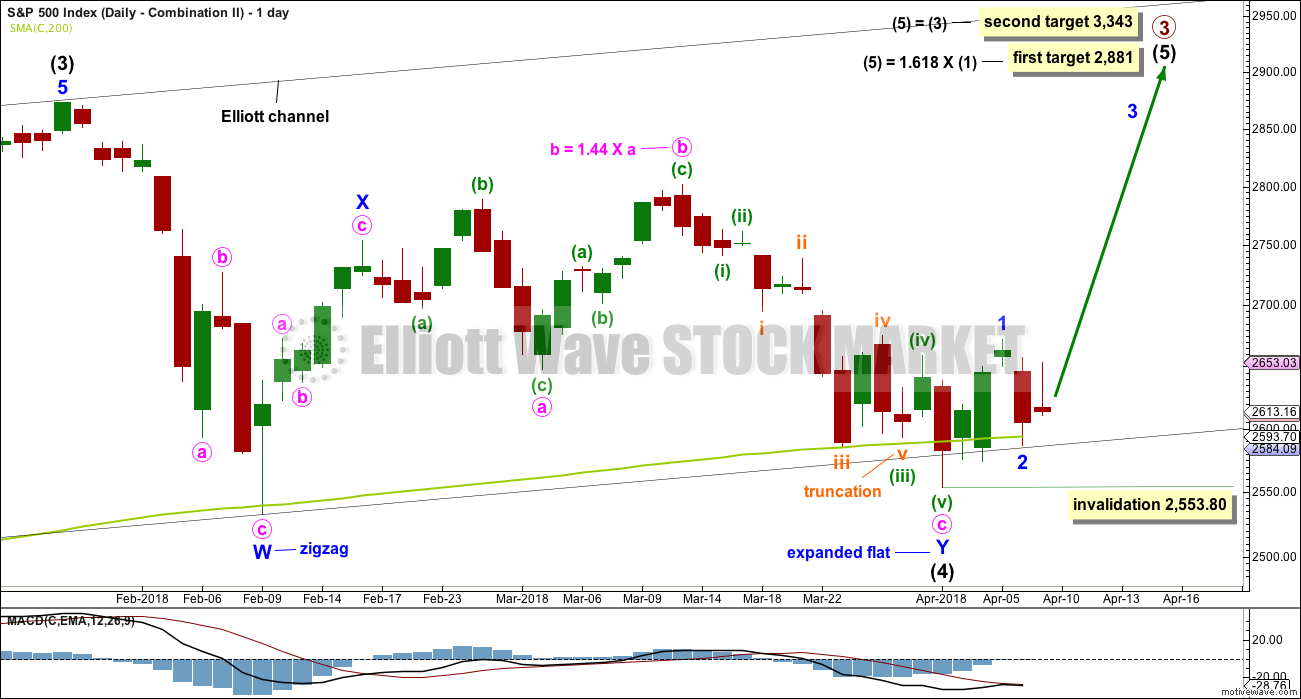
This is another way to label the combination.
Minor wave W is still a zigzag labelled in the same way, over at the first low within intermediate wave (4).
The double is joined by a quick three in the opposite direction labelled minor wave X, subdividing as a zigzag.
Minor wave Y may have begun earlier and may now be a complete expanded flat correction. However, in order to see minor wave Y complete there is a truncated fifth wave as noted on the chart. This reduces the probability of this wave count.
If intermediate wave (4) is a complete double combination, then minor wave Y has ended somewhat close to the end of minor wave W; the whole structure would have an overall sideways look to it.
A target is calculated for intermediate wave (5). Within intermediate wave (5), minor wave 2 may not move beyond the start of minor wave 1 below 2,553.80.
At the hourly chart level, this wave count would expect a five up continuing. The labelling for the short term would be the same as the hourly chart published above for the first wave count.
DAILY CHART – FLAT
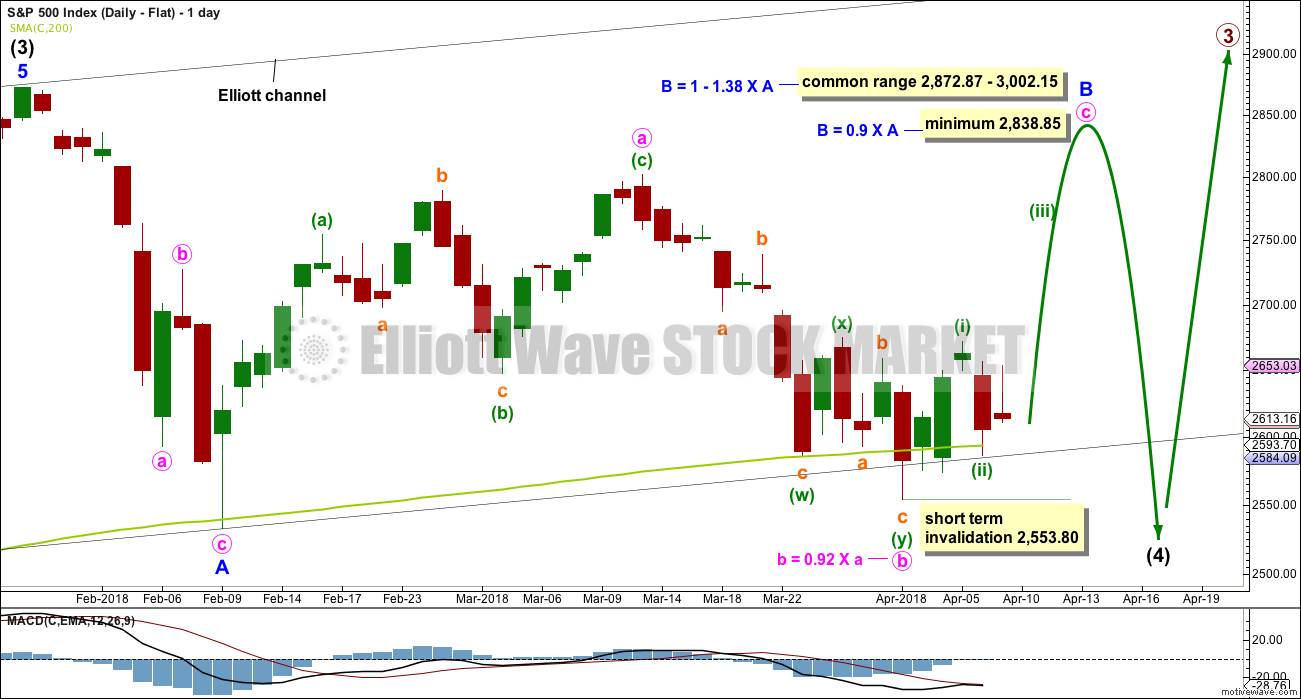
Flat corrections are very common. The most common type of flat is an expanded flat. This would see minor wave B move above the start of minor wave A at 2,872.87.
Within a flat correction, minor wave B must retrace a minimum 0.9 length of minor wave A at 2,838.85. The most common length for minor wave B within a flat correction would be 1 to 1.38 times the length of minor wave A at 2,872.87 to 3,002.15. An expanded flat would see minor wave B 1.05 times the length of minor wave A or longer, at 2,889.89 or above.
Minor wave B may be a regular flat correction, and within it minute wave a may have been a single zigzag and minute wave b may have been a double zigzag. This has a very good fit. The subdivisions at the hourly chart level at this stage would be the same for the last wave down as the main wave count.
This wave count would require a very substantial breach of the 200 day moving average for the end of intermediate wave (4). This is possible but may be less likely than a smaller breach.
DAILY CHART – ALTERNATE
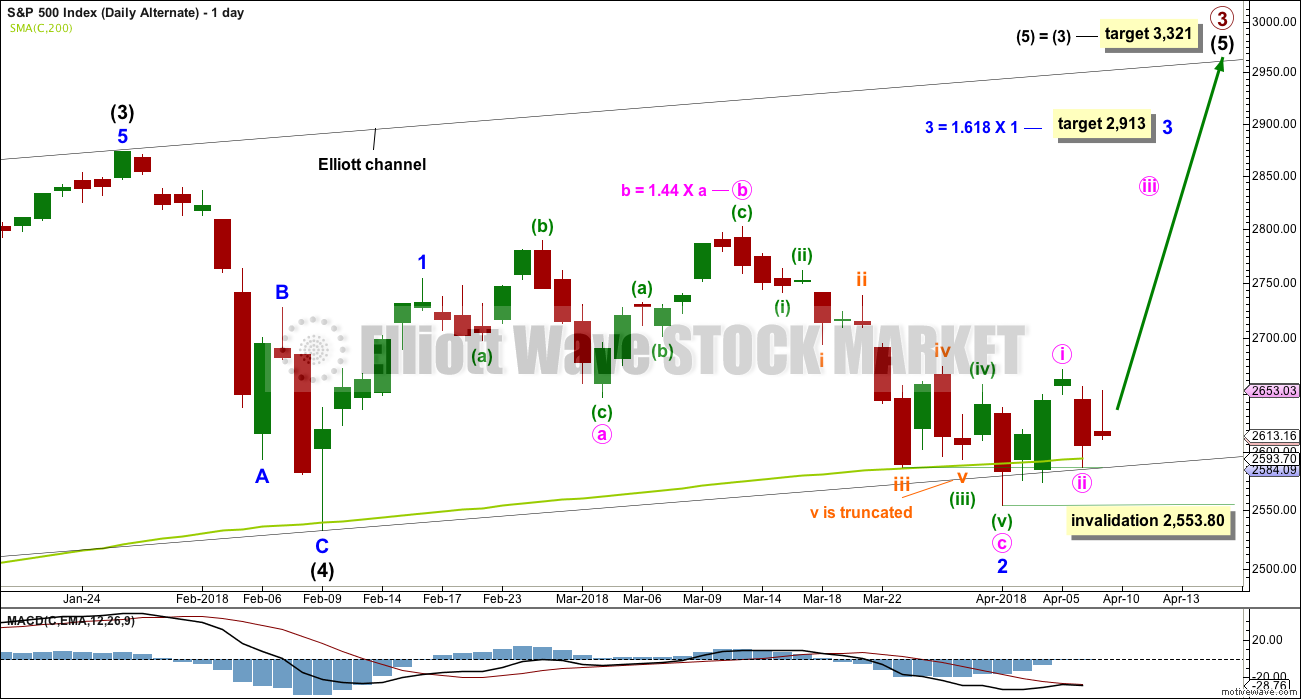
It is possible still that intermediate wave (4) was complete as a relatively brief and shallow single zigzag.
A new all time high with support from volume and any one of a bullish signal from On Balance Volume or the AD line would see this alternate wave count become the main wave count.
The target for minor wave 3 expects the most common Fibonacci ratio to minor wave 1.
Within minor wave 2, there is a truncation as noted on the chart. This must necessarily reduce the probability of this wave count.
Within minor wave 3, minute wave ii may not move beyond the start minute wave i below 2,553.80.
TECHNICAL ANALYSIS
WEEKLY CHART
Click chart to enlarge. Chart courtesy of StockCharts.com.
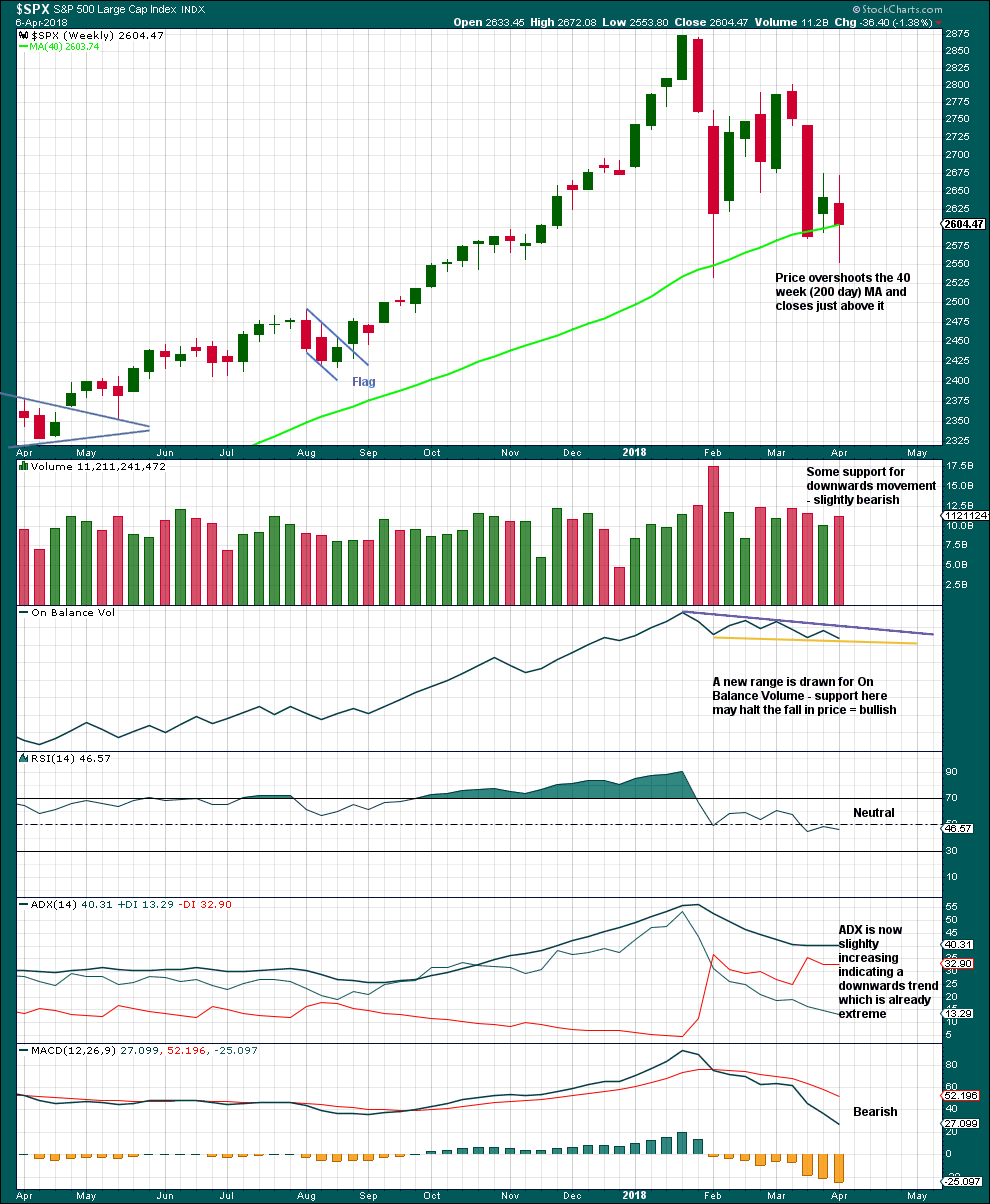
The last completed weekly candlestick has longer upper and lower wicks; it is almost a spinning top. This represents a balance of bulls and bears with the bears slightly winning. A slight increase in volume for downwards movement is only slightly bearish; volume remains lighter than the last two prior downwards movement, so overall volume is declining.
Another downwards week would provide a bearish signal from On Balance Volume. An upwards week would provide a bullish signal. Expect support here until it gives way.
The trend on ADX is extreme because the ADX line is above both directional lines.
DAILY CHART
Click chart to enlarge. Chart courtesy of StockCharts.com.
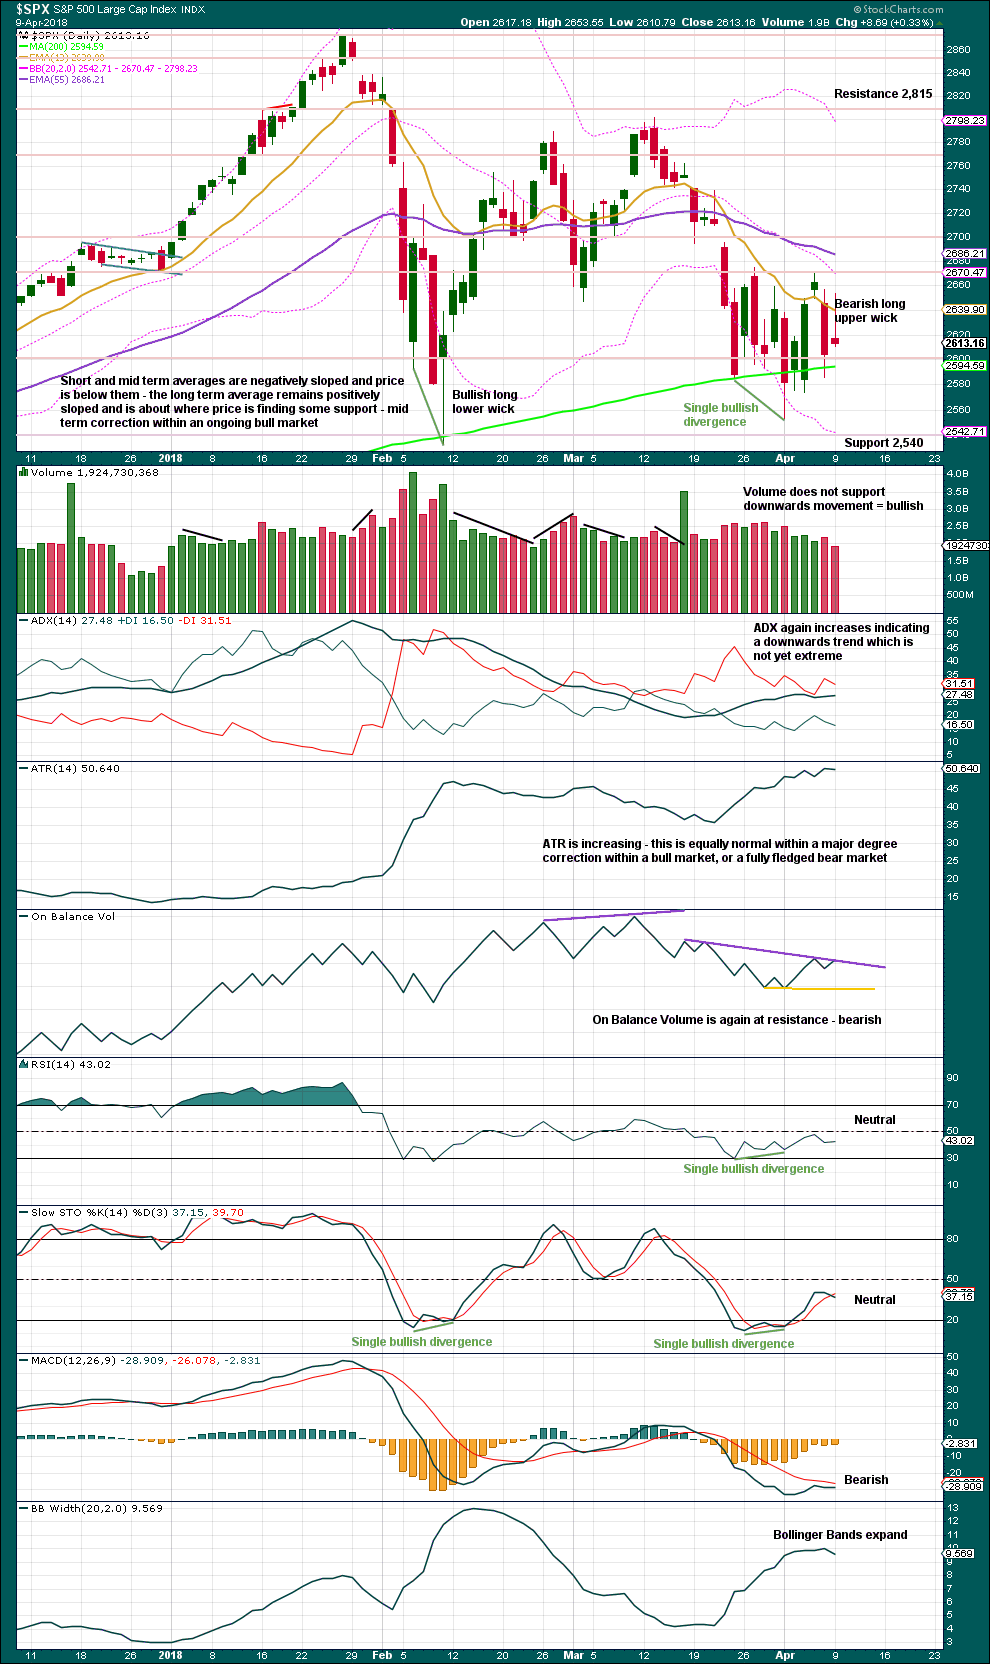
More weight will be given to the decline in volume today than the long upper candlestick wick.
Overall, this chart is bearish but not overly so. There is not enough bearish indication yet to indicate anything more than a major correction within an ongoing bull market.
VOLATILITY – INVERTED VIX CHART
Click chart to enlarge. Chart courtesy of StockCharts.com.
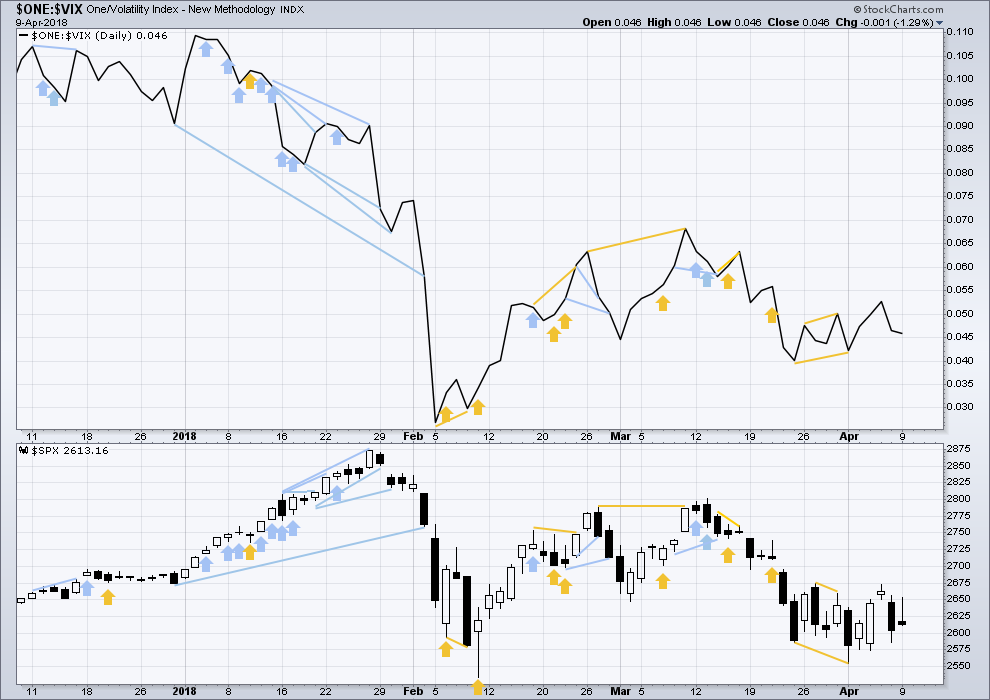
So that colour blind members are included, bearish signals will be noted with blue and bullish signals with yellow.
Normally, volatility should decline as price moves higher and increase as price moves lower. This means that normally inverted VIX should move in the same direction as price.
Price moved lower during Monday’s session, but the balance of volume was upwards. The increase in market volatility supports downwards movement during the session. This is bearish.
BREADTH – AD LINE
Click chart to enlarge. Chart courtesy of StockCharts.com.
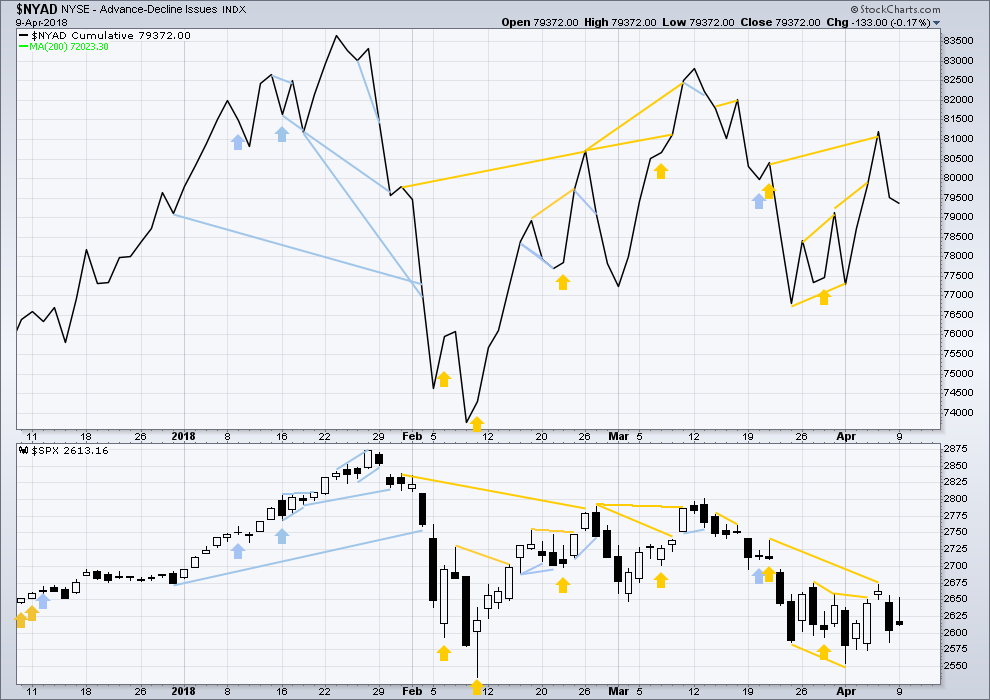
There is normally 4-6 months divergence between price and market breadth prior to a full fledged bear market. This has been so for all major bear markets within the last 90 odd years. With no longer term divergence yet at this point, any decline in price should be expected to be a pullback within an ongoing bull market and not necessarily the start of a bear market.
All of small, mid and large caps last week moved lower. None have made new small swing lows, and for all the fall has been even. There is no divergence to indicate underlying weakness.
Breadth should be read as a leading indicator.
Price moved lower during Monday’s session, but the balance of volume was upwards. A decline in market breadth supports downwards movement during the session. This is bearish.
DOW THEORY
The following lows need to be exceeded for Dow Theory to confirm the end of the bull market and a change to a bear market:
DJIA: 23,360.29.
DJT: 9,806.79.
S&P500: 2,532.69.
Nasdaq: 6,630.67.
At this stage, only DJIA has made a new major swing low. DJT also needs to make a new major swing low for Dow Theory to indicate a switch from a bull market to a bear market. For an extended Dow Theory, which includes the S&P500 and Nasdaq, these two markets also need to make new major swing lows.
Charts showing each prior major swing low used for Dow Theory may be seen at the end of this analysis here.
Published @ 12:20 a.m. EST on 10th April, 2018.

Updated hourly chart:
The main count looks best at this stage.
SPX 2660 -2680 remains formidable resistance. The failure of the bulls to successfully move above it today tell us quite a bit about what price is likely to do next. We seem to be in a consolidation zone between the 50 and 200 day SMAs ahead of a move lower. Have a great evening all!
The other side of that resistance is that should price just start to pierce it…there will be a short covering avalanche of buying. Price could move VERY quickly up to that triangle line, or beyond. Mere resistance doesn’t mean it’s not headed up. Everything I see indicates that’s what going to happen, and the return to the bottom of this resistance zone is not an indication of weakness, but of strength. Wave count and indicators tell me it’s the highest probability here. But if today’s low goes tomorrow…I’ll be short real fast!!!
I agree. The price action today has an upside bias feel to it… all downside movements bounced hard: v-shaped.
I was worried about VIX not giving in all day, but it went down hard in the last 45 minutes…
Hi Verne
You can’t expect the market to move up that much in 1 trading day.
That was a joke right?
Was that a 500 DJI point ramp or was I sadly mistaken??!
The point eric, is that they TRIED!!
Do you guys recognize a bearish rising wedge?? 🙂
Just did a wee edit of that last sentence Verne to keep it… really nice. I don’t want it to come across as…. not nice?
Agreed, there is strong resistance overhead. Today there is some support from volume which is nice to see. And we have a bullish signal from OBV, and it’s not too weak (certainly not a strong signal though).
MACD gives us a bullish crossover.
No bullish signals from the AD line nor VIX today though.
So there’s a little bullishness here. But it’s not strong.
Within a triangle I’d expect confusion, some neutrality, a balance of bulls and bears. With swings from who’s in charge as price swings. A battle if you will.
Kindof looks like a leading diagonal “1” off the low today (bounce off 50% fibo, bottom of a 2?), and now the 2 of the leading diagonal 1 is in play. Of course, last few weeks, all such bullish views are quickly dashed as the market collapses into another -1.5-2.5% down move! Lol!!!! But I don’t think so today….
Somethin’ else goin’ on… maybe effects of the Zuck show???
I’m suspecting some rippage before end of day, perhaps last 30 minutes. This market is acting strong, merely by virtue of hanging close under the resistance zone. Could change instantly though.
The setup here feels way too suspicious for me. I would have expected a much deeper reversal point before we go back to ATHs. VIX looks like it’s forming a (bull?) pennant… Could break to the downside I suppose, but like I said yesterday, these sorts of corrections don’t typically end before one final flush.
A deeper reversal point is probably coming Bo. My #1 intermediate count is the big flat. It’ll be an awesome bull trap, should it play out, and it’ll create that deeper reversal point that I agree with you, “should” be there. Right now, things still look incomplete re: the overall intermediate or primary 4.
Hourly macd and stochRSI both now flashing buy triggers (SPX and NDX both). However, this 2666-2670 zone is clearly a key pivot, and here we are stalling there yet again. Breaking though would be huuuge for the bull case.
Hi Kevin
I think 2695 – 2700 is the key resistance here.
looking at the big break away gap in the chart here.
The whole bloody zone from 2660-2700 is resistance. This is what, turn number 4 in the last 2-3 weeks out of that zone I believe. Though I continue to be suspicious that this time, price is going to go up and through before it rolls all the way bck to 2550 or lower.
Kevin
The Dow jones industrial average longterm trend line is give or take 24500 – 24600
for the past few weeks when it hits that upper line it corrects.
So that could be somewhat of a speed limit.
That line goes up like 200 points a month.
The market got way ahead of itself for some months there.
if the market holds up we can maybe make another all time high this year some folks in the elliott wave community believe the ATH is already in.
When i look at the Wilshire 5000 to GDP it really strongly suggest that and all time high is in.
Time will only tell
We will have to see if Warren Buffet indicator will hold the test of time.
As primarily a day trader grinding out bill money, honestly Eric I don’t give much thought to the longer term. Intermediate term as it reflects on the short term, yes. I’m confident the “ATH” is not in, but it doesn’t really matter to me. What matters to me is what happens in the next 3 hours, honestly. I’ve got some decent profits today but I’d definitely like a little more, and a push up here will fit the bill just right. I do believe this market “wants to rip”…oh, there it goes? Let’s seee…
I like it Kevin!! Buy dips, sell rips, short break downs……IMHO a bear has begun and none of my fund compatriots are covering any of their shorts until some kind of capitulation is seen. In fact, new NASDAQ shorts opened with ferocity today.
pretty clear ABC down, with the bottom exactly at the 50% of the recent upmove. In theory (!!!!!!) entering 3 of 3 territory (I see a big 1-2 as Lara counted and now another 1-2)…though I’ll believe it only when I see price truly starting to rock upward. This is an interesting day (again).
Agreed. That’s how I’m seeing it too, Kevin.
I’m sure folks have noticed the massive “head and shoulders” bottom structure in SPX. If it breaks above 2674…measuring rule indicates a move to 2801 or thereabouts. But probably not today, lol! I think today is likely to be a “rolling in the muck” day. Market appears to be in a very large yet ever tightening consolidation zone. I think today is NOT going to be one of the big swing days, but instead a relatively small range inside day.
I’m not seeing a massive one Kevin. I can see a small one forming, green on this chart.
For a massive inverse H&S I’m having a problem identifying a potential LHS. The neckline would be all kinds of wrong.
Futures blasting off on Xi’s conciliatory tones. I find it hard to believe we’ve already bottomed for the week, but lately the bears have shown little to no energy whatsoever. Was the selloff and bearish tape this afternoon nothing more than a hedge against Xi’s speech potentially heralding an escalation to the trade war? I thought for sure the rise in VIX, decline in breadth, divergence with RUT, etc. all looked bearish, and yet here we are with futures 40 handles higher. We could gap up 50 or more. Is tomorrow that +100 SPX point day I’ve been looking for? Or are we going to reverse and head straight back down to the 200dma? The main count and alternate both look good to me, so I have no idea. The classical technicals are more bearish, but weakly so according to Lara.
Looks like Lara’s main is holding up very well. Though “anything can happen”, given the state of the world, and the level of volatility in general. I’m grabbing little profits as and where I can, with only a few holds. But ready to pounce hard if the market starts to show real life to the upside.
I note that GLD might be finally coming alive. In theory, the extended consolidation could give a lot of energy to a bust out upward. I’m positioned for that…
You may want to look at slv calls too. Silver Large specs are short, may provide some fireworks if we bomb Assad’s homes, planes or we have a CPI number that comes out hot. It will probably move more than gold on the upside. Also silver to gold about 82 which is at the high boundary that has launched silver before. Warning: Past is not always prologue.
Thanks Jerry, I’ll keep my eye on silver too, and if it starts to go, probably add it to my small collection!
Numero uno, the benefit of living in SF on the edge of western civilization…
Hi Kevin,
I am in Berkeley. Glad to see another Bay Area member here.
I used to live in Berkeley Sundeep…oh, back in 1984, a year at UCB getting a master’s in CS. Lived on Forest, just behind the old school for the deaf. Berkeley is nice, even gives SF a run for the wackiest city award!
My wife and I went to UCB as well (B school ). Live here till 2004. Then moved to Oklahoma City where we bought a business. Sold business in 2012 and moved back to Berkeley 2016.