A pullback within an upwards swing was expected, but it arrived a day or so earlier. Price remains above the invalidation point.
Summary: The upwards swing should continue next week. The first target is at 2,705. If price keeps rising through the first target, then the next target is a zone from 2,752 to 2,766.
Always practice good risk management. Always trade with stops and invest only 1-5% of equity on any one trade.
New updates to this analysis are in bold.
The biggest picture, Grand Super Cycle analysis, is here.
Last historic analysis with monthly charts is here. Video is here.
An alternate idea at the monthly chart level is given here at the end of this analysis.
An historic example of a cycle degree fifth wave is given at the end of the analysis here.
MAIN ELLIOTT WAVE COUNT
WEEKLY CHART
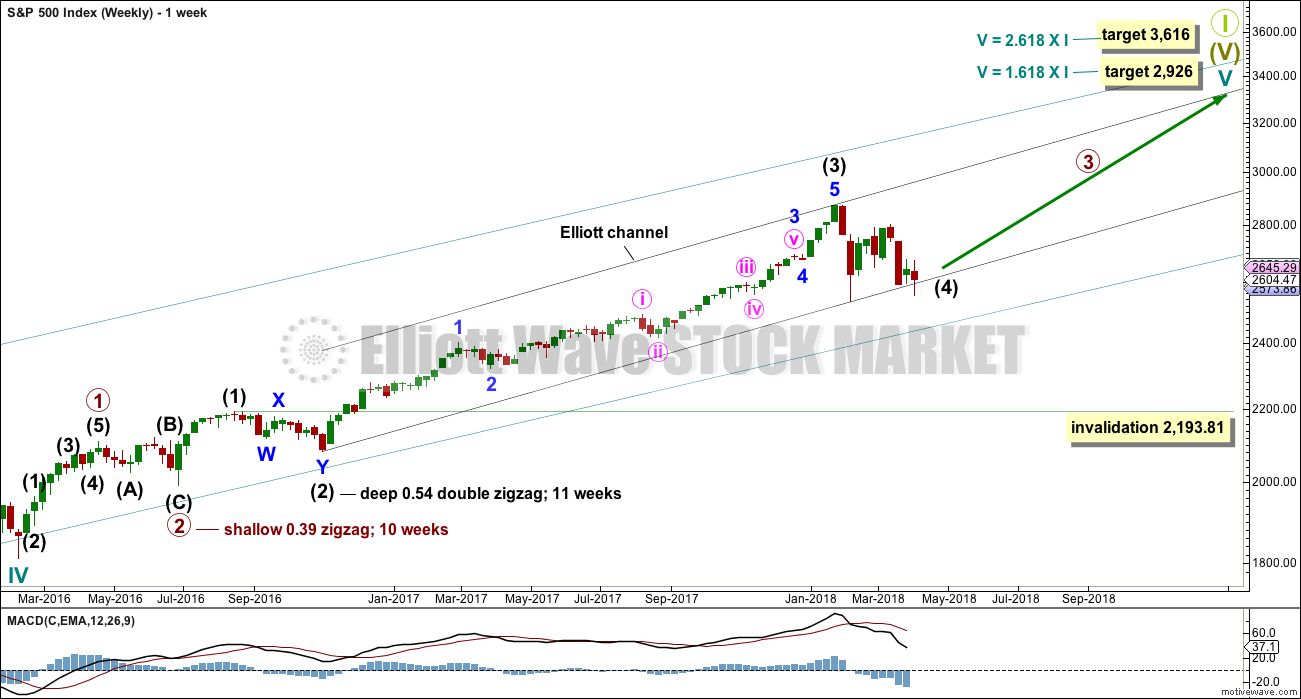
Cycle wave V must complete as a five structure, which should look clear at the weekly chart level. It may only be an impulse or ending diagonal. At this stage, it is clear it is an impulse.
Within cycle wave V, the third waves at all degrees may only subdivide as impulses.
Intermediate wave (4) has breached an Elliott channel drawn using Elliott’s first technique. The channel is redrawn using Elliott’s second technique as if intermediate wave (4) was over at the first swing low within it. If intermediate wave (4) continues sideways, then the channel may be redrawn when it is over. The upper edge may provide resistance for intermediate wave (5).
Intermediate wave (4) may not move into intermediate wave (1) price territory below 2,193.81. However, it would be extremely likely to remain within the wider teal channel (copied over from the monthly chart) if it were to be reasonably deep. This channel contains the entire bull market since the low in March 2009, with only two small overshoots at the end of cycle wave IV. If this channel is breached, then the idea of cycle wave V continuing higher would be discarded well before the invalidation point is breached.
At this stage, it now looks like intermediate wave (4) may be continuing further sideways as a combination, triangle or flat. These three ideas are separated into separate daily charts. All three ideas would see intermediate wave (4) exhibit alternation in structure with the double zigzag of intermediate wave (2).
A double zigzag would also be possible for intermediate wave (4), but because intermediate wave (2) was a double zigzag this is the least likely structure for intermediate wave (4) to be. Alternation should be expected until price proves otherwise.
DAILY CHART – TRIANGLE
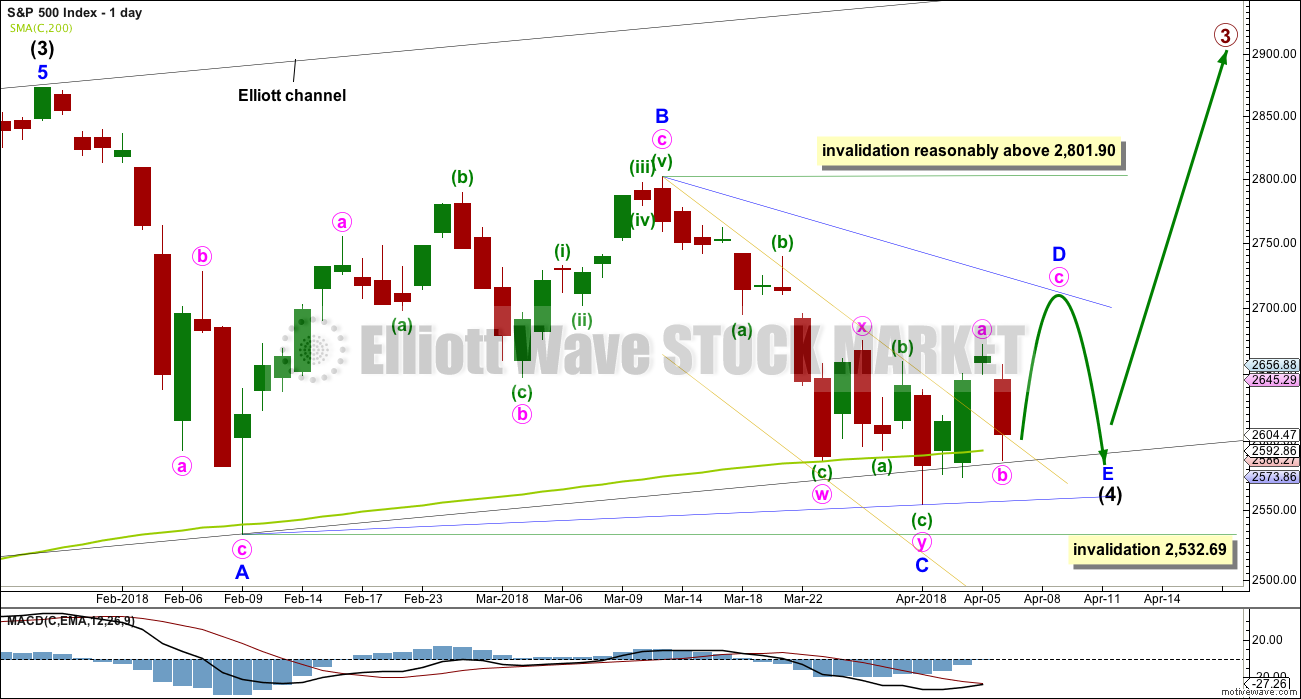
This first daily chart looks at a triangle structure for intermediate wave (4). The triangle may be either a regular contracting or regular barrier triangle. Within the triangle, minor waves A, B and C may be complete.
If intermediate wave (4) is a regular contracting triangle, the most common type, then minor wave D may not move beyond the end of minor wave B above 2,801.90.
If intermediate wave (4) is a regular barrier triangle, then minor wave D may end about the same level as minor wave B at 2,801.90. As long as the B-D trend line remains essentially flat a triangle will remain valid. In practice, this means the minor wave D can end slightly above 2,801.90 as this rule is subjective.
When a zigzag upwards for minor wave D is complete, then this wave count would expect a final smaller zigzag downwards for minor wave E, which would most likely fall reasonably short of the A-C trend line.
If this all takes a further three weeks to complete, then intermediate wave (4) may total a Fibonacci 13 weeks and would be just two weeks longer in duration than intermediate wave (2). There would be very good proportion between intermediate waves (2) and (4), which would give the wave count the right look.
There are now a few overshoots of the 200 day moving average. This is entirely acceptable for this wave count; the overshoots do not mean price must now continue lower. The A-C trend line for this wave count should have a slope, so minor wave C should now be over.
HOURLY CHART
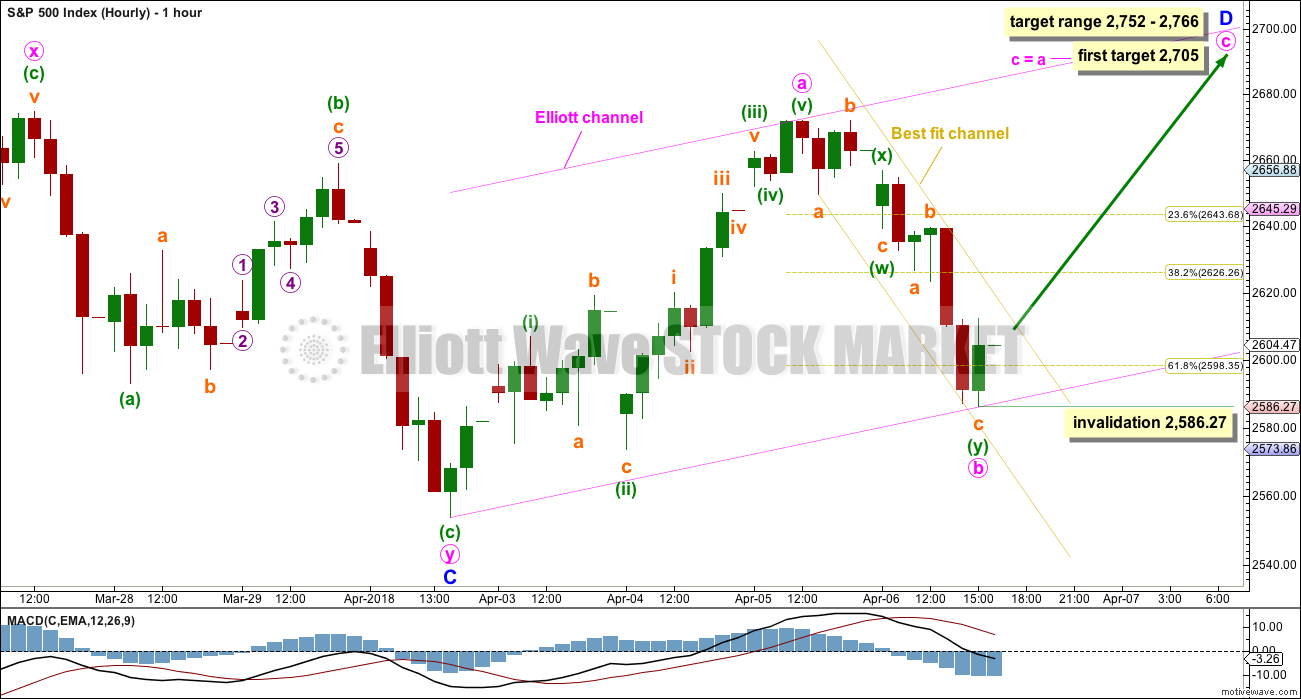
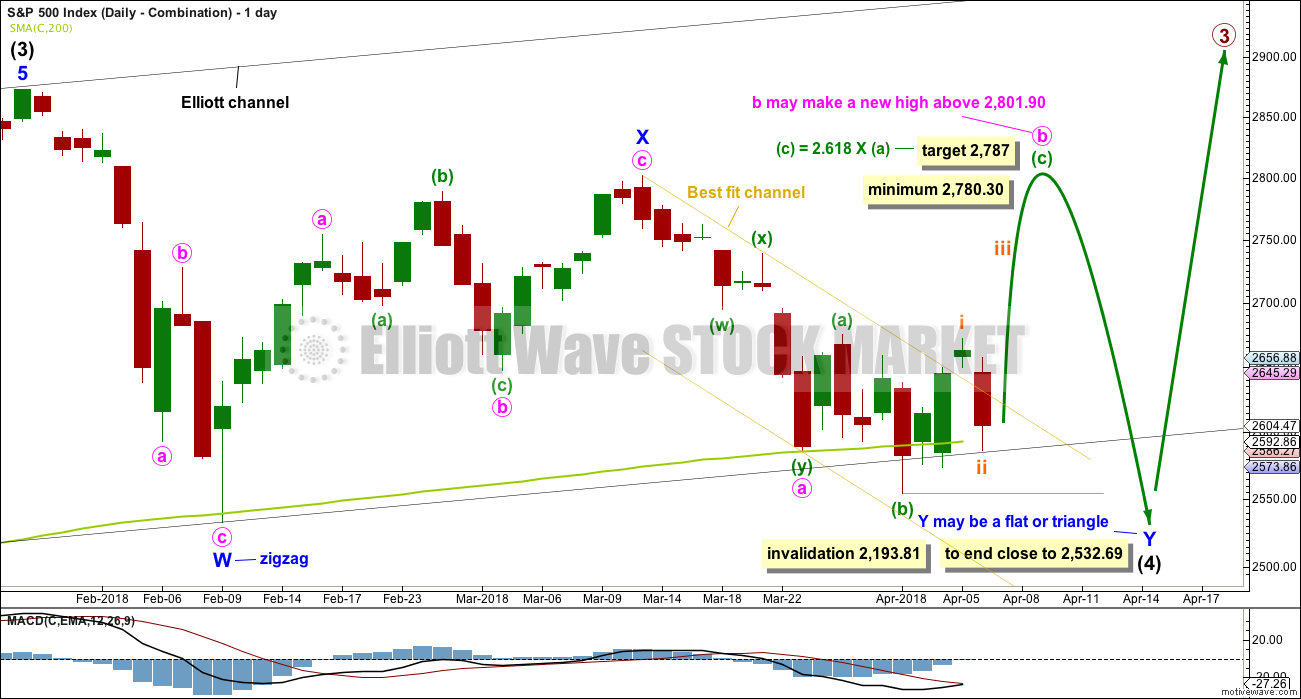
Minor wave D upwards should subdivide as a zigzag. Within the zigzag, minute wave b now shows up on the daily chart as a large red daily candlestick. This would give minor wave D an obvious three wave look on the daily chart, which should be expected.
Minute wave b subdivides as a completed double zigzag. The most common Fibonacci ratio is used to calculate a target for minute wave c. This would see minor wave D shorter than the common length of 0.80 to 0.85 the length of minor wave C.
Minute wave c must subdivide as a five wave structure, and within it no second wave correction may move beyond the start of its first wave below 2,586.27.
Minute wave c may end about the upper edge of the pink upwards sloping Elliott channel, which is drawn about the zigzag of minor wave D.
When upwards movement breaches the upper edge of the yellow downwards sloping best fit channel, that shall provide some confidence that minute wave b should be over and minute wave c upwards should be underway.
ALTERNATE HOURLY CHART
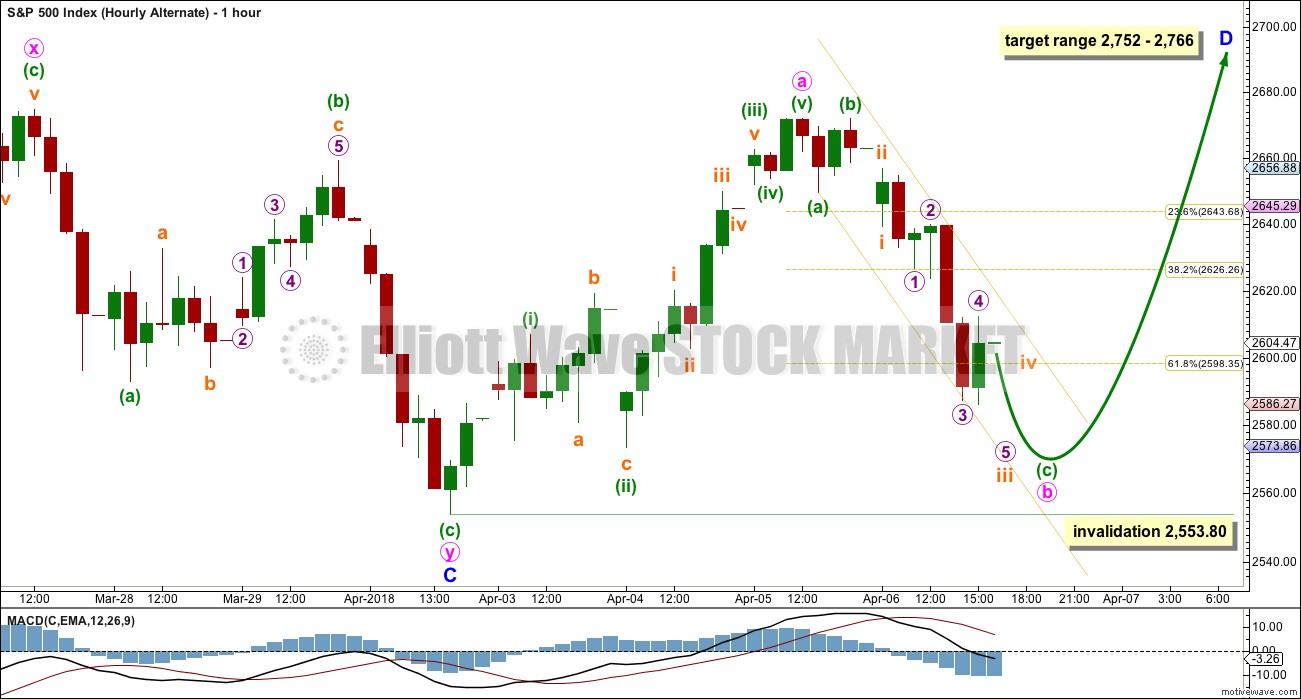
It is also possible that minute wave b is incomplete as a single zigzag.
This hourly wave count has a lower probability. Minuette wave (c) in comparison to minuette wave (a) is longer than is normal.
Minute wave b may not move beyond the start of minute wave a below 2,553.80.
DAILY CHART – COMBINATION
Double combinations are very common structures. The first structure in a possible double combination for intermediate wave (4) would be a complete zigzag labelled minor wave W. The double should be joined by a three in the opposite direction labelled minor wave X, which may be a complete zigzag. X waves within combinations are typically very deep; if minor wave X is over at the last high, then it would be a 0.79 length of minor wave W, which is fairly deep giving it a normal look. There is no minimum nor maximum requirement for X waves within combinations.
The second structure in the double would most likely be a flat correction labelled minor wave Y. It may also be a triangle, but in my experience this is very rare, so it will not be expected. The much more common flat for minor wave Y will be charted and expected.
A flat correction would subdivide 3-3-5. Minute wave a must be a three wave structure, most likely a zigzag. It may also be a double zigzag. On the hourly chart, this is now how this downwards movement fits best, and this will now be how it is labelled.
Minute wave b must now reach a minimum 0.90 length of minute wave a. Minute wave b must be a corrective structure. It may be any corrective structure. It may be unfolding as an expanded flat correction. A target is calculated for it to end. Within minuette wave (c), the correction for subminuette wave ii may not move beyond the start of subminuette wave i below 2,553.80.
The purpose of combinations is to take up time and move price sideways. To achieve this purpose the second structure in the double usually ends close to the same level as the first. Minor wave Y would be expected to end about the same level as minor wave W at 2,532.69. This would require a strong overshoot or breach of the 200 day moving average, which looks unlikely.
DAILY CHART – COMBINATION II
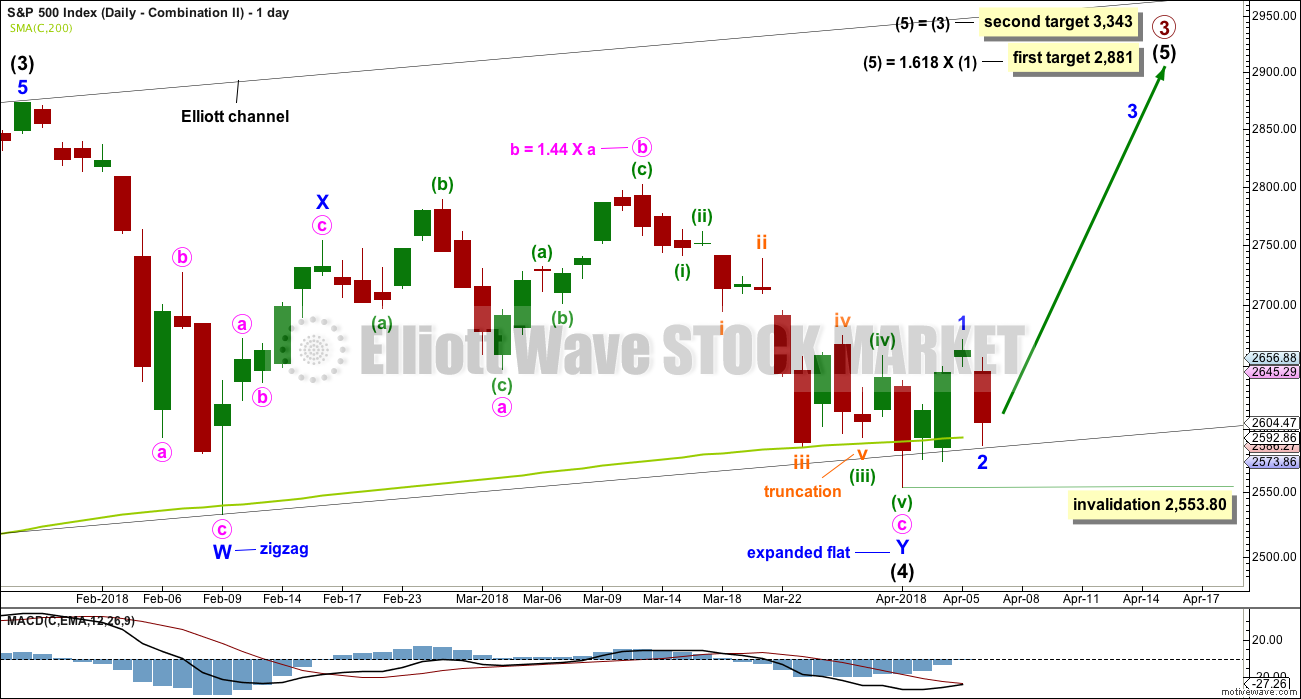
This is another way to label the combination.
Minor wave W is still a zigzag labelled in the same way, over at the first low within intermediate wave (4).
The double is joined by a quick three in the opposite direction labelled minor wave X, subdividing as a zigzag.
Minor wave Y may have begun earlier and may now be a complete expanded flat correction. However, in order to see minor wave Y complete there is a truncated fifth wave as noted on the chart. This reduces the probability of this wave count.
If intermediate wave (4) is a complete double combination, then minor wave Y has ended somewhat close to the end of minor wave W; the whole structure would have an overall sideways look to it.
A target is calculated for intermediate wave (5). Within intermediate wave (5), minor wave 2 may not move beyond the start of minor wave 1 below 2,553.80.
At the hourly chart level, this wave count would expect a five up continuing. The labelling for the short term would be the same as the hourly chart published above for the first wave count.
DAILY CHART – FLAT
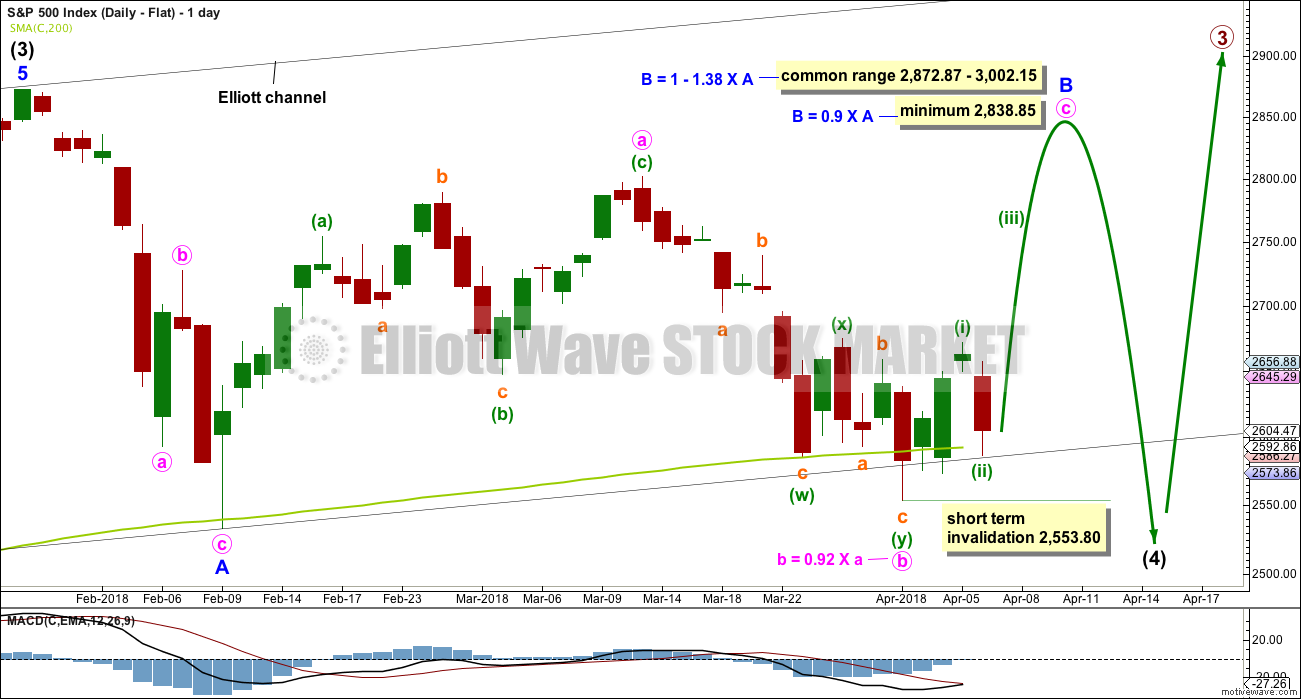
Flat corrections are very common. The most common type of flat is an expanded flat. This would see minor wave B move above the start of minor wave A at 2,872.87.
Within a flat correction, minor wave B must retrace a minimum 0.9 length of minor wave A at 2,838.85. The most common length for minor wave B within a flat correction would be 1 to 1.38 times the length of minor wave A at 2,872.87 to 3,002.15. An expanded flat would see minor wave B 1.05 times the length of minor wave A or longer, at 2,889.89 or above.
Minor wave B may be a regular flat correction, and within it minute wave a may have been a single zigzag and minute wave b may have been a double zigzag. This has a very good fit. The subdivisions at the hourly chart level at this stage would be the same for the last wave down as the main wave count.
This wave count would require a very substantial breach of the 200 day moving average for the end of intermediate wave (4). This is possible but may be less likely than a smaller breach.
DAILY CHART – ALTERNATE
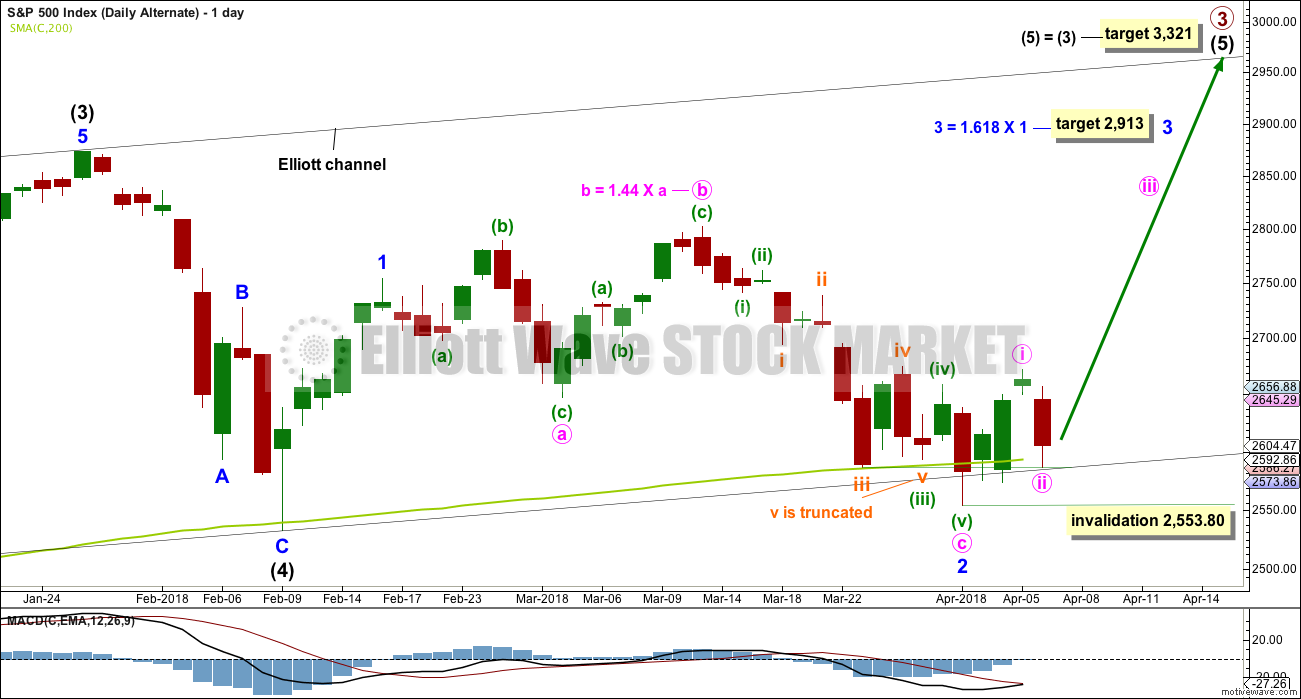
It is possible still that intermediate wave (4) was complete as a relatively brief and shallow single zigzag.
A new all time high with support from volume and any one of a bullish signal from On Balance Volume or the AD line would see this alternate wave count become the main wave count.
The target for minor wave 3 expects the most common Fibonacci ratio to minor wave 1.
Within minor wave 2, there is a truncation as noted on the chart. This must necessarily reduce the probability of this wave count.
Within minor wave 3, minute wave ii may not move beyond the start minute wave i below 2,553.80.
TECHNICAL ANALYSIS
WEEKLY CHART
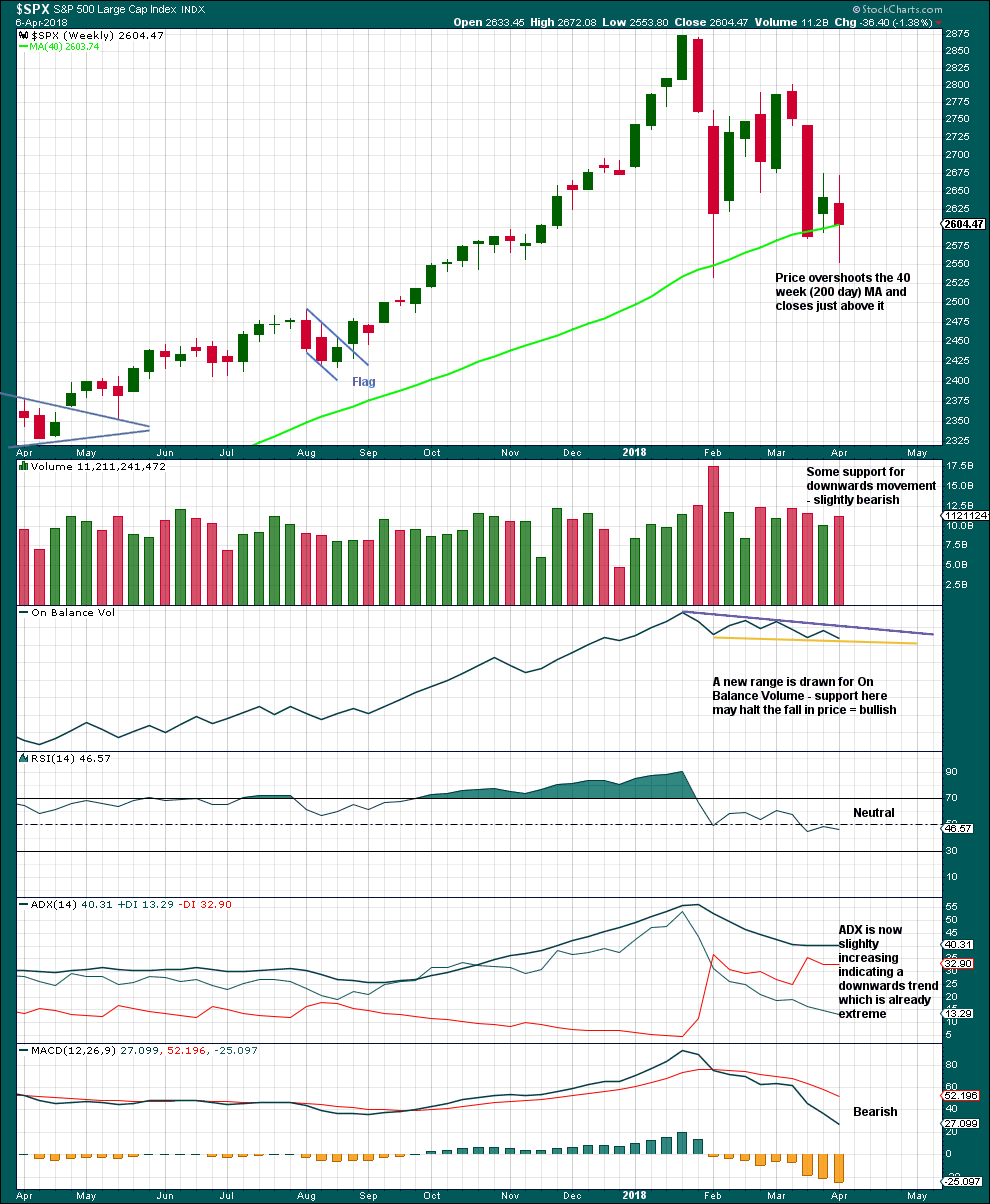
Click chart to enlarge. Chart courtesy of StockCharts.com.
The last completed weekly candlestick has longer upper and lower wicks; it is almost a spinning top. This represents a balance of bulls and bears with the bears slightly winning. A slight increase in volume for downwards movement is only slightly bearish; volume remains lighter than the last two prior downwards movement, so overall volume is declining.
Another downwards week would provide a bearish signal from On Balance Volume. An upwards week would provide a bullish signal. Expect support here until it gives way.
The trend on ADX is extreme because the ADX line is above both directional lines.
DAILY CHART
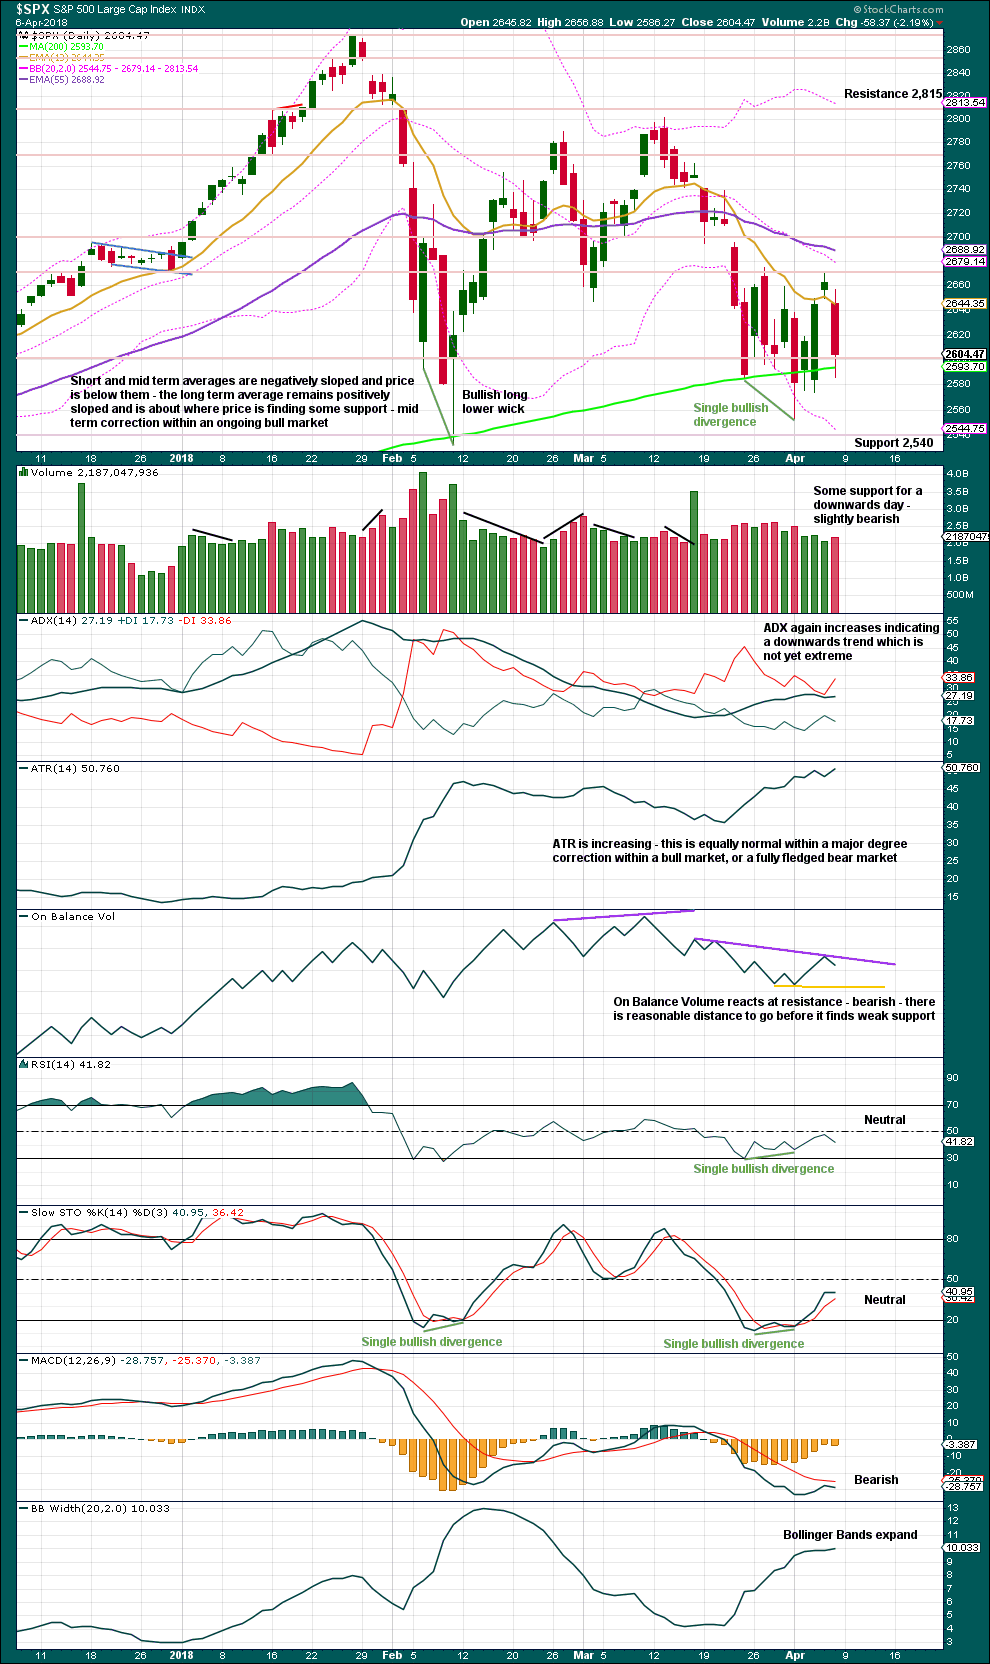
Click chart to enlarge. Chart courtesy of StockCharts.com.
So far this week price has found support about the 200 day moving average, with some overshoots. Expect it to continue to show about where price should find support, until it does not.
While there was a small increase in volume for a downwards day on Friday, it is still lighter than two of the three prior upwards days. This supports the main Elliott wave count, which sees a low for Friday.
VOLATILITY – INVERTED VIX CHART
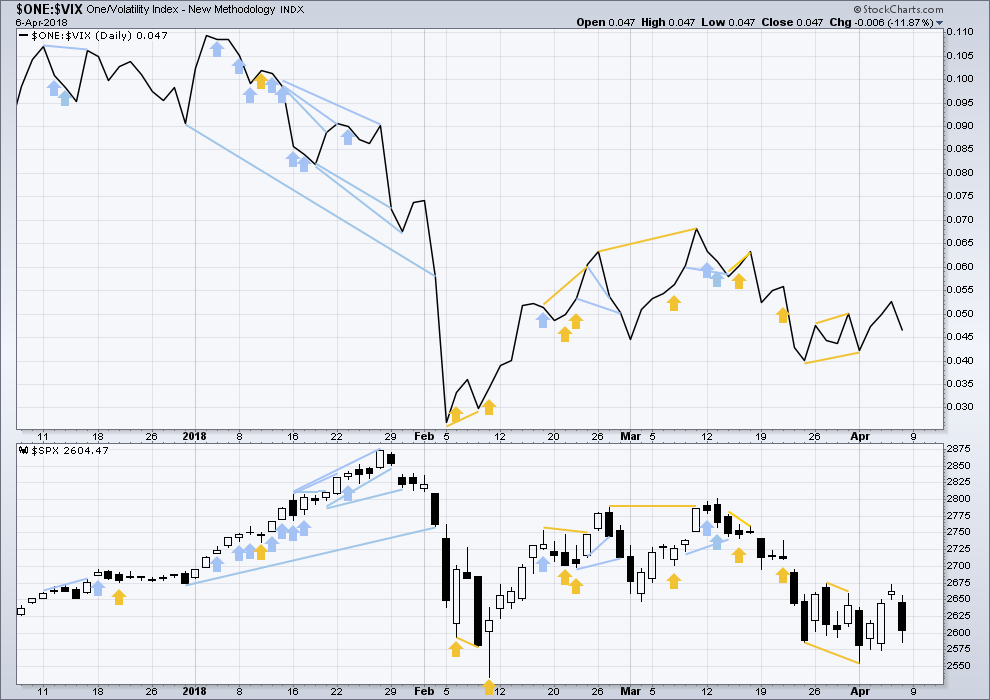
Click chart to enlarge. Chart courtesy of StockCharts.com.
So that colour blind members are included, bearish signals will be noted with blue and bullish signals with yellow.
Normally, volatility should decline as price moves higher and increase as price moves lower. This means that normally inverted VIX should move in the same direction as price.
There is no new divergence for Friday.
BREADTH – AD LINE
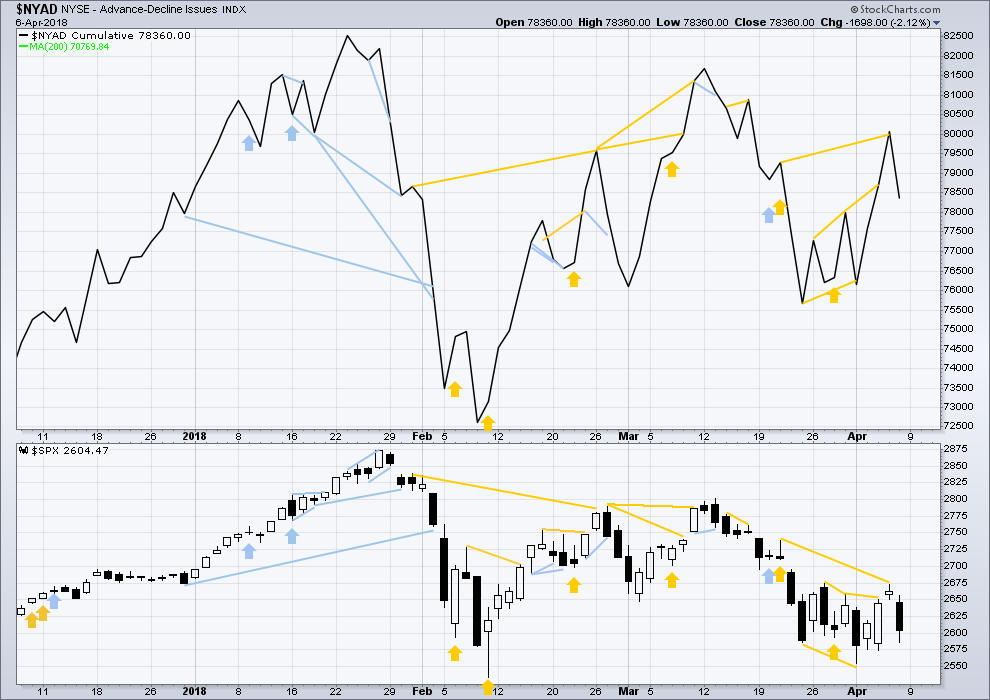
Click chart to enlarge. Chart courtesy of StockCharts.com.
There is normally 4-6 months divergence between price and market breadth prior to a full fledged bear market. This has been so for all major bear markets within the last 90 odd years. With no longer term divergence yet at this point, any decline in price should be expected to be a pullback within an ongoing bull market and not necessarily the start of a bear market.
All of small, mid and large caps this week moved lower. None have made new small swing lows, and for all the fall has been even. There is no divergence to indicate underlying weakness.
Breadth should be read as a leading indicator.
Bullish divergence noted in last analysis has been followed by a downwards day. It is considered to have failed.
There is no new divergence for Friday.
DOW THEORY
The following lows need to be exceeded for Dow Theory to confirm the end of the bull market and a change to a bear market:
DJIA: 23,360.29.
DJT: 9,806.79.
S&P500: 2,532.69.
Nasdaq: 6,630.67.
At this stage, only DJIA has made a new major swing low. DJT also needs to make a new major swing low for Dow Theory to indicate a switch from a bull market to a bear market. For an extended Dow Theory, which includes the S&P500 and Nasdaq, these two markets also need to make new major swing lows.
Charts showing each prior major swing low used for Dow Theory may be seen at the end of this analysis here.
Published @ 05:09 a.m. EST on 7th April, 2018.

Futures rally underway on apparent dovishness from Xi. I’ve always been adamant that it’s best to position yourself opposite however the market moves in response to speeches and lame tweets. That being said, I don’t think the bears can afford to lose the momentum here. Corrections and bear markets rarely last long.
Incredible! The Xi speech took the futures up in a straight line with more intensity than the drop earlier today. The futures prices actually took out earlier day’s highs above 2655!
The question is now if this is a 3rd wave up, or now a completed abc as a corrective move up, and now ready for an impulse down…
I’ve been out most of the day. Another large swing day. Relative high volatility is present. We have not seen % swings or point swings like this in a long time. I am still using 2450 SPX as the point I would be enticed to go long. If the triangle is correct, that won’t happen and I will go long about 200 points higher at the end of the Minor E wave of Intermediate 4. I’d love to see a flush and run of the stop loss orders below 2533 down to 2450. Looking forward to tonight’s analysis.
Hourly chart updated:
sorry it’s only just before NY close folks
I’m going to consider the possibility of minute b continuing further. It could be either a flat or triangle.
If the last wave down is correctly labelled as a double zigzag, then minute b can’t continue as a combination.
The tape here looks incredibly weak to me. I’ve been pretty bullish through all of this correction, but the abject failure of the bulls to launch any sort of move off the 200dma is making me reconsider my stance entirely. The VIX 50dma looks like pretty solid support going forward. And it’s about to go green on a day where we were up over 50 points. Long upper wicks have mostly brought pain for the bulls and I don’t see that changing much here.
I do honestly still think this is not the end of the bull market, but in the best case we need one more deep lower week and intraday positive reversal to establish any sort of confidence in a sustained move up. Neither side here has asserted much control at the 200dma. The move since last week’s low looks corrective to me, and I think the bears will have one last hurrah to take us all the way Down to the Feb 9 low before upward momentum really gets going again.
“Sentiment” (the delicate balance point between two very, very large forces: buying pressure and selling pressure) has been swinging wildly here in the last few weeks. Hours blasting up…followed immediately by hours blasting down. Spectacular, really.
SPX sporting yet another wick. A very reliable tell of late!
You know what to do! 🙂
Have a great evening all!
Russia Stock market Futures are down 8 – 11%
Thats crazy!
Sold long SPY calls of 260 strike straddle. If market continues higher above 50 day will turn 260 put into 260/262 bull put spread….
A lot of fibo and recent price resistance here in the 2631-2636 range.
is this 2 now ?
I don’t see anything resembling a possible 2 down yet. I need to see some swing lows on the 5 minute chart getting violated at a minimum.
Pushed through that…but up ahead in the 2654-7 range I have 4 different fibos , and there’s the resistance of the March 29 high, and I have two different symmetric projections, all indicating a potential turn zone. The market is definitely reaching the price move length where it has tended to turn on a time and go the other way hard, for the last week or more. And wave count wise, looking at the hourly…this is one giant “a” or “1”. So anything’s possible but I’m watching carefully for a turn and sell triggers very soon.
Hi Kevin
Im confused last week we where higher then that we went up to 2672
So what your saying is that we might no go that high before we correct again?
Is that what I’m understanding?
Thank You
I don’t try to predict Eric. I try to identify high potential turn zones…then wait to see if in fact price turns in that area. There’s a likely turn zone up ahead, that’s all. And at the hourly level, it’s been “straight up” since late Friday. So some kind of pullback is probably due soon. Also, recently, the “structure” of the market action is very large and rapid up swings and down swings. Now we’ve had another strong up swing. What’s likely next? Maybe another strong down swing.
Thanks Kevin I agree
I have a hunch this straight wave up is minuette (b) of minute b, as I had asked Lara below over the weekend… I’m also waiting for a turn down soon… to continue into tomorrow
While this certainly could keep moving sharply lower…I’m looking at the hourly timeframe action on and just after Mar 6 (after the mar 2-6 rally) as a very possible model of what may play out here.
The bullish view: almost completed an ABC corrective 2 here. Then a 3 up should launch to follow today’s 1 up (or a C up to follow this morning’s A up, and now B down).
The bearish view: Completed a 1 down and 2 up, and the first 1 of a 3 down…lots more down to come.
I think it’s the bullish view…unless/until the 38% retrace gets exceeded, at 2627.7
Kevin, Thanks for your intraday commentary and daily levels. I’ve been using your levels coupled with Lara’s overnight analysis and it has helped me survive in this choppy market. I also support the bullish view even though I’m a bear. The trade war headlines, FBI news, poor economic data should have easily been enough to push this market through its 200 DMA. Today it was another headline that really highlighted the fear and volatility in this market. I do have a sinking feeling that one of these days there will be a headline that brings this market to its knees but for now I’m patiently waiting Lara’s 1st Target @ 2,700.
I second Jonathan ‘s comment. Your comment about the 2654-57 range helped me much to be patient and enter short near highs of today 🙂
Your comments and insight really does help navigate this choppy bipolar market… thanks again!
Hi Lara, is there any way to see the low of last Friday as the the end of minuette (a) of this minute b wave, with minuette (b) and (c) incomplete?
Sure, it could be. Minuette (a) would fit best as a double zigzag, which may indicate minute b as a flat.
Which would expect a deep bounce, at least 0.9 X the last wave down at 2,663.49. Or above.
A regular flat would fit, move sideways and not breach the invalidation point. So that’s entirely possible.
The only problem I have, and why I tentatively labeled minute b as complete, is it’s already deep and shows up nicely on the daily chart. There’s not much room for it to move into.
Thanks Lara!
The volatility masters at Artemis are expecting an explosion in VIX. I got a great explanation of why VIX has been coiling for so long. They say that is not unusual for triangles and diagonals, with big moves coming after their completion. I learned something new!
This is one huge triangle and they are very commom fourth wave structures. It took a while for it to become clear but it offers up fantastic opportunities to now trade the D wave up, the E wave down, and then the possible upward break-out. So there you have it Joe; your ready made trading plan for the month of April! 🙂
So do you see the VIX explosion at the beginning of minor E? Otherwise it wouldn’t go up during minor D and intermediate 5 going up…
While I think the new DJI low has weakened the case for the triangle (contracting), clearly the VIX move would not be expected until we completed the E wave and had the thrust up out of it for the final wave. Triangles are notorious as penultimate waves, but as Lara has mentioned, it is not uncommon for what looked like a triangle to at the end morph into something different…
Vague (time unbounded) claims about the market are almost always eventually right. Therefore, Artemis will be “correct”, perhaps today, perhaps in months. Their marketing dept. will be thrilled at that point.
The guys at Artemis are big picture folk but I would hardly call what they do vague. They were very specific about what would happen with the short vol trade and granted it took a while, they were spot on. Those are not people you want to dismiss lightly. I have known Chris Cole for a while and he is no lightweight…based on what I see VIX doing, I think they are right!
I’m sure they are exceptional Verne. But my point stands: saying “I expect the market to go down sharply” without any timing information is content free. Maybe they provided you the timing and you didn’t pass it along. Maybe they only provide that under a higher subscription level. I don’t know. All I know is, if someone says “a vix explosion is coming”, that means a sharp SPX sell off is coming. That’s ALWAYS true!!!! Eventually, it will come. No timing info….no info at all. I don’t mean to disparage them. I’m sure they know a hell of a lot more than I do. But I do note that by NOT giving timing info, they can claim “success” whenever it does happen. It’s a tried and true way to be able to market a service’s “predictive skills”. That may or may not be what’s going on here. I don’t know. It certainly goes on a lot in general in that industry. Along with making two different claims at slightly different times, and then later promoting whichever one worked out. Lots of gamesmanship. It’s a business….
There is a CONTEXT to the comments Aretemis Capital makes about volatility. I don’t really expect everyone to get that. I still remember your confident dismissal a few months back of my mean reversion argument regarding VIX, trading around 10 at the time.
Nothing new under the Sun! 🙂
Hi Verne
The market is up today and the Vix is barely down.
Do you think from the action in the VIX that the market goes down after today or tomorrow?
Thank You
The short term price action is hard to gauge. The one thing I learned from the sort vol trade is to not confuse the forest from the trees. I am accumulating long vol positions several months out and not worrying too much about the day to day fluctuations.
You are spot on about VIX refusing to buckle to some intense attempts to sell it short as you can see from the series of long tails on the one minute chart this morning. Smart traders are getting positioned long vol and they have been doing so for a few weeks now.
If this is the D wave of a triangle, how much longer price rises would of course depend on how quickly we hit the upper target. The pattern of these legs of the possible triangle is they are completing the sub waves in a day or two….
Here’s to a great weekend for everyone.
Thank you Lara for your analysis and commentary. It is excellent as always. You are a great teacher. Thanks.
You’re welcome Rodney 🙂
We’ve had some surf these last few days, so I’m stoked and feeling zen again, ready for the new week