Upwards movement is exactly what was expected from last analysis.
Summary: Expect upwards movement this week. The target is now a range within 2,752 – 2,766. When there is more upwards structure to analyse, then a smaller target may be calculated.
Do not expect this upwards swing to move in a straight line. Look out for a pullback for a B wave within it.
Always practice good risk management. Always trade with stops and invest only 1-5% of equity on any one trade.
New updates to this analysis are in bold.
The biggest picture, Grand Super Cycle analysis, is here.
Last historic analysis with monthly charts is here. Video is here.
An alternate idea at the monthly chart level is given here at the end of this analysis.
An historic example of a cycle degree fifth wave is given at the end of the analysis here.
MAIN ELLIOTT WAVE COUNT
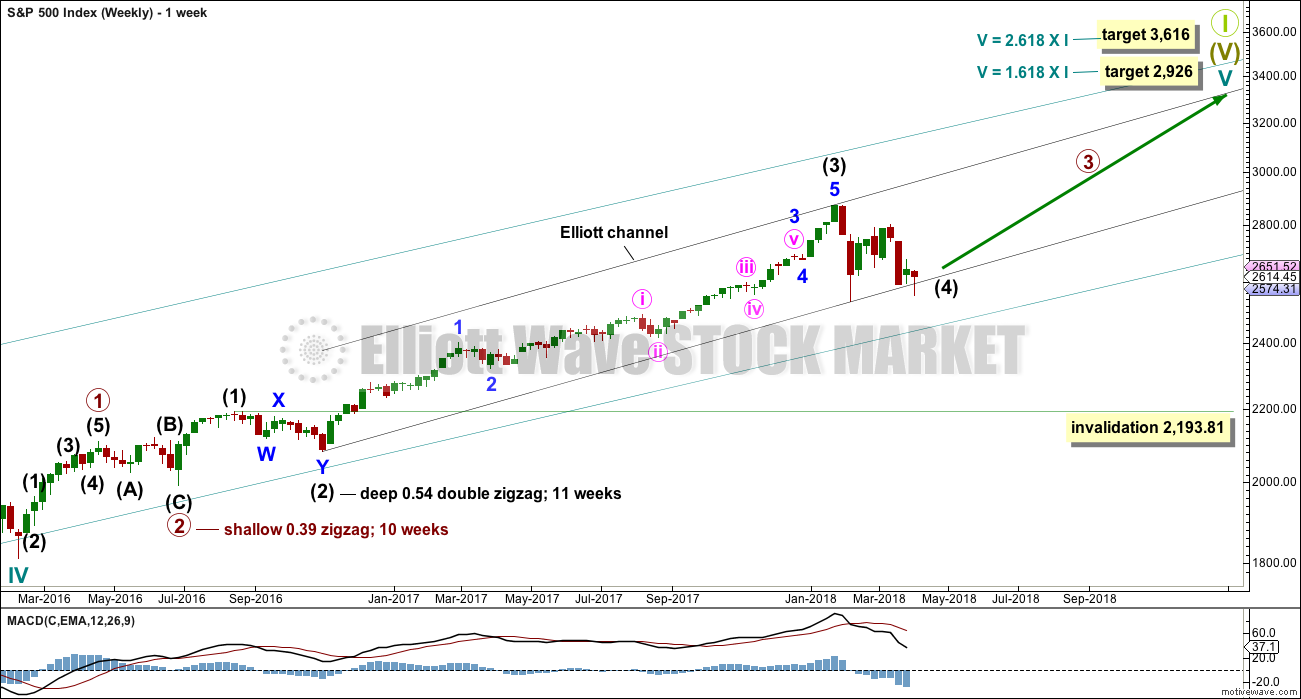
WEEKLY CHART
Cycle wave V must complete as a five structure, which should look clear at the weekly chart level. It may only be an impulse or ending diagonal. At this stage, it is clear it is an impulse.
Within cycle wave V, the third waves at all degrees may only subdivide as impulses.
Intermediate wave (4) has breached an Elliott channel drawn using Elliott’s first technique. The channel is redrawn using Elliott’s second technique as if intermediate wave (4) was over at the first swing low within it. If intermediate wave (4) continues sideways, then the channel may be redrawn when it is over. The upper edge may provide resistance for intermediate wave (5).
Intermediate wave (4) may not move into intermediate wave (1) price territory below 2,193.81. However, it would be extremely likely to remain within the wider teal channel (copied over from the monthly chart) if it were to be reasonably deep. This channel contains the entire bull market since the low in March 2009, with only two small overshoots at the end of cycle wave IV. If this channel is breached, then the idea of cycle wave V continuing higher would be discarded well before the invalidation point is breached.
At this stage, it now looks like intermediate wave (4) may be continuing further sideways as a combination, triangle or flat. These three ideas are separated into separate daily charts. All three ideas would see intermediate wave (4) exhibit alternation in structure with the double zigzag of intermediate wave (2).
A double zigzag would also be possible for intermediate wave (4), but because intermediate wave (2) was a double zigzag this is the least likely structure for intermediate wave (4) to be. Alternation should be expected until price proves otherwise.
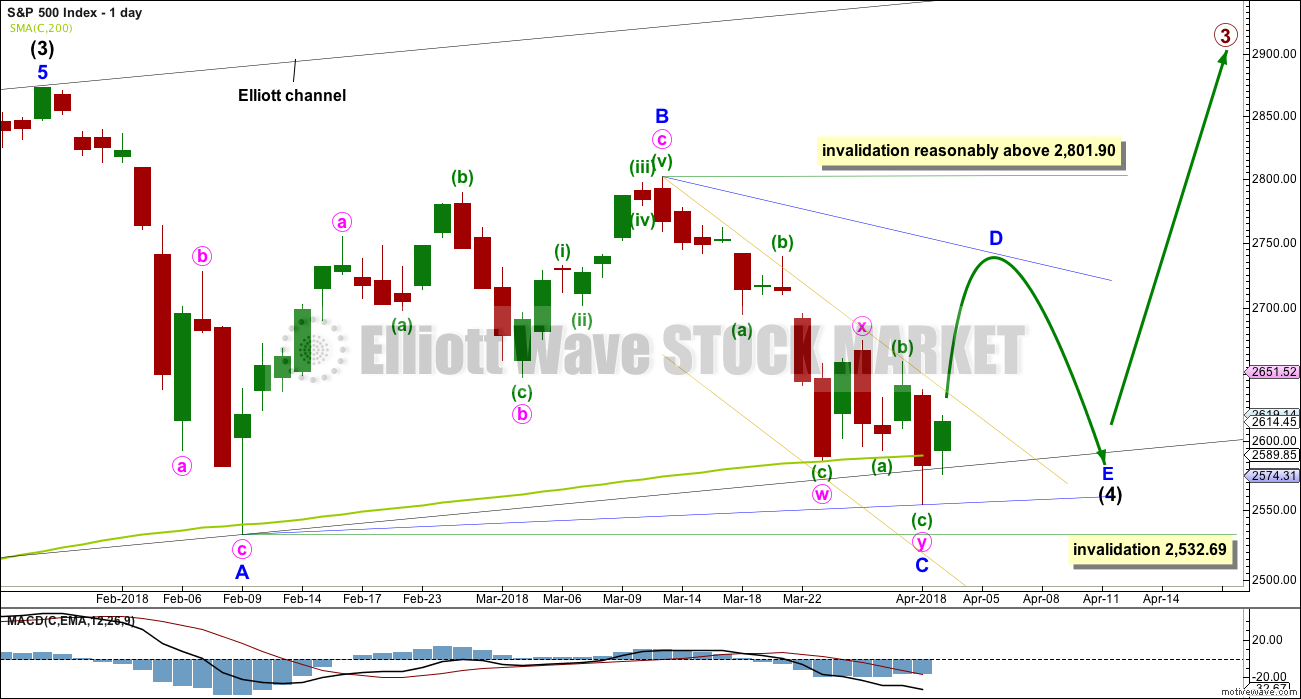
DAILY CHART – TRIANGLE
This first daily chart looks at a triangle structure for intermediate wave (4). The triangle may be either a regular contracting or regular barrier triangle. Within the triangle, minor waves A, B and C may be complete.
If intermediate wave (4) is a regular contracting triangle, the most common type, then minor wave D may not move beyond the end of minor wave B above 2,801.90. Minor wave D would be very likely to end about 0.80 to 0.85 the length of minor wave C.
If intermediate wave (4) is a regular barrier triangle, then minor wave D may end about the same level as minor wave B at 2,801.90. As long as the B-D trend line remains essentially flat a triangle will remain valid. In practice, this means the minor wave D can end slightly above 2,801.90 as this rule is subjective.
When a zigzag upwards for minor wave D is complete, then this wave count would expect a final smaller zigzag downwards for minor wave E, which would most likely fall reasonably short of the A-C trend line.
If this all takes a further four weeks to complete, then intermediate wave (4) may total a Fibonacci 13 weeks and would be just two weeks longer in duration than intermediate wave (2). There would be very good proportion between intermediate waves (2) and (4), which would give the wave count the right look.
The lower wick of yesterday’s candlestick overshoots the black channel and the 200 day moving average. This is entirely acceptable for this wave count; the overshoot does not mean price must now continue lower. The A-C trend line for this wave count should have a slope, so minor wave C should now be over.
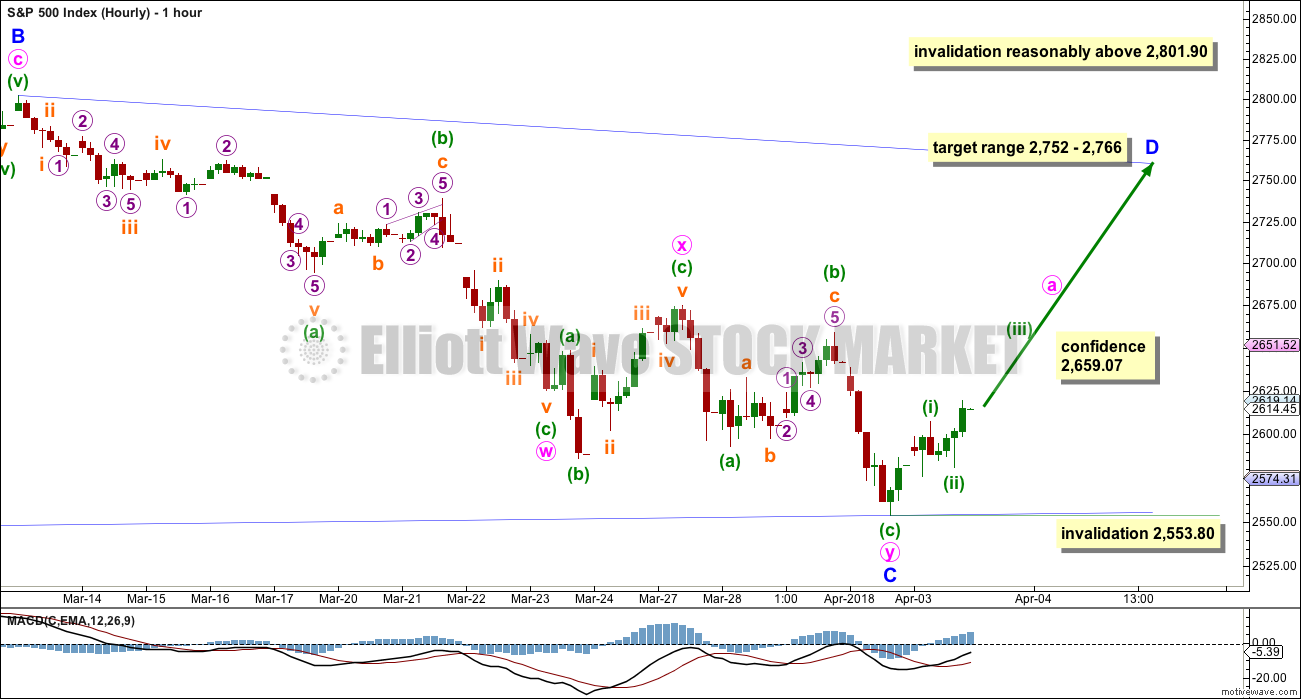
HOURLY CHART
Minor wave C now subdivides well as a double zigzag ending at yesterday’s low.
Minor wave D upwards may have begun, and within it minuette wave (ii) may not move beyond the start of minuette wave (i) below 2,553.80.
A new high above 2,569.07 by any amount at any time frame would provide some further confidence in this wave count.
Triangle sub-waves are commonly from 0.80 to 0.85 the length of the prior sub-wave. This gives an expected range for minor wave D. Minor wave D would be extremely likely to subdivide as a zigzag. When minute waves a and b within it are complete, then a Fibonacci ratio between minute waves a and c may be used to calculate a smaller target for minor wave D to end. That cannot be done yet.
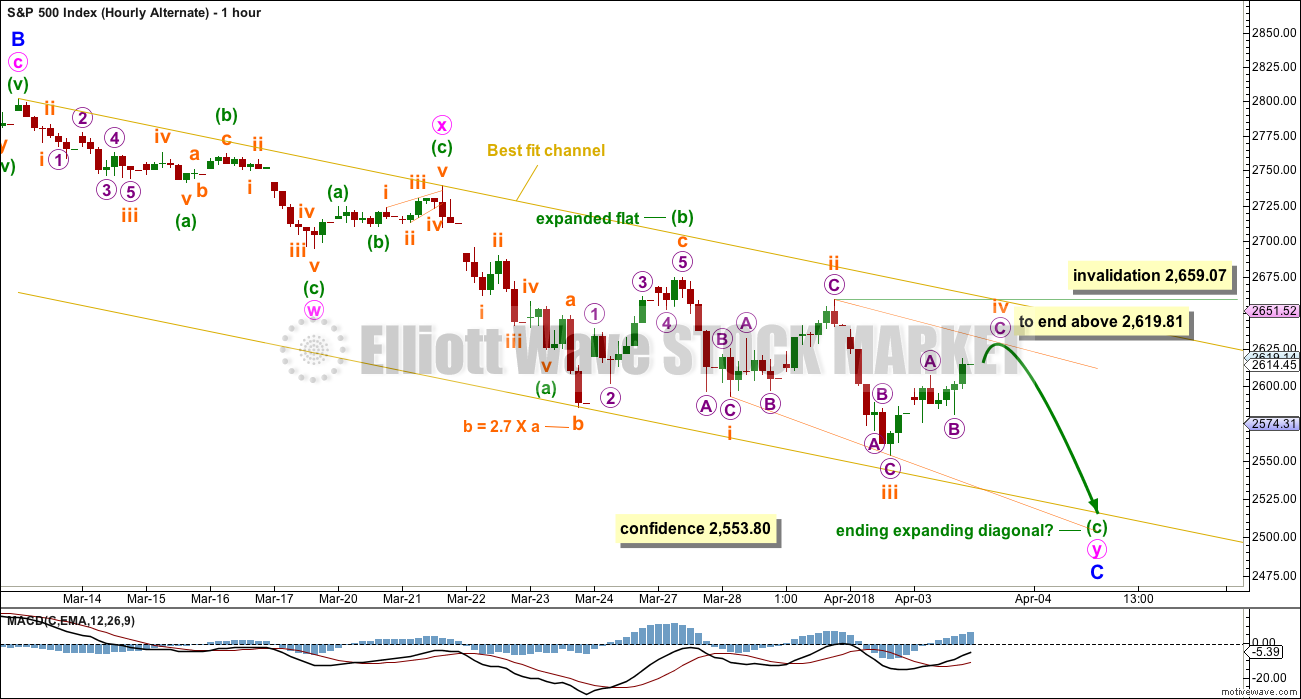
ALTERNATE HOURLY CHART
It is possible that the second zigzag of minute wave y is incomplete.
Within minute wave y, minuette wave (c) may be an ending expanding diagonal. The diagonal may be expanding because subminuette wave iii is longer than subminuette wave i.
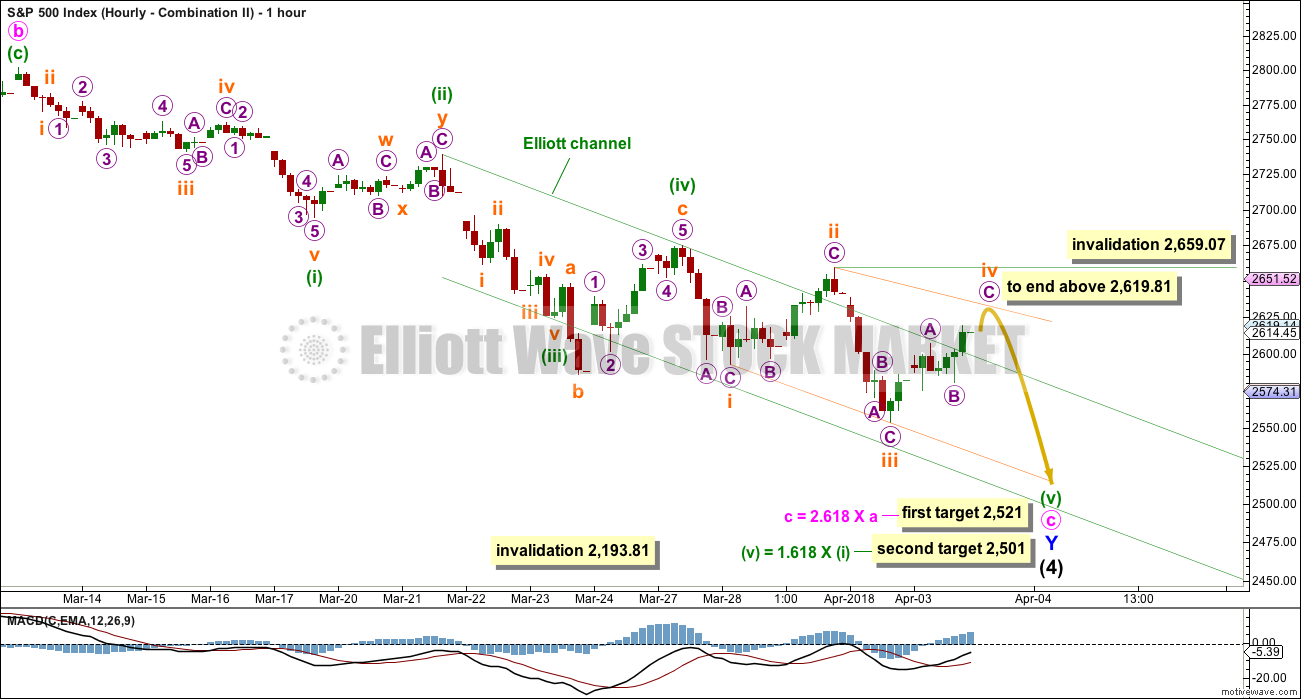
Subminuette wave iv must be longer than subminuette wave ii and must end above 2,619.81. Thereafter, subminuette wave v must be longer than subminuette wave iii, which was 105.27 points.
Subminuette wave iv may not move beyond the end of subminuette wave ii above 2,569.07.
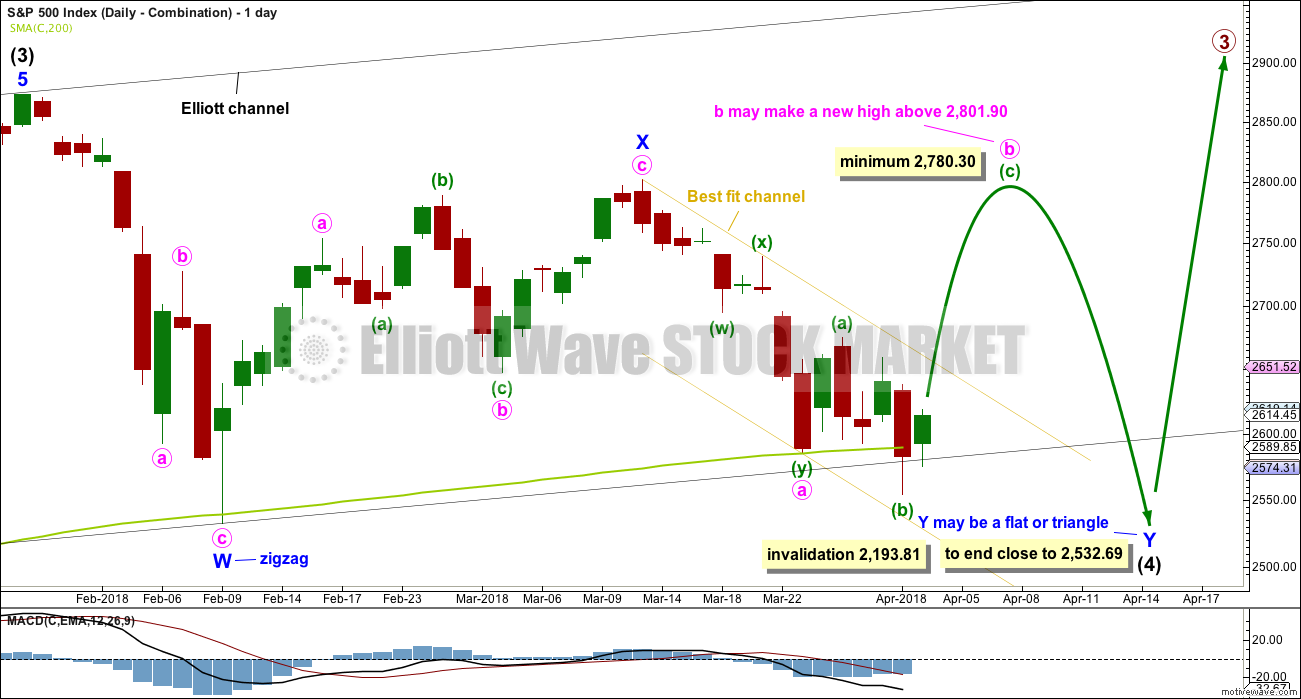
DAILY CHART – COMBINATION
Double combinations are very common structures. The first structure in a possible double combination for intermediate wave (4) would be a complete zigzag labelled minor wave W. The double should be joined by a three in the opposite direction labelled minor wave X, which may be a complete zigzag. X waves within combinations are typically very deep; if minor wave X is over at the last high, then it would be a 0.79 length of minor wave W, which is fairly deep giving it a normal look. There is no minimum nor maximum requirement for X waves within combinations.
The second structure in the double would most likely be a flat correction labelled minor wave Y. It may also be a triangle, but in my experience this is very rare, so it will not be expected. The much more common flat for minor wave Y will be charted and expected.
A flat correction would subdivide 3-3-5. Minute wave a must be a three wave structure, most likely a zigzag. It may also be a double zigzag. On the hourly chart, this is now how this downwards movement fits best, and this will now be how it is labelled.
Minute wave b must now reach a minimum 0.90 length of minute wave a. Minute wave b must be a corrective structure. It may be any corrective structure. It may be unfolding as an expanded flat correction.
The purpose of combinations is to take up time and move price sideways. To achieve this purpose the second structure in the double usually ends close to the same level as the first. Minor wave Y would be expected to end about the same level as minor wave W at 2,532.69. This would require a strong overshoot or breach of the 200 day moving average, which looks unlikely.
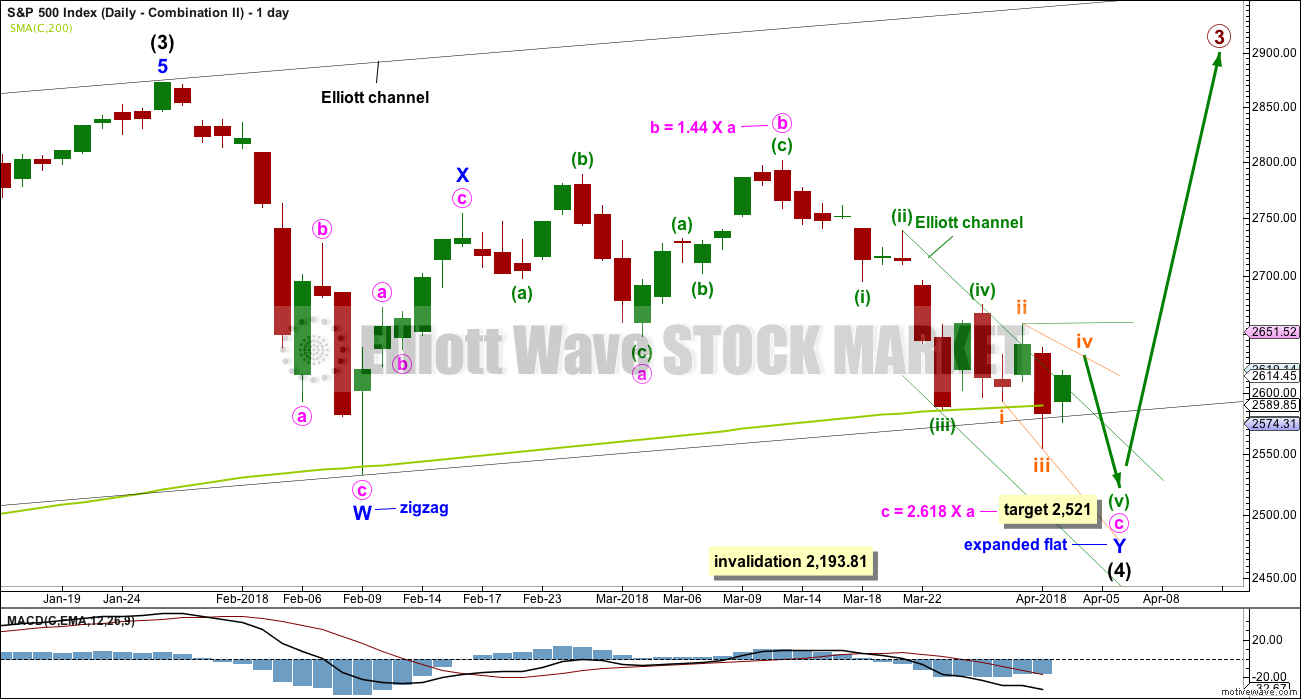
DAILY CHART – COMBINATION II
This is another way to label the combination.
Minor wave W is still a zigzag labelled in the same way, over at the first low within intermediate wave (4).
The double is joined by a quick three in the opposite direction labelled minor wave X, subdividing as a zigzag.
Minor wave Y may have begun earlier and may be an almost complete expanded flat correction, and within it minute wave a is a three, itself an expanded flat. Minute wave b is a zigzag and only slightly longer than the most common length of up to 1.38 times the length of minute wave a. Minute wave c downwards must be a five wave structure. It may need a final fifth wave to complete it.
Within minuette wave (v), no second wave correction may move beyond its start above 2,674.78.
The target would see minor wave Y end only slightly below the end of minor wave W. The whole structure for the double combination would move sideways. This wave count would also require a substantial breach of the 200 day moving average (at this point about 68 points). This is possible and does have precedent.
HOURLY CHART – COMBINATION II
The Elliott channel is drawn using Elliott’s second technique for an impulse. If an impulse downwards is incomplete, then within minuette wave (v) upwards corrections should find strong resistance at the upper edge of the channel. That channel should not be breached.
Minuette wave (v) may be an incomplete ending expanding diagonal. The short term invalidation point and short term structure is the same as the alternate hourly chart above.
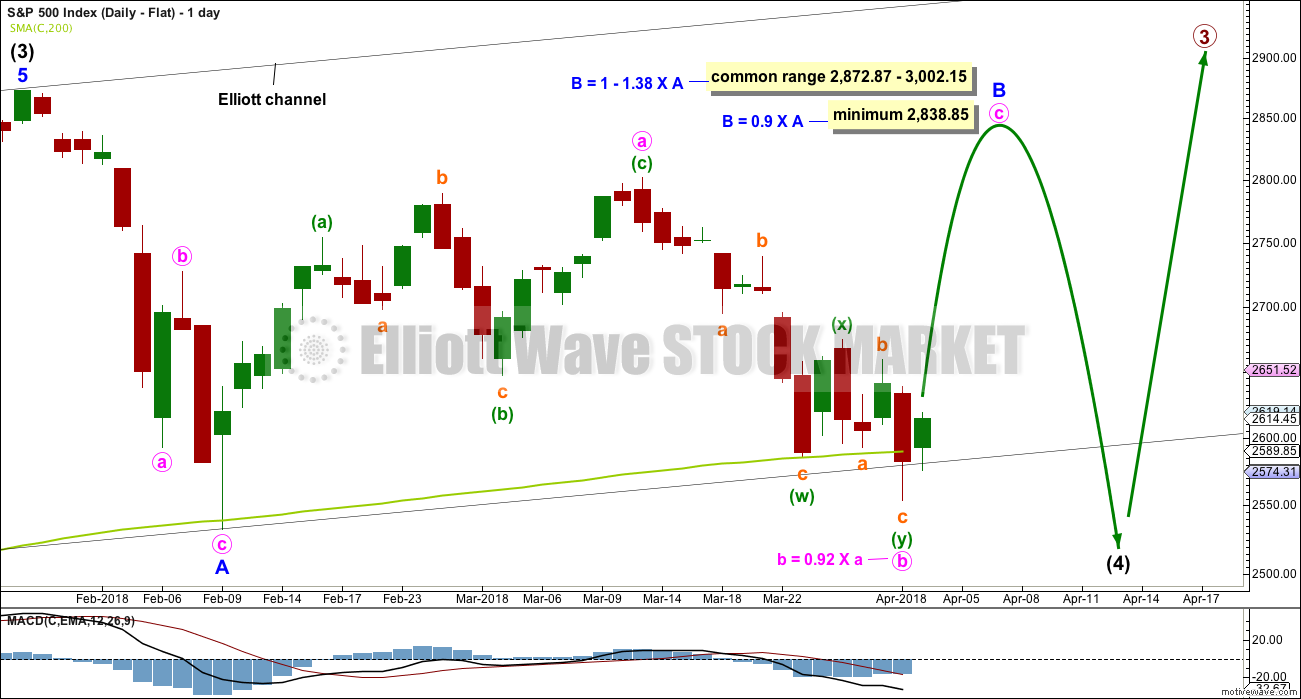
DAILY CHART – FLAT
Flat corrections are very common. The most common type of flat is an expanded flat. This would see minor wave B move above the start of minor wave A at 2,872.87.
Within a flat correction, minor wave B must retrace a minimum 0.9 length of minor wave A at 2,838.85. The most common length for minor wave B within a flat correction would be 1 to 1.38 times the length of minor wave A at 2,872.87 to 3,002.15. An expanded flat would see minor wave B 1.05 times the length of minor wave A or longer, at 2,889.89 or above.
Minor wave B may be a regular flat correction, and within it minute wave a may have been a single zigzag and minute wave b may have been a double zigzag. This has a very good fit. The subdivisions at the hourly chart level at this stage would be the same for the last wave down as the main wave count.
This wave count would require a very substantial breach of the 200 day moving average for the end of intermediate wave (4). This is possible but may be less likely than a smaller breach.
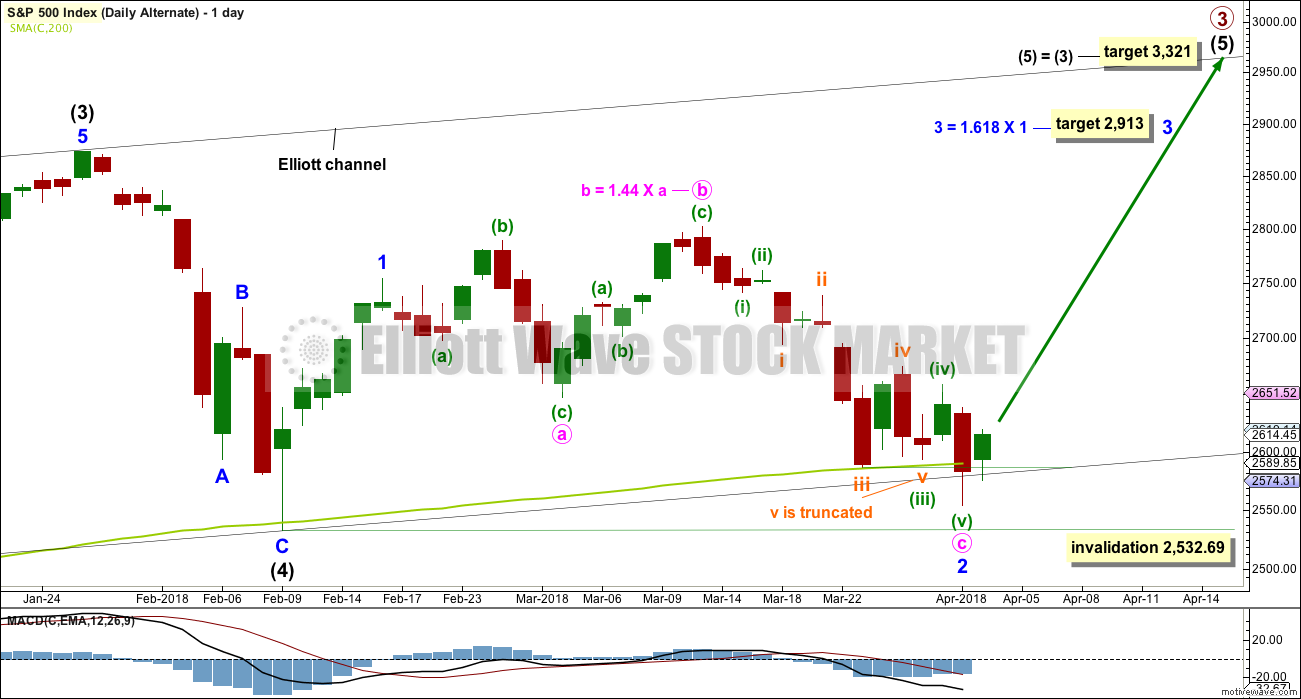
DAILY CHART – ALTERNATE
It is possible still that intermediate wave (4) was complete as a relatively brief and shallow single zigzag.
A new all time high with support from volume and any one of a bullish signal from On Balance Volume or the AD line would see this alternate wave count become the main wave count.
The target for minor wave 3 expects the most common Fibonacci ratio to minor wave 1.
Within minor wave 2, there is a truncation as noted on the chart. This must necessarily reduce the probability of this wave count.
Minor wave 2 may not move beyond the start of minor wave 1 below 2,532.69.
TECHNICAL ANALYSIS
WEEKLY CHART
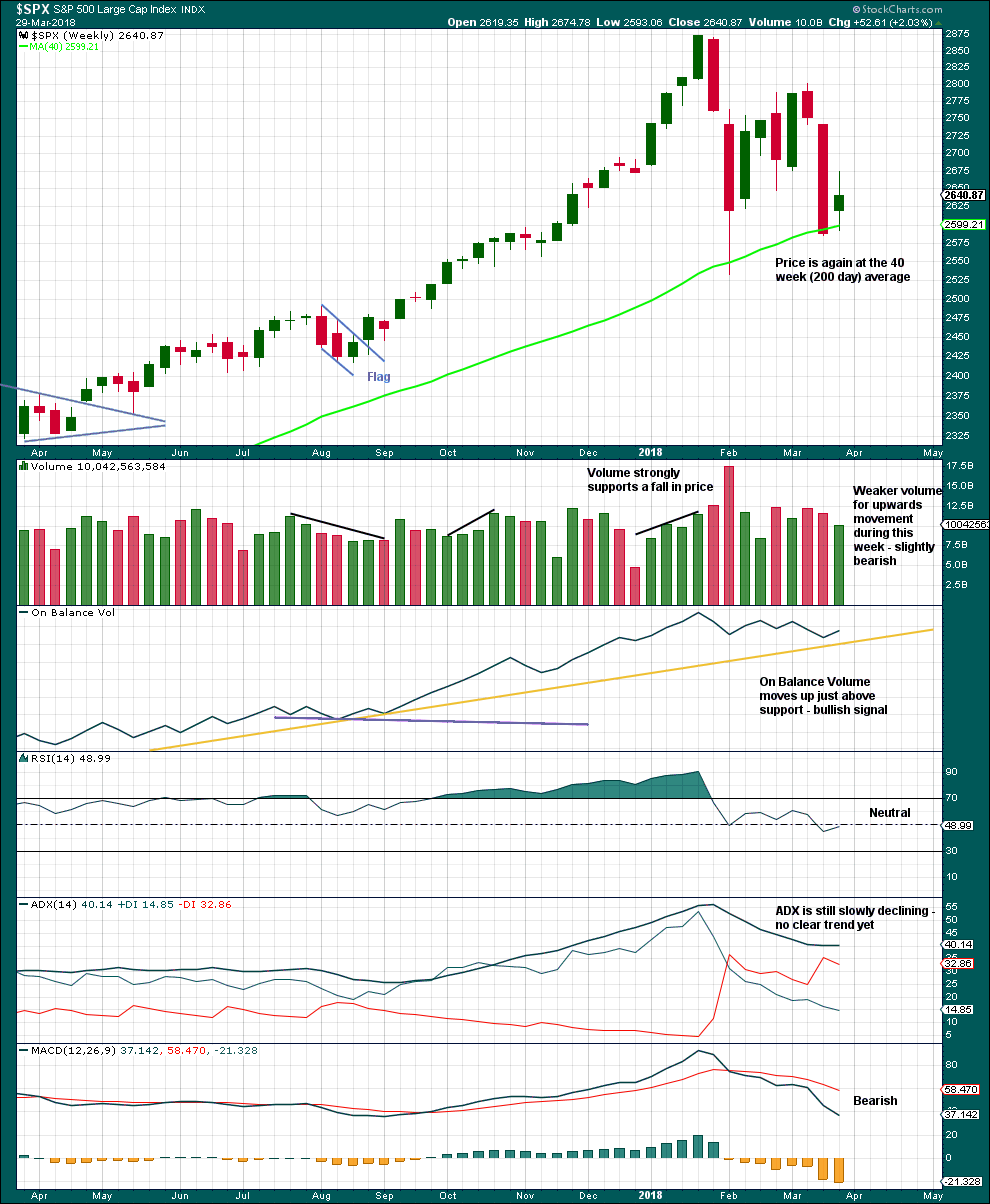
Click chart to enlarge. Chart courtesy of StockCharts.com.
Although volume last week is lighter than last two downwards weeks, this is only of slight concern. Light and declining volume has long been a feature of this bull market. It does not appear to be causing the bull market to be unsustainable, yet.
Give reasonable weight to the bullish signal from On Balance Volume, although it has not perfectly touched the support line.
It is a reasonable approach to expect the 200 day / 40 week moving average to continue to provide strong support while price is above it. Price has overshot the 200 day moving average and now returned above it. If this current week closes back above the average, then it may be expected that this area continues to provide support.
DAILY CHART

Click chart to enlarge. Chart courtesy of StockCharts.com.
While the short term volume profile is bearish, little weight will be given to that in this analysis. Weak and declining volume with rising price has been a feature of this market for some years now. Current market conditions may see this tendency may intensify as Super Cycle wave I comes to an end.
Usually a fairly reliable indicator of a low in place is a long lower candlestick wick along with bullish divergence between price and Stochastics. This is more reliable when Stochastics is oversold, and increasingly reliable when there is divergence with RSI as well. All of these conditions are met at yesterday’s low. We may be reasonably confident of a low in place.
Another long lower wick and a green daily candlestick now increases confidence of a low in place here.
VOLATILITY – INVERTED VIX CHART
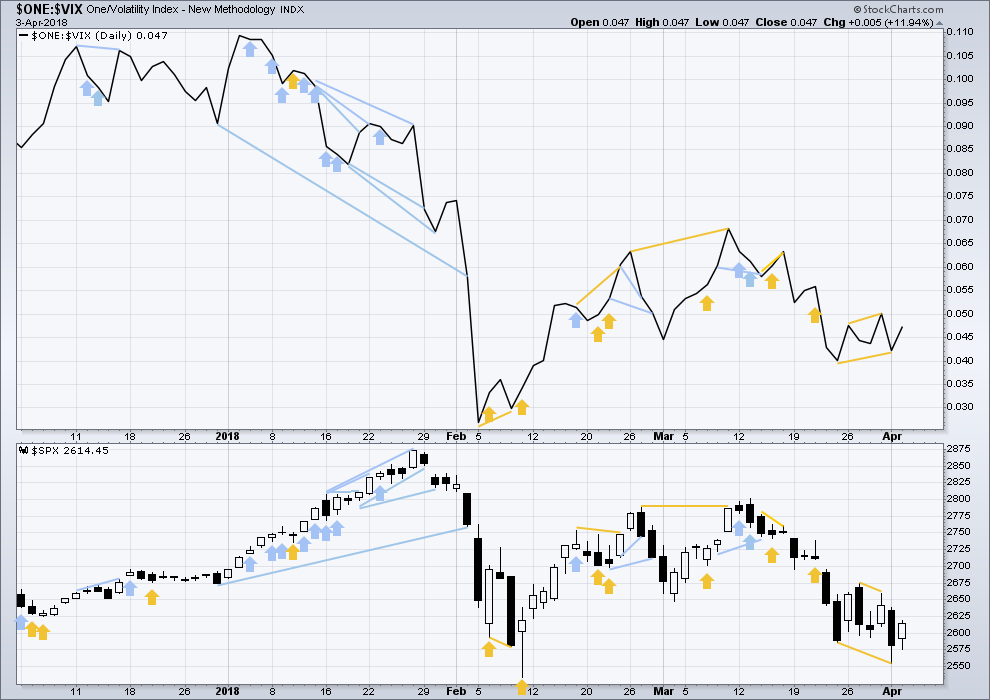
Click chart to enlarge. Chart courtesy of StockCharts.com.
So that colour blind members are included, bearish signals will be noted with blue and bullish signals with yellow.
Normally, volatility should decline as price moves higher and increase as price moves lower. This means that normally inverted VIX should move in the same direction as price.
Yesterday’s bullish divergence has now been followed by one upwards day. It may be resolved here, or it may need another upwards day to resolve it.
BREADTH – AD LINE
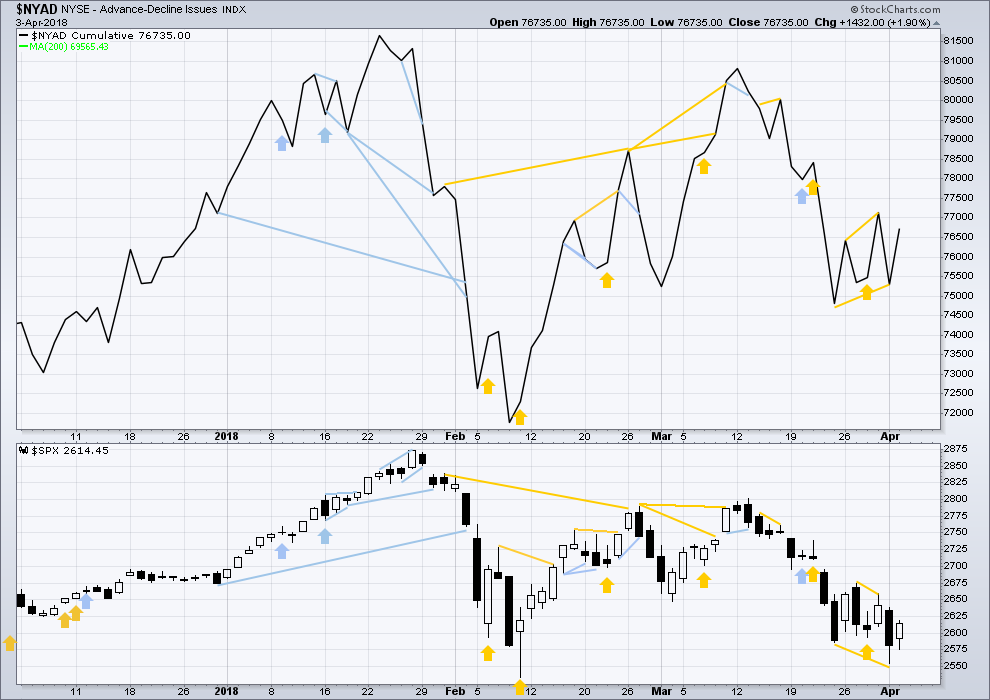
Click chart to enlarge. Chart courtesy of StockCharts.com.
There is normally 4-6 months divergence between price and market breadth prior to a full fledged bear market. This has been so for all major bear markets within the last 90 odd years. With no longer term divergence yet at this point, any decline in price should be expected to be a pullback within an ongoing bull market and not necessarily the start of a bear market.
All of small, mid and large caps last week fell strongly. The fall in price has broad support from market breadth. It was small caps though that had the least decline. This slight divergence indicates some weakness and may be interpreted as slightly bullish.
Breadth should be read as a leading indicator.
Yesterday’s bullish divergence has now been followed by one upwards day. It may be resolved here, or it may need another upwards day to resolve it.
DOW THEORY
The following lows need to be exceeded for Dow Theory to confirm the end of the bull market and a change to a bear market:
DJIA: 23,360.29.
DJT: 9,806.79.
S&P500: 2,532.69.
Nasdaq: 6,630.67.
Charts showing each prior major swing low used for Dow Theory may be seen at the end of this analysis here.
Published @ 09:05 p.m. EST.

The lord ditests dishonest scales, but accurate weights find favor with him…..proverbs 11:1….hope those people that manipulate the market know what they are really doing. Low volume on up move today, amazing since it was a huge move
I assume you have the correct volume figures. Thanks. Yes, low volume is a disappointment for a long lasting rally to begin. For a bullish one day reversal like we saw today adding strong volume really empowers the move up. Light volume would be indicative of a triangle as Lara has been showing, imo.
You’re not kidding Jerry, with no change in open short interest, they aren’t fooling anyone. I truly hope the public rids themselves of the central banks.
Loved the head fake.
Hi Kevin
What do you mean by the head fake?
The large-ish gap down open, followed by a big 5 push up. A head fake is a futbol term for juking an opponent with a head motion one way followed by a body motion the other way. Kindof faked me a bit, until I caught on to the gag.
Lol ok
With Daily Sentiment at 9% Bulls just like on Feb 8 lows could mean that we get a big rally here.
Target 1 —- 2675 – 2680
Target 2 —- 2795 – 2820
If we go below 2600 the we are heading down to 2450 – 2530 or lower
all ideas welcome.
Thank You
Looks like the end of a fifth wave up, ending a move starting from today’s lows. ABC next?
Preferred hourly wave count updated:
I hope that whipsaw down to start the session didn’t spook everyone too much. Give the market room to move.
MInuette (ii) looks like a nice expanded flat. Now in minuette (iii). Shortly the invalidation point may be able to be moved up to the high of minuette (i) at 2,606.99 but not quite yet. When minuette (iii) is complete then minuette (iv) may not move back down into minuette (i) price territory.
Onwards and upwards. But look out, there should be a pullback for minute b within this. Don’t expect this upwards swing to move in a straight line.
Excellent analysis Lara ! your words :
” Do not expect this upwards swing to move in a straight line. Look out for a pullback for a B wave within it. ”
Thank you for a nice day trade .
Awesome you’re happy with it Fred. Thanks!
Sorry about that rant folks but I was REALLY upset. I am expecting this kind of thing but not so soon. If your brokerage tries to do this to you RAISE HELL…! 🙂
I’ve rarely found a broker I love, but rather use the ones that I love just enough. Sorry they are messing with you. I was with a broker later bought by TD as well and now that account has been emptied and moved to another.
I don’t think apologies are necessary Verne. The kind of info you’ve shared here is useful for members. It’s good for them to know what brokers are up to.
I am boycotting TD Ameritrade. They recently took over OptionsXpress so I had no choice.
These criminals are becoming ever nore predatory.
They had the gall to try and tell me that wired funds to and from my accounts would be subject to a THREE BUSINESS DAY HOLD!!!
I said to them are you F…..ING CRAZY???
I guess I scared the HELL out of them so they quickly back-tracked after I said I was taking every penny out of their grubby hands.
I told them in no uncertain terms I demanded SAME DAY execution like every other respectable institution. I am so pissed I am seriously considering leaving just because they even DARED to suggest such crap. WTF!!!!
They now claim they were “backlogged”
INTERACTIVE BROKERS Verne!!! Ironically, I pulled some of our business from TD Institutional last August for those exact reasons.
Yep! I’m moving everything from TD to IAB
They are nuts if they think I am going to give them a three day float on my cash.
How is IAB? I may try that myself. Fidelity is a joke. They have frozen my account on a number of occasions when the markets make big moves down. CNBC had coverage of one of there freezes and coincidentally it was resolved within a few minutes or less. Ok , it was obviously NOT coincidental. Avoid fidelity.
spx has reached symmetry with the mar 28-29 up move.
…and turned down off that symmetric move. Just like magic.
Kudlow and the ppt are back from the reagen era.
You’re not kidding Jerry, that was an insane prop up. Par for the course until it’s not…..
Lara,
I’m just curious if there is any way to view the recent Intermediate Wave 4 as a Primary Wave 4. The only reason that I ask is that it is starting to have a very substantial “look” on the daily and weekly charts in terms of both magnitude and duration.
Thanks,
Peter
Sure, there’s always a way Peter. But IMO it doesn’t look good.
For this current correction to be moved up one degree to primary that means we’d have to find intermediate (4) somewhere in the smaller corrections prior to the last ATH.
Intermediate (2) lasted 11 weeks and corrected 110 points.
We could see intermediate (4) where I have minor 2 labelled on the weekly chart. It would then have been a single zigzag (poor alternation but still some), lasting only 4 weeks and moving 78 points.
So the problem you see is proportion between intermediate (4) and (2).
I have absolutely no problem now with the current correction. Especially if intermediate (4) turns out to be a triangle and longer lasting than intermediate wave (2)’s 11 weeks. Triangles are very often more time consuming than single and double zigzags.
On the way up to the final high for Grand Super Cycle wave I, I’ve been expecting two large corrections. So far to my eye this looks perfect as intermediate (4).
If it continues longer than 21 weeks I’ll start to get concerned.
When are they going to start raising the margin requirements on index and etc?
Thank You
So much for being free of “external events” for a few days. What was I thinking, anyway? Lol!!!! Someone’s going to write a book soon on how to toast a stock market, and the current sequence of events will be the highly successful blueprint. Hoover would be proud…
This is all on the FED…..
I guess the market chose the Alt hourly chart
we’ll im not sure, are we still on the main hourly with 2574 being (ii)?
looks like we are in (iii) now….
Not so fast. Today’s low seems to be minuette (ii). Although day started bearish, it’s turning out to become an ultra bullish scenario. Very long lower wick in SPX futures markets, and a huge mid day reversal in the cash SPX, resulting in a green engulfing candle. We haven’t seen one of these days in a while…
Wow!
Of course now it might be time to turn around and plunge 3%, lol. But I don’t think so…
I think the $SPX uptrend is very misleading last two days, as long as it is below 9MA on daily chart, there is no way to call it an uptrend from my perspective. It can only call this as side way. Also, the 2nd round of tariffs to be announced by President Trump before Friday are not factored in the price. By considering these background, the analysis summary should give a result that is still in bearish and not out of the wood. Using SMA200 as support and expect bullish, theory did not hold unfortunately.
Hi Verne,
I mean that going forward, as I think I won’t qualify as a ” Professional Trader”, that my leverage will be cut from 200:1 to 25:1 and the margin requirements will go up significantly also. I have an FXCM spread bet account.
Whilst I am an experienced trader, and have also worked in Finance all my life, I don’t have a huge account and therefore will be caught by the new restrictions coming in from ESMA applying to retail clients.
This is all because a few musicians and teachers apparently lost a lot of money on leveraged products.
In the age of the Nanny State, it seems no one is allowed to take responsibility for their own actions.
Hi Nick, even us professionals are having limits reduced. And you’re absolutely right about the nanny state, everybody is a victim and there’s no personal responsibility. Pathetic at best. Here’s to a healthy Bear Market!!
For some reason I cannot open the main hourly chart. Anyone else got this problem?
Sorry Nick, that was my mistake. I deleted it in error. It’s back now
Well it’s been good knowing you guys. Looks like ESMA has put an end to my trading ambitions – just as I was making some good money as well – the timing sucks!
Please tell us what happened Nick.
This market has given sufficiently clear signals that traders should have been doubling and tripling their accounts the last few weeks. I am always saddened to hear comments like yours from traders, especially now, and wish you all the best.
He’s talking about the increase in margin required per the regulator.
They have raised margin on some instruments by a factor of 10 and I think cryptos are at 50%.
As much as I , as a Brit, would love to say it’s down to the EU, the UK regs were looking at this also.
They obviously want to protect us from ourselves, I hope one of them is around when I try to cross the quiet country lane to where I live 3 cars per day….just in case ?