
FTSE is either ending a minor degree pullback or has had a major trend change. Classic analysis will be used to evaluate which scenario is more likely and at which price point one would be confirmed and the other discarded.
Summary: A pullback may be over here or very soon for FTSE. Assume the trend remains the same, up, until proven otherwise. This would be in some doubt only if price moves below 6,997.25.
Changes to prior analysis for FTSE are in bold.
MONTHLY ELLIOTT WAVE COUNT
Click chart to enlarge.
For clarity only one monthly chart will be presented in this analysis. The alternate I have updated does not diverge in expected direction, so at this time it adds no depth to the analysis.
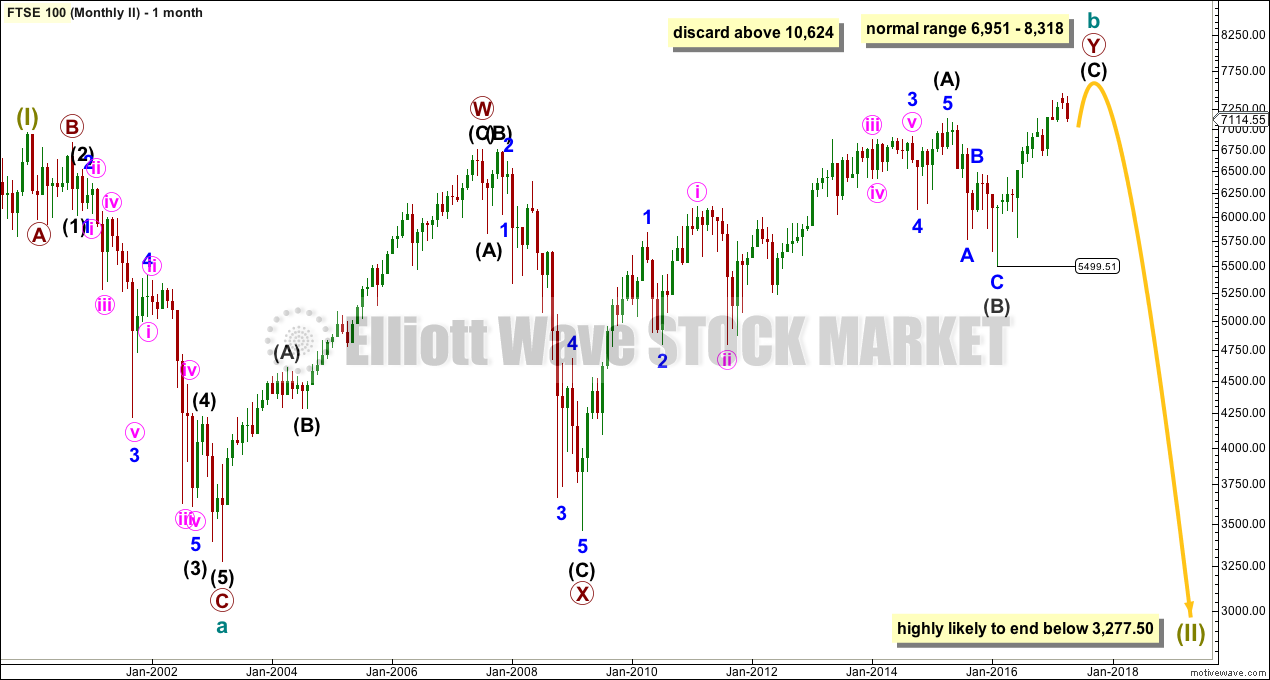
FTSE may be still within a large Super Cycle wave (II) unfolding as an expanded flat correction. These are very common structures.
Cycle wave a subdivides as a simple zigzag.
Cycle wave b may be unfolding as a double zigzag. These are also common structures for B waves.
Within the double zigzag, the second zigzag labelled primary wave Y is either complete or requires another upwards wave to complete it. These two possibilities are separated in the daily charts below.
The normal range of B waves within flats is from 1 to 1.38 the length of their respective A waves, giving a normal range for cycle wave b to end from 6,951 to 8,318. Price has reached up to within this range now.
When cycle wave b reaches 2 times the length of cycle wave a at 10,624, then the idea of an expanded flat should be discarded based upon a very low probability.
A new major swing low below 5,499.51 should be seen for Dow Theory to indicate a trend change.
WEEKLY ELLIOTT WAVE COUNT
Click chart to enlarge.
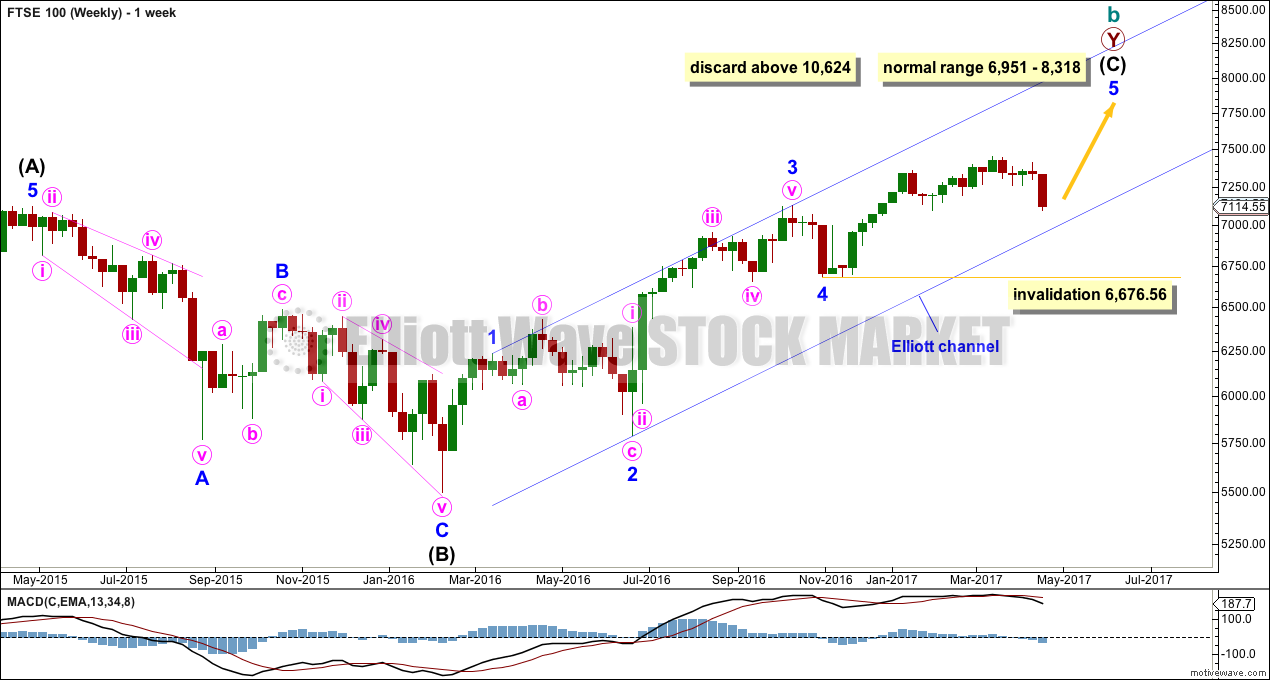
This weekly chart shows the structure of intermediate waves (B) and (C) within primary wave Y.
Within minor wave 5, no second wave correction may move beyond the start of its first wave below 6,676.56. Downwards movement should now find strong support though at the lower edge of the blue Elliott channel if this wave count is correct.
DAILY ELLIOTT WAVE COUNT
Click chart to enlarge.
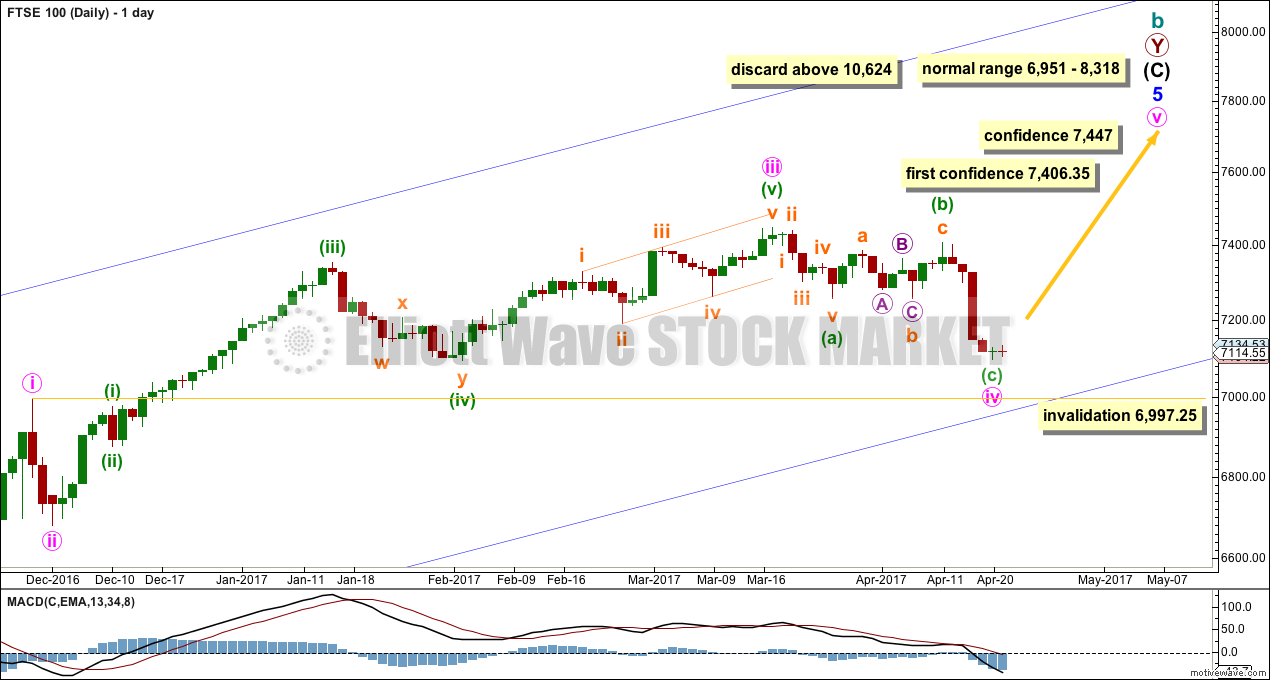
Always assume the trend remains the same until proven otherwise. Assume FTSE is still within a bull market until price proves it is not.
There is a problem with this first daily wave count: the possible ending contracting diagonal of minuette wave (v) to end minute wave iii meets all Elliott wave rules regarding wave lengths, but it does not look right. First, at their end, contracting diagonals normally have a small overshoot of the (i)-(iii) trend line but there is no overshoot. Second, the trend lines should converge but these do not; they actually diverge very slightly, which is technically a violation of the Elliott wave rule.
This wave count is published with this acknowledgement. This should reduce its probability. It is published only because at this stage I have not been able to see a resolution to this bullish wave count, and the alternate is so bearish. That does not mean a resolution is not possible.
Minute wave iv may not move into minute wave i price territory below 6,997.25.
ALTERNATE DAILY ELLIOTT WAVE COUNT

Click chart to enlarge.
It is possible at this stage to see the entire structure of cycle wave b complete. The problem with the ending diagonal seen in the main wave count is here neatly resolved.
A new trend at cycle degree should begin with a clear five down on the daily chart. This has not completed yet. This wave count should not be given serious weight until it has proven itself.
To prove itself these conditions should be met:
– A five down on the daily chart
– A new low below 6,997.25
– A breach of the bull market support line on the monthly technical analysis chart below
– A new low below 5,499.51
Cycle wave c should last one to several years. It would be extremely likely to make a reasonable new low below 3,277.5. An initial target about 1,537 would see cycle wave c reach 1.618 the length of cycle wave a, the most common Fibonacci ratio for C waves within expanded flats.
TECHNICAL ANALYSIS
MONTHLY CHART
Click chart to enlarge. Chart courtesy of StockCharts.com.
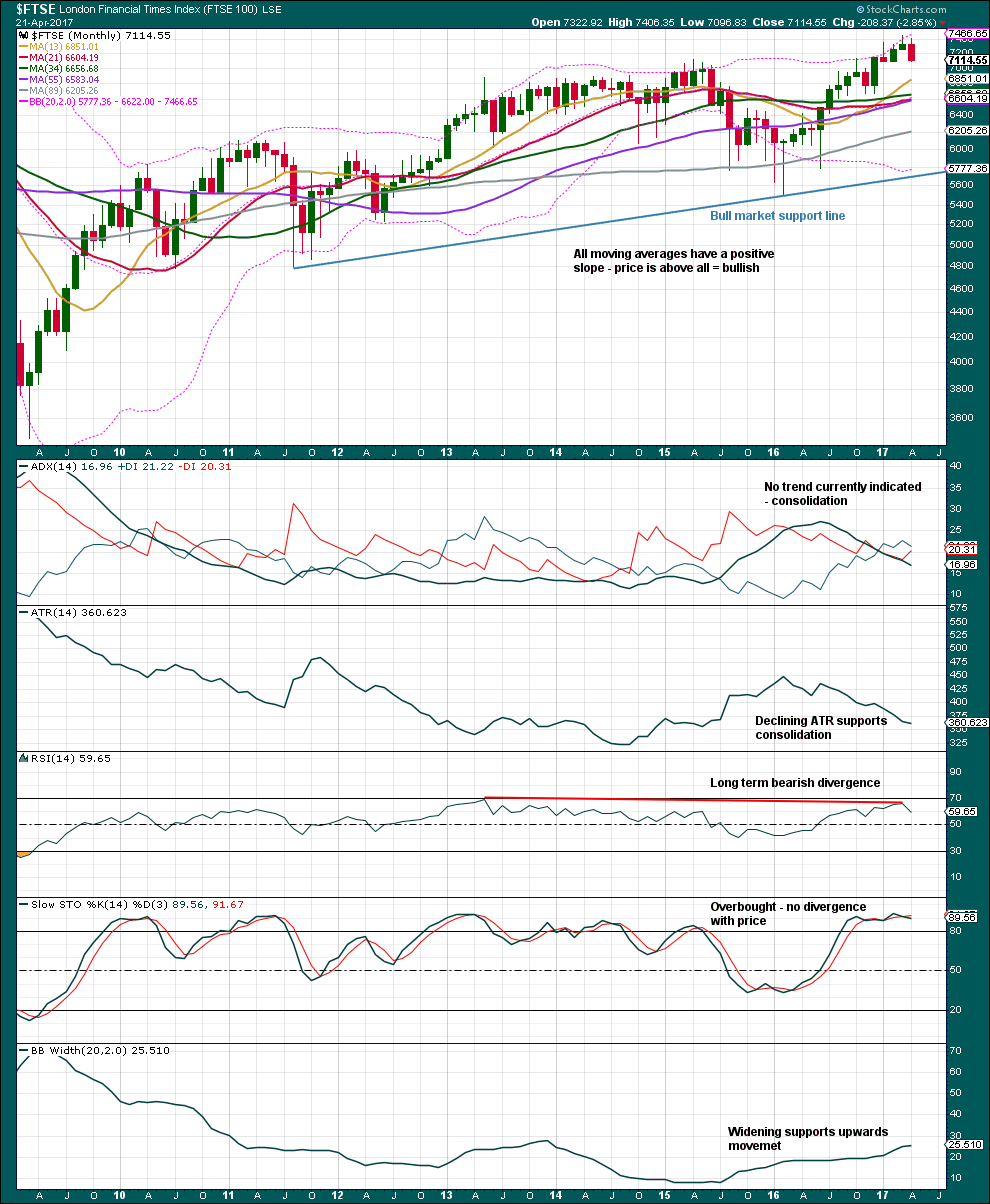
Expect the blue bull market line to offer final support while price remains above it. If this line is breached, expect a trend change from bull to bear.
Moving averages are bullish. This pullback is resolving ADX reaching extreme. There is again room for a trend to develop.
Long term RSI bearish divergence is concerning for bulls.
WEEKLY CHART
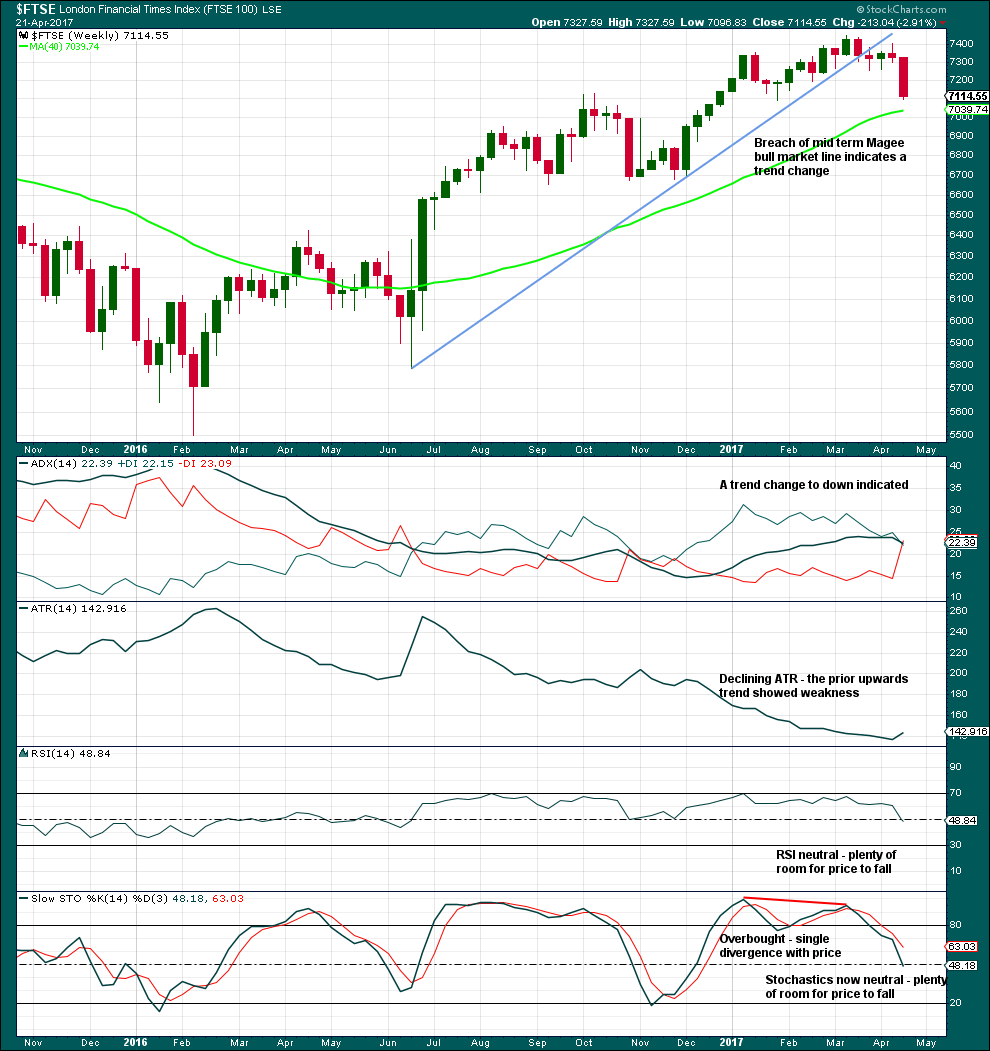
Click chart to enlarge. Chart courtesy of StockCharts.com.
A mid term pullback within the larger bull market is indicated by a breach of the mid term bull trend line.
The prior upwards trend showed weakness in declining ATR, but did not reach extreme as ADX remained below 35 and below both directional lines.
DAILY CHART
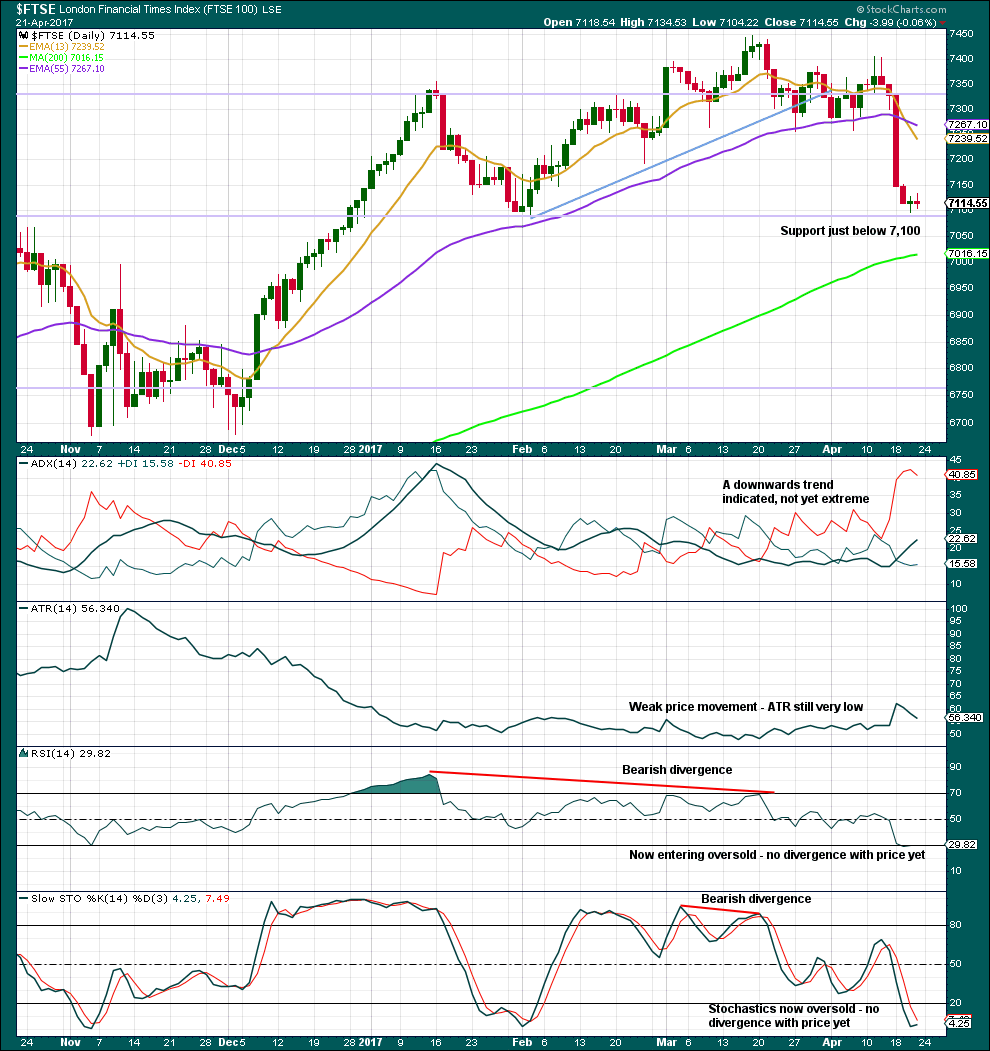
Click chart to enlarge. Chart courtesy of StockCharts.com.
With RSI now just reaching oversold and price very close to support, it would be reasonable to expect either a bounce, at least, or fairly likely an end to this pullback here. This supports the main daily Elliott wave count.
RSI and Stochastics do not always exhibit divergence with price at lows, but they very often exhibit divergence with price at highs.
This analysis is published @ 03:26 a.m. EST.