
Another possible opportunity may be coming up in another week or two for the NZDUSD pair, so it will be watched closely.
Cross posted from Elliott Wave Gold.
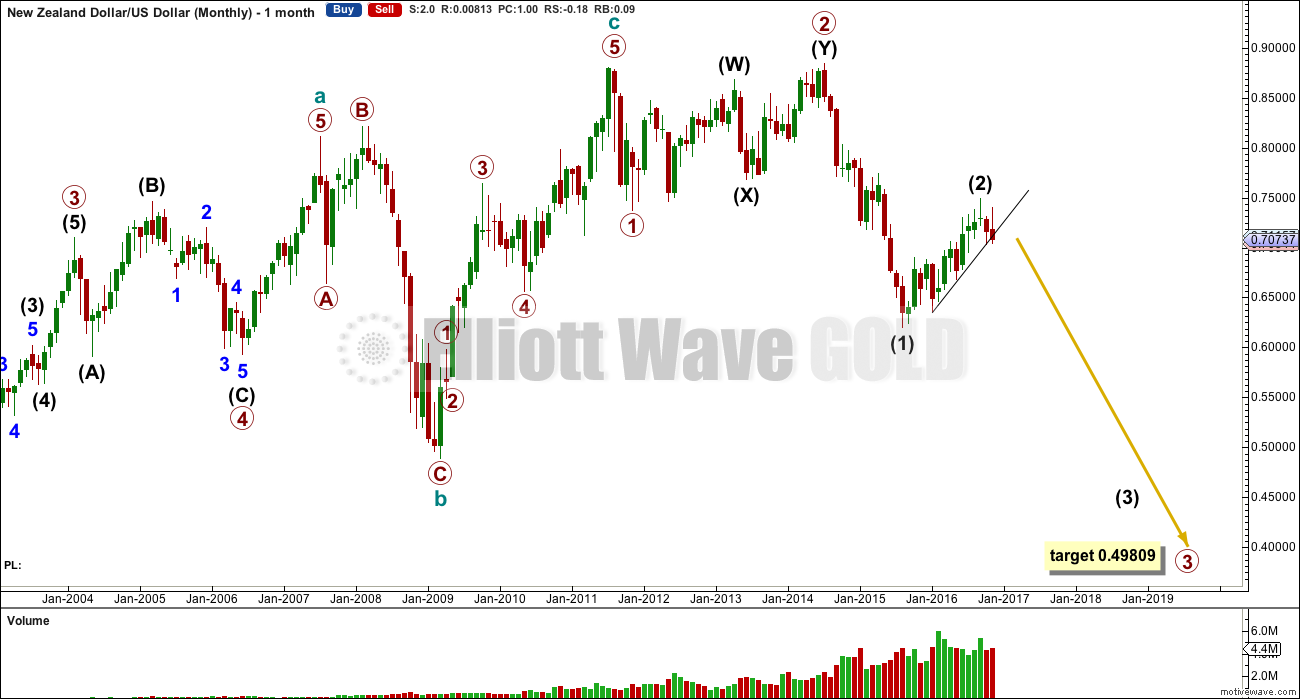
Summary: The larger trend still looks down. The Elliott wave long term target is still 0.49809, but that is many months away. A mid term trade set up may be unfolding over the next few days to a couple of weeks.
ELLIOTT WAVE COUNT
Click chart to enlarge.
The low of primary wave 1 is 0.73706. With the recent high labelled intermediate wave (2) at 0.74857, this current upwards movement cannot be a fourth wave correction. Therefore, primary wave 3 must be still unfolding.
This means for the Elliott wave count that two first and second waves may now be complete. This pair may now be ready to move into the strongest portion of downwards movement, the middle of a third wave.
A significant trend line across the lows of intermediate wave (2) has now been breached on the daily chart.
TREND LINES
Click chart to enlarge.
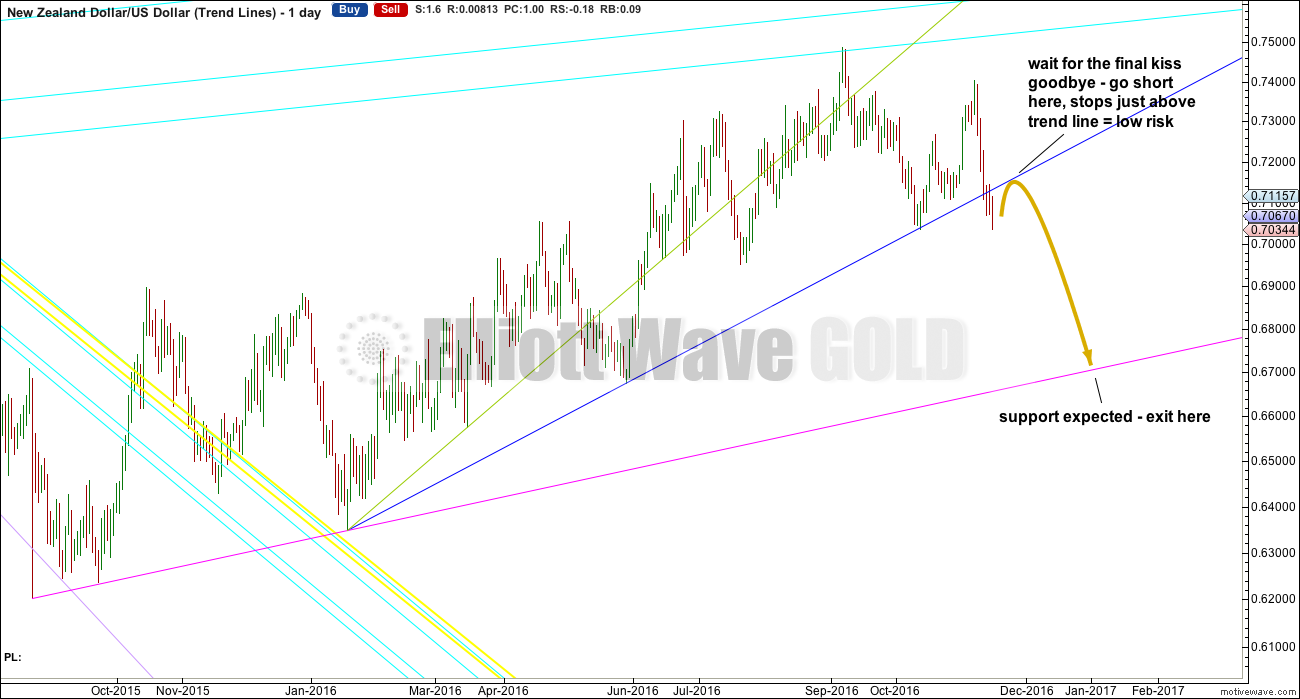
The dark blue trend line is drawn from the first major low within intermediate wave (2), the low at 0.63475 on the 20th of January, 2016, to the next major swing low at 0.6674 on the 30th of May, 2016. It was tested once again on the 13th of October, 2016.
Price slowed down as it broke through this line in the last few days. Now there is a full daily candlestick below and not touching the line.
It would be typical behaviour of price to see some upwards reaction with one or a few green daily candlesticks or doji, as price comes up to test resistance at this line. This would be the final kiss goodbye if that line holds.
The upwards reaction and test may take a few days to a couple of weeks. I will be watching this pair carefully in this time to see what happens.
A short position may be held until price finds support at the next line.
The pink line is drawn from the start of intermediate wave (2) at 0.62021 on the 24th of August, 2015, to the first major swing low within it. This line is less steep. It should provide strong support if price gets down to it, so a multi week bounce may be expected there.
Risk to this idea today: the blue line which is being used for the trade set up is relatively steep and only tested three times. It does not have strong technical significance. It is possible that price may behave here like it did with the green line: a breach and retest may see only a little downwards movement before price turns up and moves back above the line.
Always use stops. There is always a risk that the analysis is wrong, that something has been missed, that the market simply will do something new. Nothing is ever certain in technical analysis or trading, so risk management is the biggest difference to success or failure.
Do not invest more than 3-5% of equity on any one trade. Always use a stop to protect your account. Trading without stops exposes your full equity to risk.
TECHNICAL ANALYSIS
Click chart to enlarge.
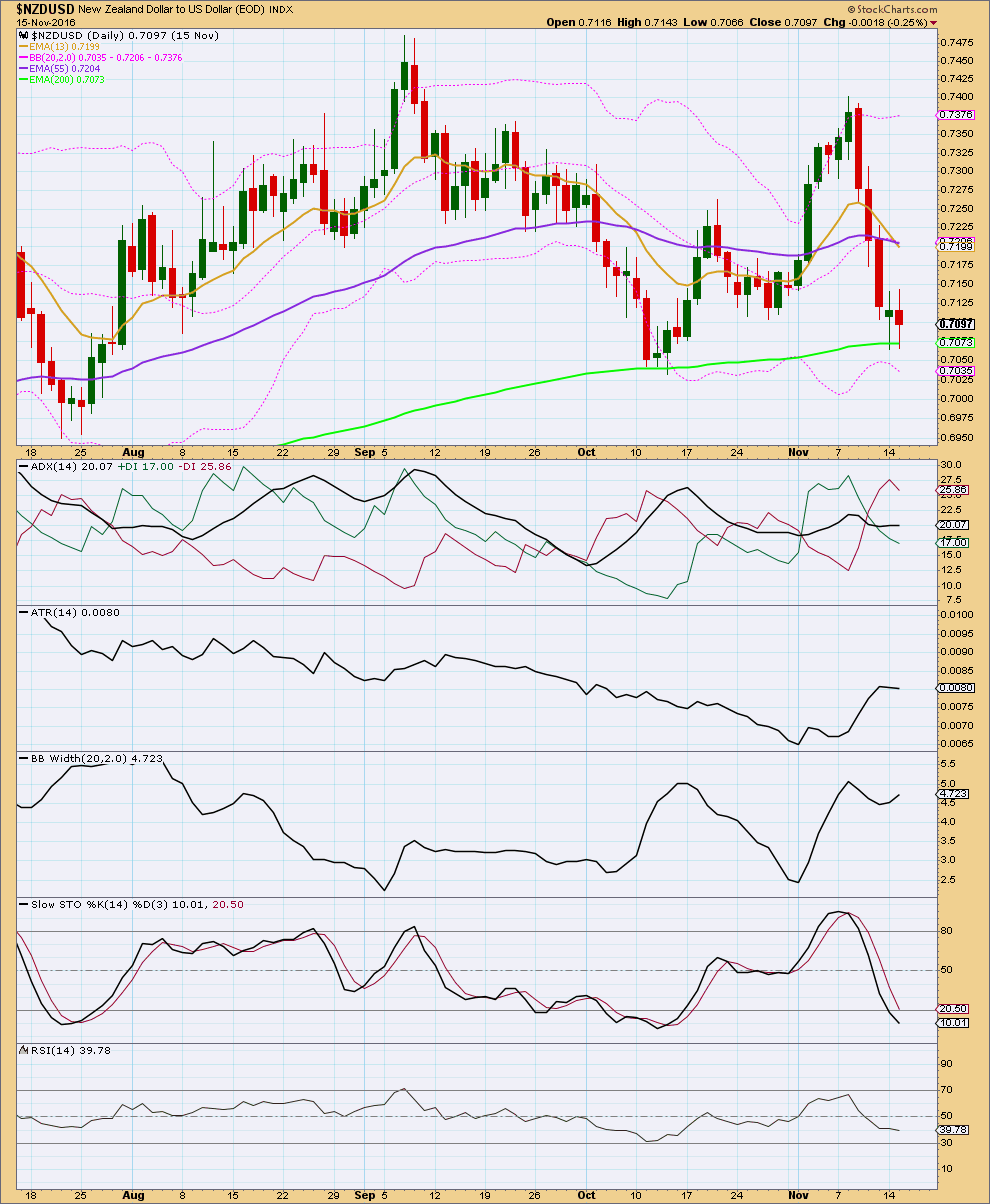
NZDUSD has reacted with a downwards movement after reaching extreme and sitting about the upper edge of Bollinger Bands for six days. Now it is approaching the lower edge of Bollinger Bands.
Price may find some support here about the 200 day moving average.
The short term Fibonacci 13 day moving average is crossing below the mid term Fibonacci 55 day moving average. This downwards movement may be a mid term trend change.
ADX is slightly increasing, indicating a trending market. ATR today disagrees as it is slightly declining. Bollinger Bands indicate a trend as they widen. Overall, it is not clear today if this market is still trending downwards.
Stochastics is reaching oversold. With a trend unclear, some upwards reaction may unfold here.
RSI has not reached extreme. There is some very small divergence at the last low with price and RSI to indicate bears may be tired and need a rest here.
Overall, this technical analysis agrees mostly with the trend line analysis. Wait for the trade set up; this may not be a good entry point. The mid term trend is down, but the larger trend may not be. In this case, the Elliott wave count may pre-empt the trend line analysis.
This analysis is published @ 05:55 p.m. EST.