A new low below 2,130.19 invalidated the main hourly Elliott wave count and confirmed the alternate hourly Elliott wave count.
At that stage, downwards movement was expected to move slightly below 2,124.43, finding support at the lilac trend line. Price found its low for Friday’s session right on the trend line.
Summary: Upwards movement is expected for next week to a target at 2,175. Price should find very strong support at the lilac trend line, and each time price touches this line it should be used as a buying opportunity. This possible entry point has a low risk mid reward and stops may be set a little below the line. Always use stops, even if only mental, and never invest more than 3-5% of equity on any one trade. This bullish outlook is supported this week by Lowry’s analysis of internal market strength.
Last monthly chart for the main wave count is here.
New updates to this analysis are in bold.
MAIN WAVE COUNT
WEEKLY CHART
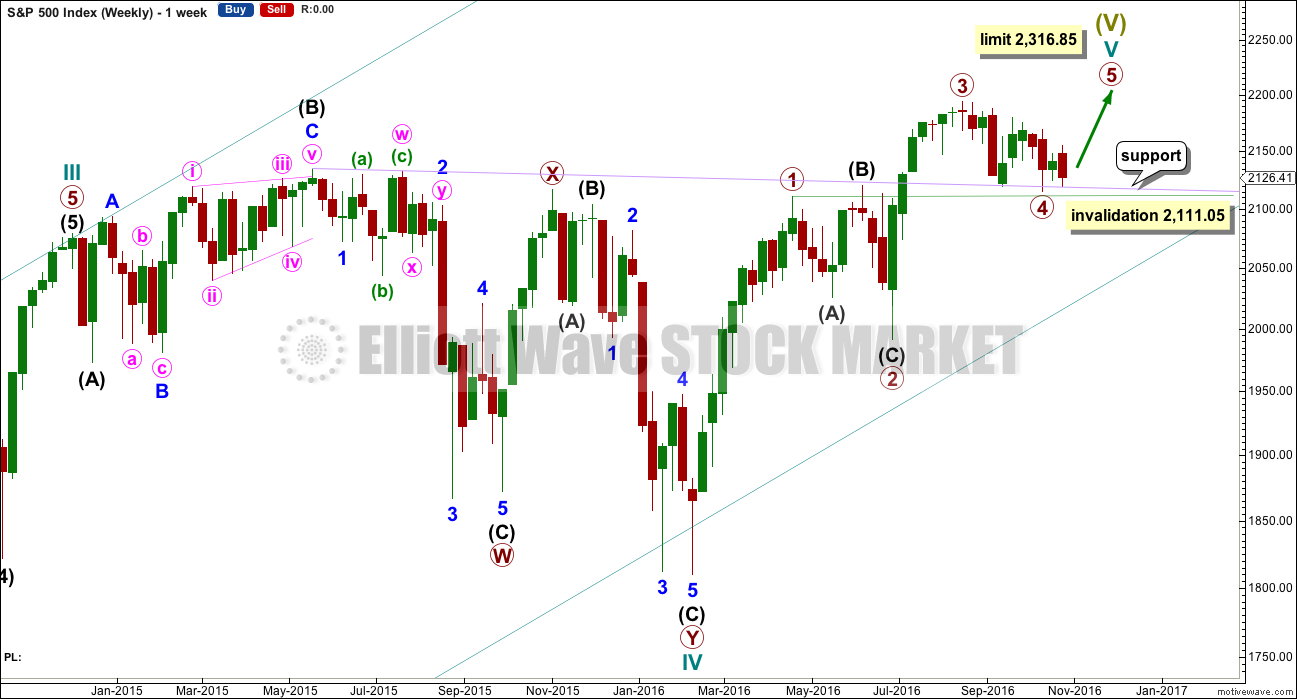
Cycle wave V must subdivide as a five wave structure. I have two wave counts for upwards movement of cycle wave V. This main wave count is presented first because we should assume the trend remains the same until proven otherwise. Assume that downwards movement is a correction within the upwards trend, until proven it is not.
Primary wave 3 is shorter than primary wave 1, but shows stronger momentum and volume as a third wave normally does. Because primary wave 3 is shorter than primary wave 1 this will limit primary wave 5 to no longer than equality in length with primary wave 3, so that the core Elliott wave rule stating a third wave may not be the shortest is met. Primary wave 5 has a limit at 2,316.85.
Primary wave 2 was a shallow 0.40 expanded flat correction. Primary wave 4 may have ended as a shallow 0.39 double zigzag. There is no alternation in depth, but there is good alternation in structure.
Primary wave 4 may not move into primary wave 1 price territory below 2,111.05.
It is also possible to move the degree of labelling within cycle wave V all down one degree. It may be only primary wave 1 unfolding. The invalidation point for this idea is at 1,810.10. That chart will not be published at this time in order to keep the number of charts manageable. The probability that this upwards impulse is only primary wave 1 is even with the probability that it is cycle wave V in its entirety.
When the five wave structure upwards labelled primary wave 5 is complete, then my main wave count will move the labelling within cycle wave V all down one degree and expect that only primary wave 1 may be complete. The labelling as it is here will become an alternate wave count. This is because we should always assume the trend remains the same until proven otherwise. We should always assume that a counter trend movement is a correction, until price tells us it’s not.
DAILY CHART
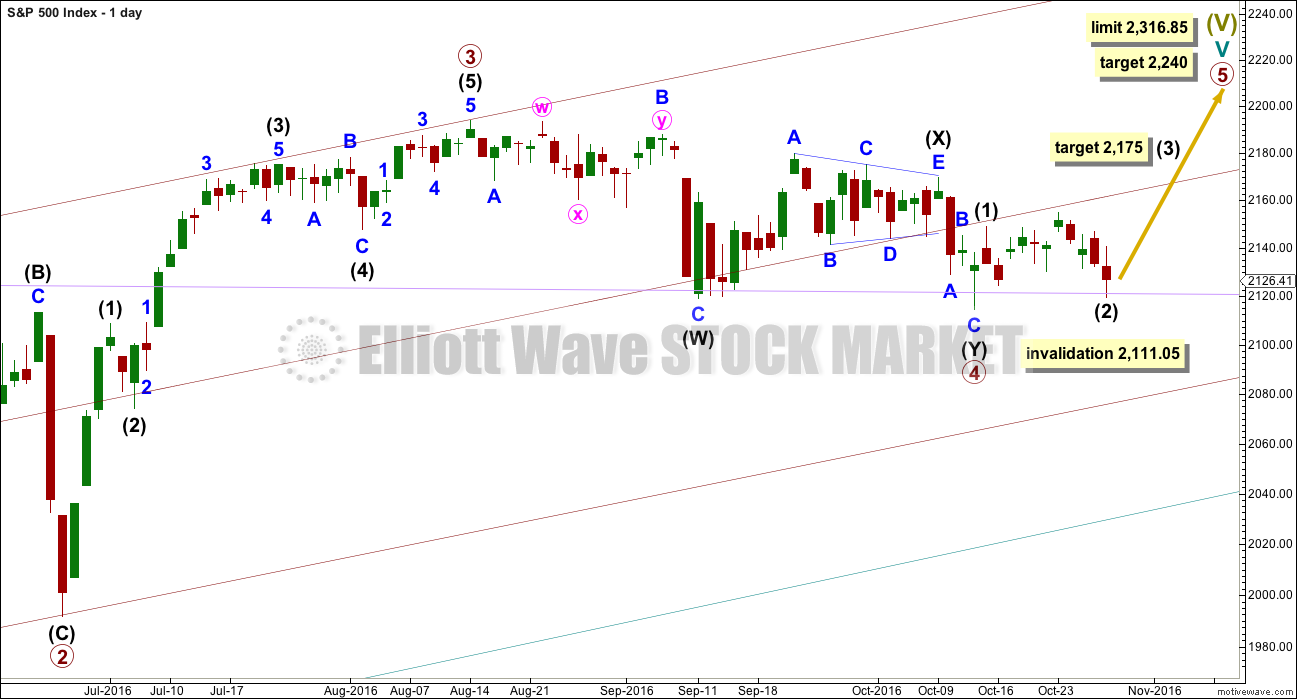
Primary wave 3 is 16.14 points longer than 0.618 the length of primary wave 1. This is a reasonable difference. But as it is less than 10% the length of primary wave 3, it is my judgement that it is close enough to say these waves exhibit a Fibonacci ratio to each other.
If this pattern continues, then about 2,240 primary wave 5 would reach 0.618 the length of primary wave 3. If this target is wrong, it may be too high. When intermediate waves (1) through to (4) are complete, then the target may be changed as it may be calculated at a second degree.
Within cycle wave V, so far primary wave 3 is shorter than primary wave 1 in length. So that the rule stating a third wave may not be the shortest is met, this limits primary wave 5 to no longer than equality in length with primary wave 3 at 2,316.85.
There is good proportion for this wave count. Primary wave 1 lasted 46 days, primary wave 2 lasted 47 days, primary wave 3 lasted a Fibonacci 34 days, and primary wave 4 lasted 42 days. So far primary wave 5 has lasted eleven days. With the very slow pace of primary wave 5 so far, if it exhibits a Fibonacci duration when complete, that may now be a Fibonacci 21 days and that would see it end on the 10th of November (give or take one day either side).
Primary wave 4 fits perfectly as a double zigzag. The second zigzag in the double should have ended with a small overshoot of the lilac trend line. This line should provide very strong support. There is almost no room left for primary wave 4 to move into.
If primary wave 4 continues any further, it may not move into primary wave 1 price territory below 2,111.05.
Primary wave 5 must be a five wave structure, so it is most likely to be a simple impulse. It would be very likely to make at least a slight new high above the end of primary wave 3 at 2,193.81 to avoid a truncation. At this stage, it still looks more like an impulse rather than an ending diagonal. But if it starts to unfold in a series of zigzags, then a diagonal will be charted as well. Fifth waves are more commonly impulses than ending diagonals.
Because primary wave 5 must be shorter in length than primary wave 3, each of its sub-waves should be shorter in length and duration. For this reason intermediate waves (1) and (2) are labelled as complete within primary wave 5. Intermediate wave (2) may have ended when price came to slightly overshoot the lilac trend line on Friday.
HOURLY CHART
This wave count was presented in last analysis as an alternate. With the main idea invalidated below 2,130.19, this is now the only hourly wave count left for the main daily wave count.
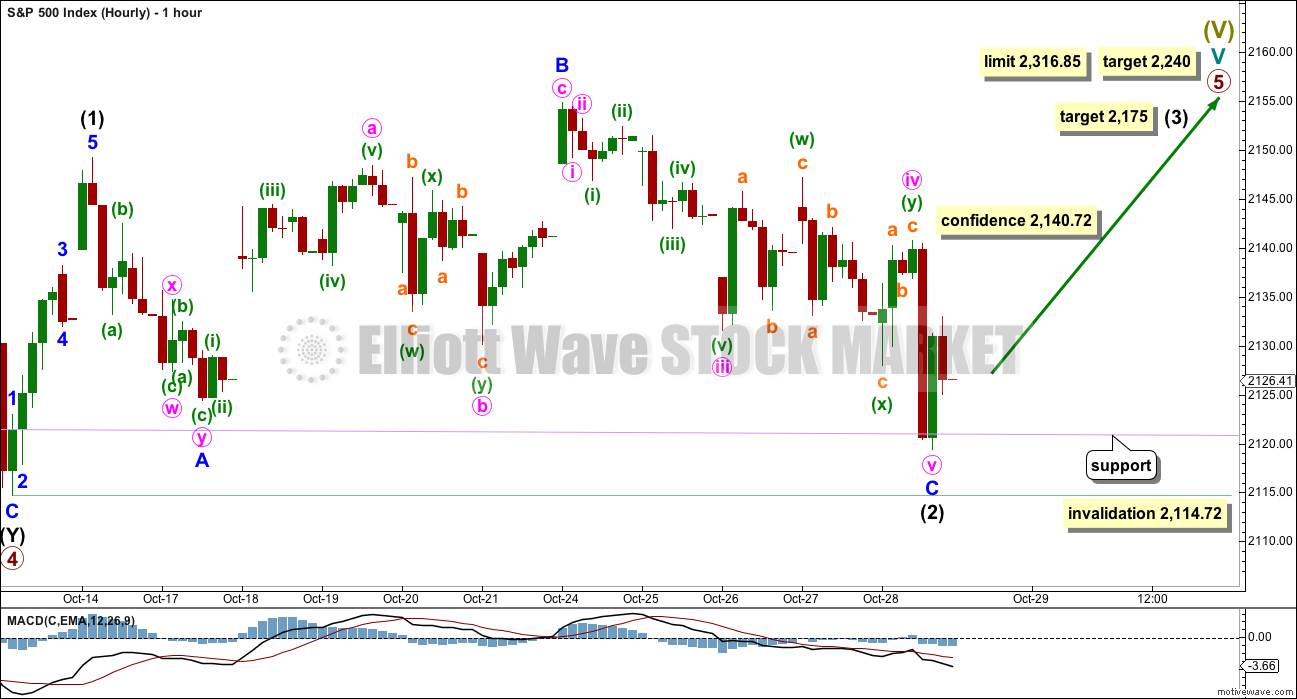
Intermediate wave (2) may have ended on Friday as an expanded flat correction.
Minor wave A fits as a double zigzag, which is classified as a three. Minor wave B fits as a zigzag and is a 1.23 length of minor wave A, within the normal range of 1 to 1.38.
Minor wave C has ended below the end of minor wave A at 2,124.43 avoiding a truncation.
The structure of minor wave C is difficult to see as a five wave impulse, but it does fit correctly on the five and one minute charts. There is disproportion between minute waves ii and iv within it, giving this movement a three wave look. All Elliott wave rules are met. This has been checked carefully on the five minute chart.
Downwards movement should be expected to find very strong support at the lilac trend line, which is copied over here from weekly and daily charts. This line is almost horizontal, very long held, and repeatedly tested. It offers very strong technical significance. This line must be clearly breached for a more bearish outlook to have any weight. Expect price to bounce up from here while it remains above this trend line. This line strongly supports this wave count.
ALTERNATE WAVE COUNT
WEEKLY CHART
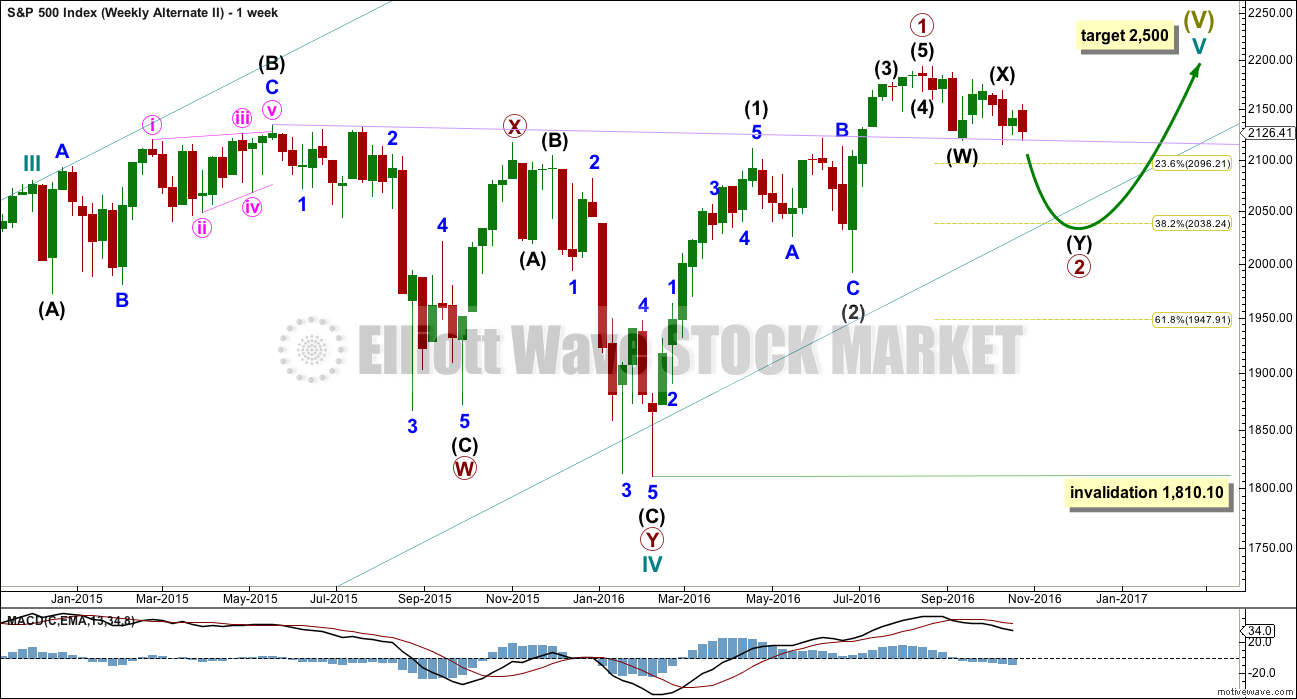
What if an impulse upwards is complete? The implications are important. If this is possible, then primary wave 1 within cycle wave V may be complete.
With downwards movement from the high of primary wave 1 now clearly a three and not a five, the possibility that cycle wave V and Super Cycle wave (V) are over has substantially reduced. This possibility would be eliminated if price can make a new all time high above 2,193.81.
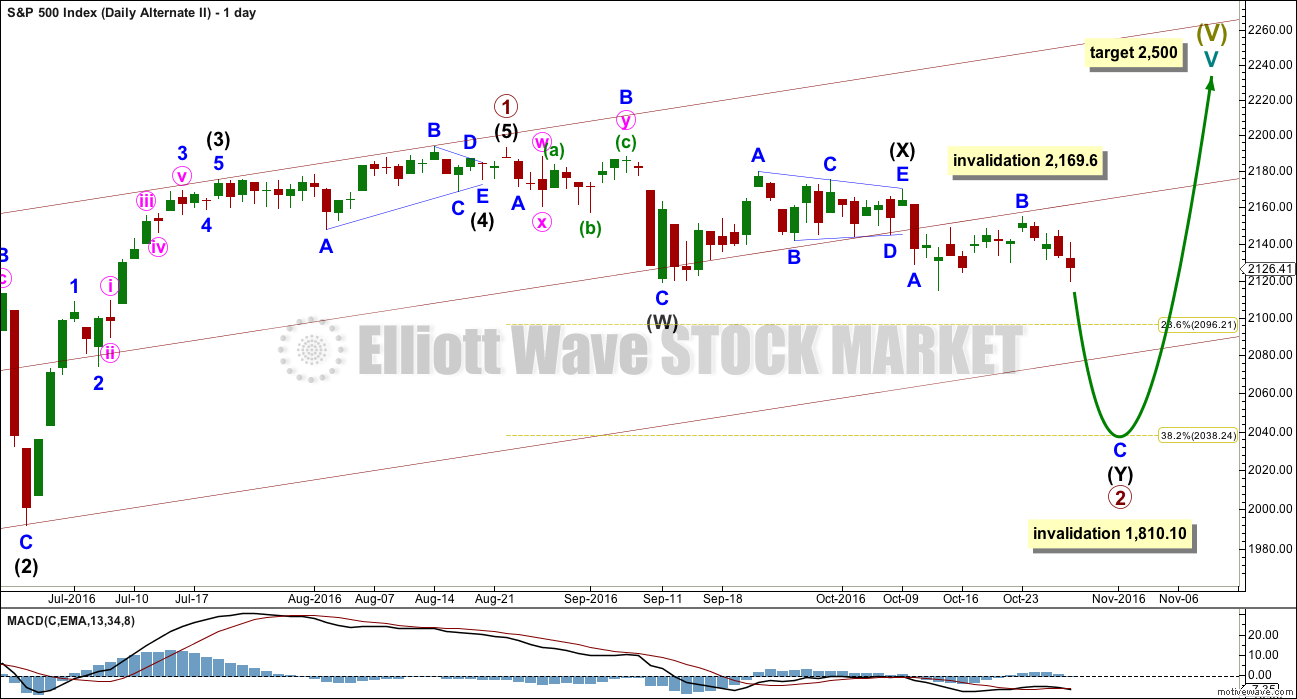
If an impulse upwards is complete, then a second wave correction may be unfolding for primary wave 2. Expectations on how deep primary wave 2 is likely to be are now adjusted. It may be expected now to more likely only reach the 0.382 Fibonacci ratio about 2,038.
At this stage, it looks like price has found strong support at the lilac trend line.
Primary wave 2 may not move beyond the start of primary wave 1 below 1,810.10.
DAILY CHART
If an impulse upwards is complete, then how may it subdivide and are proportions good?
Intermediate wave (1) was an impulse lasting 47 days. Intermediate wave (2) was an expanded flat lasting 47 days. Intermediate wave (3) fits as an impulse lasting 16 days, and it is 2.04 points short of 0.618 the length of intermediate wave (1). So far this alternate wave count is identical to the main wave count (with the exception of the degree of labelling, but here it may also be moved up one degree).
Intermediate wave (4) may have been a running contracting triangle lasting 22 days and very shallow at only 0.0027 the depth of intermediate wave (3). At its end it effected only a 0.5 point retracement. There is perfect alternation between the deeper expanded flat of intermediate wave (2) and the very shallow triangle of intermediate wave (4). All subdivisions fit and the proportion is good.
Intermediate wave (5) would be very brief at only 18.29 points. Intermediate wave (5) is 1.43 points longer than 0.056 the length of intermediate wave (1).
At this stage, primary wave 2 now has a completed zigzag downwards that did not reach the 0.236 Fibonacci ratio. It is very unlikely for this wave count that primary wave 2 is over there; the correction is too brief and shallow. Upwards movement labelled intermediate wave (X) is so far less than 0.9 the length of the prior wave down labelled intermediate wave (W). The minimum for a flat correction has not been met. Primary wave 2 may continue lower as a double zigzag. A second zigzag in the double may be required to deepen the correction closer to the 0.382 Fibonacci ratio.
Intermediate wave (W) lasted a Fibonacci 13 sessions. Intermediate wave (X) is a complete triangle. X waves may subdivide as any corrective structure (including multiples), and a triangle is possible here.
If minor wave B within the second zigzag of intermediate wave (Y) moves any higher, it may not move beyond the start of minor wave A above 2,169.60.
Primary wave 2 may not move beyond the start of primary wave 1 below 1,810.10. A new low below this point would see the degree of labelling within cycle wave V moved up one degree. At that stage, a trend change at Super Cycle degree would be expected and a new bear market to span several years would be confirmed.
HOURLY CHART
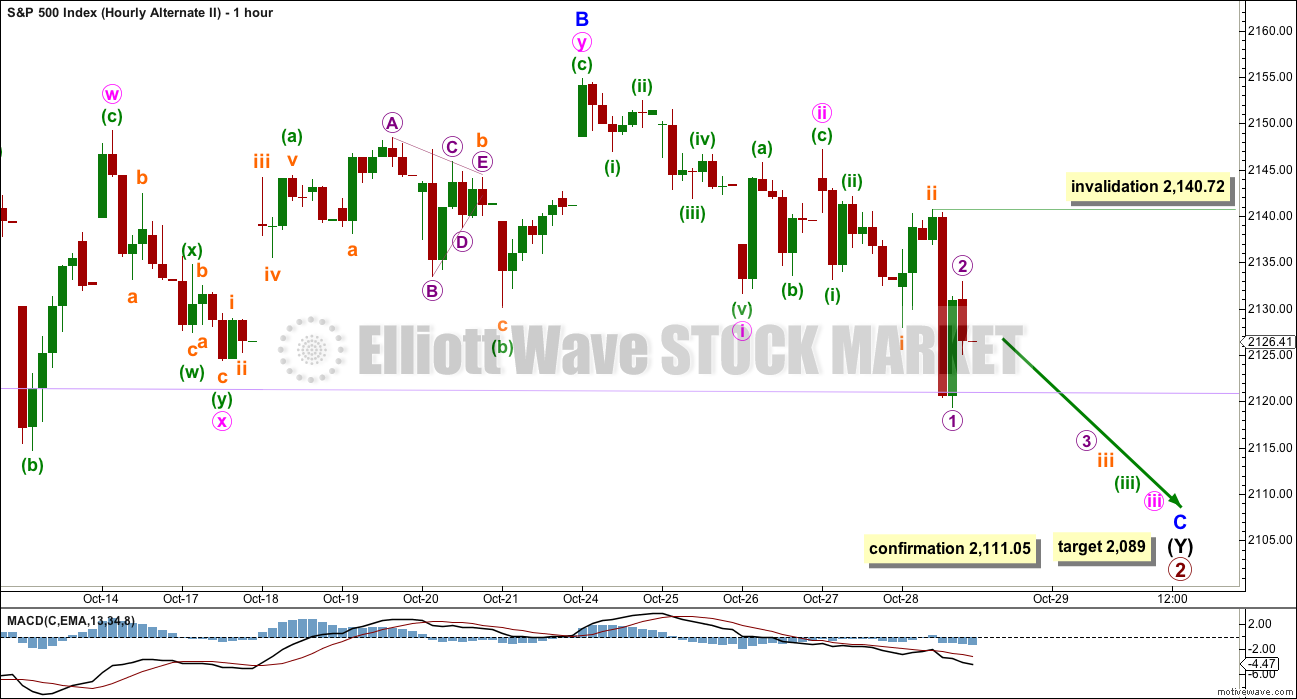
Intermediate wave (Y) should subdivide as a zigzag to deepen the correction.
Minor wave B may have completed as a double combination: flat – X – zigzag.
While the subwaves of W, Y and Z within combinations may be only simple corrective structures, X waves may be any type of corrective structure including a multiple. The maximum number of corrections within a multiple is three, so this rule applies to W, Y and Z and not to the X waves which move in the opposite direction and join the corrective structures within a multiple.
Minute wave x subdivides as a double zigzag in this case, and the rule is met: there are only two corrective structures in this multiple with one X wave joining them.
At 2,089 minor wave C would reach 1.618 the length of minor wave A. This would take intermediate wave (Y) somewhat below the end of intermediate wave (W), achieving its purpose of deepening the correction.
This wave count requires confirmation with a new low below 2,111.05 before it should be used.
Prior to that price confirmation, this wave count would substantially increase in probability if price breaks clearly and cleanly below the lilac trend line. Since price broke above this line on the 8th of July, 2016, it has provided very strong support. It has been six times now and has not yet had an hourly candlestick fully below and not touching the line. It has been overshot but not breached. If a full hourly candlestick prints fully below the line, that would be the earliest signal that this alternate may be correct and a deeper more sustained correction is underway.
Within minor wave C, there may now be a series of four overlapping first and second waves. At the hourly chart level, this wave count does have a slightly better fit for this piece of downwards movement than the main hourly wave count does. This wave count now expects to see strong downwards movement on Monday and Tuesday as the middle of a third wave down unfolds. If this wave count is correct, it should be confirmed early next week.
TECHNICAL ANALYSIS
WEEKLY CHART
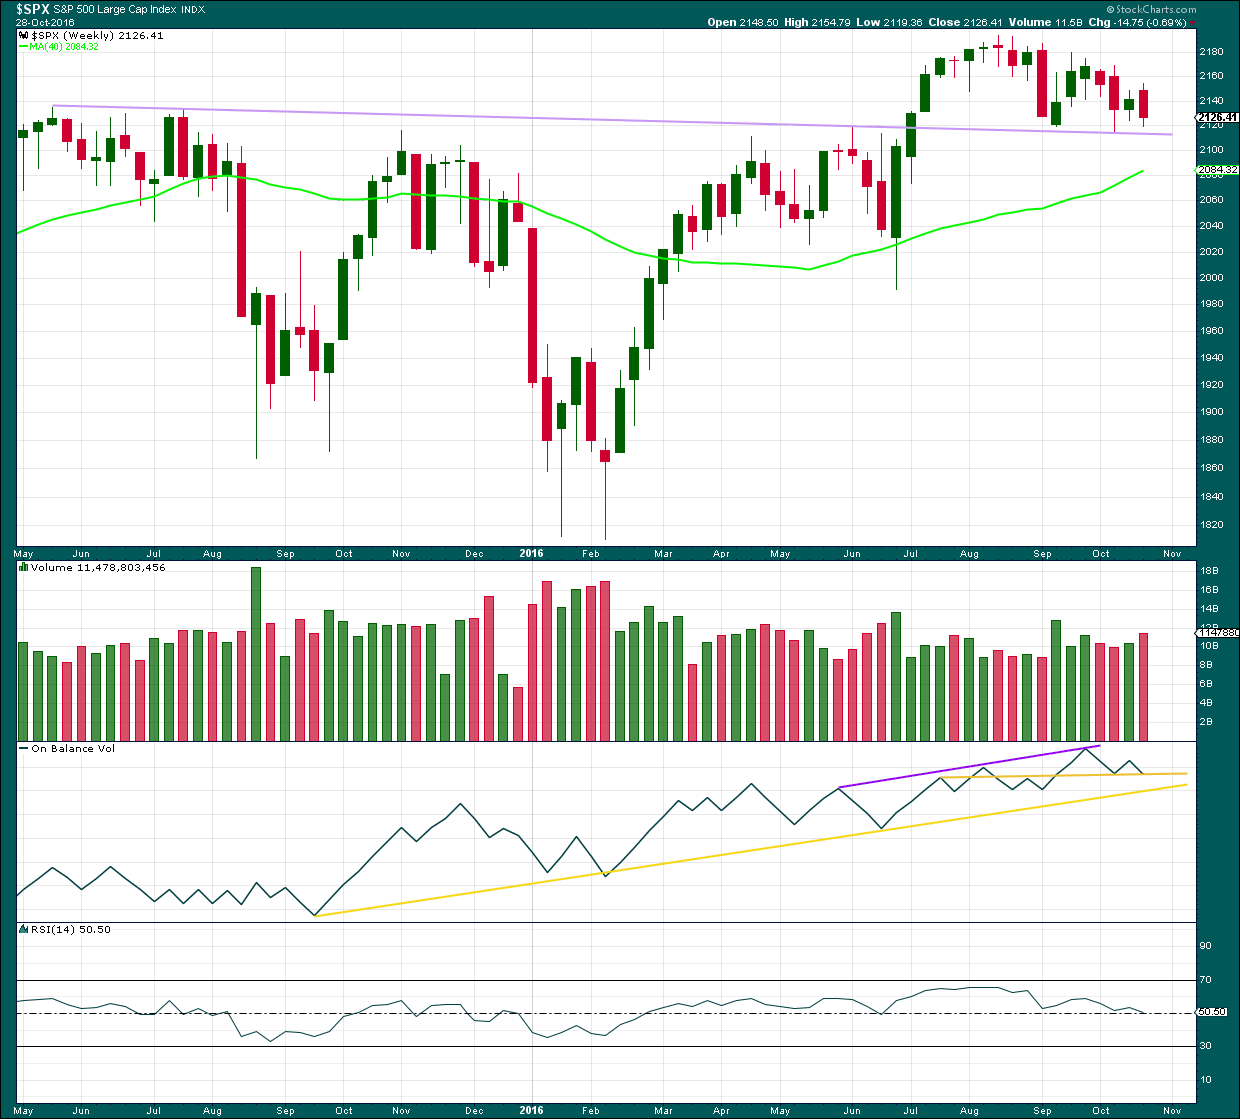
Click chart to enlarge. Chart courtesy of StockCharts.com.
The lilac trend line has strong technical significance. Price broke through resistance, turned down to test support for the first time, and then moved up and away from this line. It was reasonable to conclude that a new all time high is a likely consequence of this typical behaviour.
Now price has come back down for a third test of the lilac trend line. This line is expected to continue to provide support because support at this line is so strong. A break below this line would be a highly significant bearish signal.
This downwards week closes red and has support from volume. Increased volume this week is bearish.
At the weekly chart level, On Balance Volume may find support here at the horizontal yellow trend line, which may halt a further fall in price. This support line on OBV in conjunction with the lilac support line for price are strong indicators that downwards movement is very likely to be over.
RSI is still close to neutral. There is plenty of room for price to rise further.
DAILY CHART
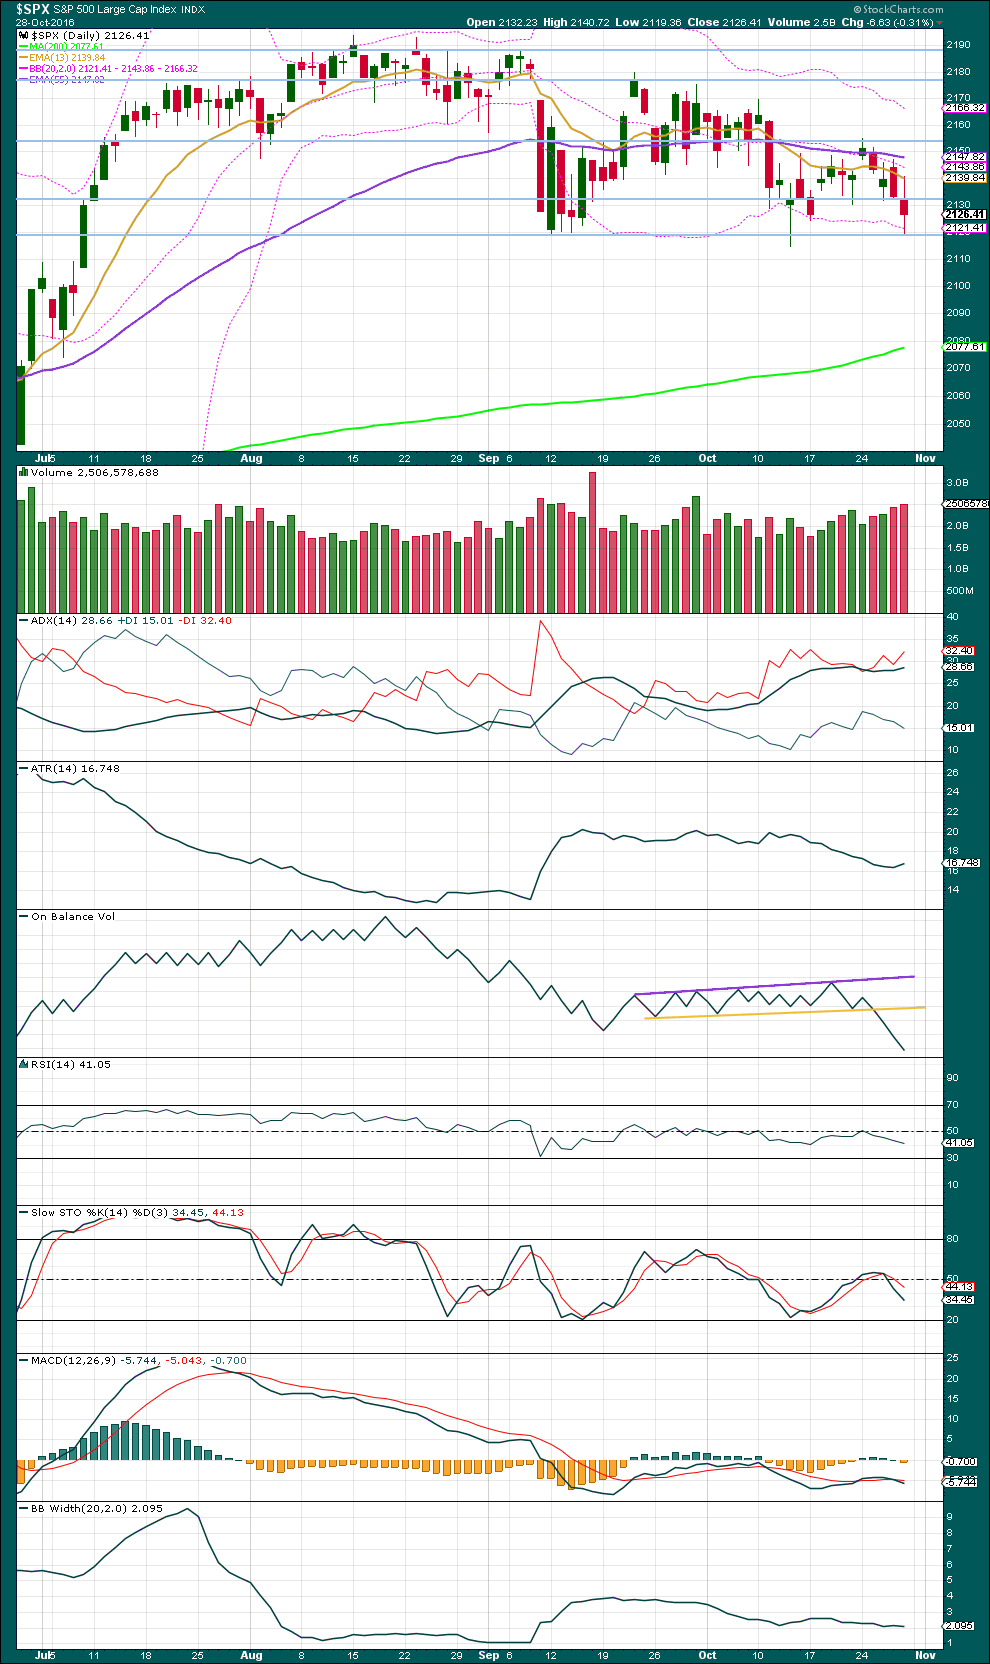
Click chart to enlarge. Chart courtesy of StockCharts.com.
Price has been falling overall now for four days, and volume is rising as price is falling. The fall in price is supported by volume, so this is bearish and supports the alternate Elliott wave count over the main Elliott wave count.
Price may find strong support here about 2,120 and at the lilac trend line (not shown on this chart, refer to the Elliott wave charts). This support favours the main Elliott wave count over the alternate.
ADX is increasing, indicating the market is trending downwards. However, most concerning for Bears, this does not look like a normal healthy trend. ATR is overall still declining and Bollinger Bands are still steady and not widening. This trend lacks range and volatility, and it is not healthy. With price touching the lower edge of the Bollinger Bands on Friday, this should also offer support and a bounce about here would be typical behaviour.
Friday’s candlestick is a spinning top. It has long upper and lower wicks although the real body is on the larger range of acceptable for a spinning top. The long wicks indicate some indecision, a balance of bulls and bears. While the bears won for Friday’s session, their victory is not conclusive. They have some serious support to contend with at this price point. The spinning top may be a warning sign of an impending reversal, but on its own it is not a reversal signal. It is just one small piece of evidence to weigh up.
The bearish signal from On Balance Volume on the 26th of October has played out with two days afterwards of strong downwards movement to new lows. This bearish signal may now be resolved. Divergence at this stage between price and OBV continues to be unreliable, so it will be given no weight in this analysis today.
The support for OBV at the weekly chart level may assist with support for price to stop downwards movement here.
There is a little bullish divergence between price and MACD between the lows of the 17th of October and the 28th of October: price has made a lower low, but MACD has failed to make a corresponding new low. This is hidden bullish divergence and supports the main wave count. It should be only given a very little weight though because it is not always very reliable.
Overall, the balance of evidence today is judged to be bullish.
VOLATILITY – INVERTED VIX CHART
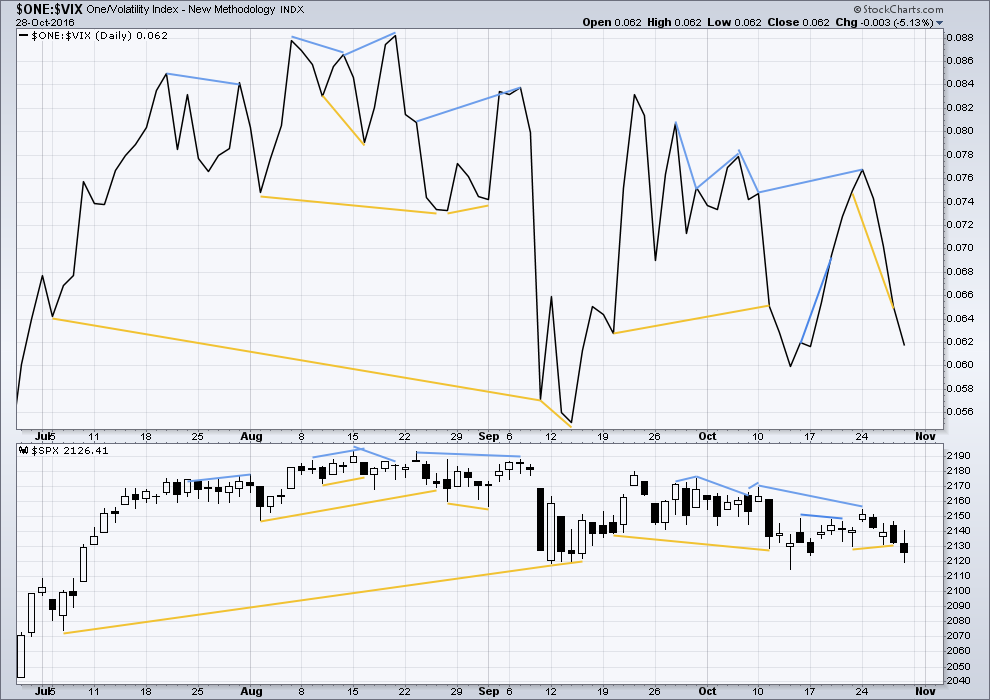
Click chart to enlarge. Chart courtesy of StockCharts.com.
There are a few instances of multi day divergence between price and inverted VIX noted here. Bearish divergence is blue. Bullish divergence is yellow. It appears so far that divergence between inverted VIX and price is again working to indicate short term movements spanning one or two days.
The hidden bullish divergence between price and VIX, noted in last analysis, did not result in any upwards movement. With price continuing lower, this divergence has failed. It is noted that although this short term divergence is often working to indicate the direction for price the following one or two days, it is not always working.
No new divergence is noted today.
BREADTH – AD LINE
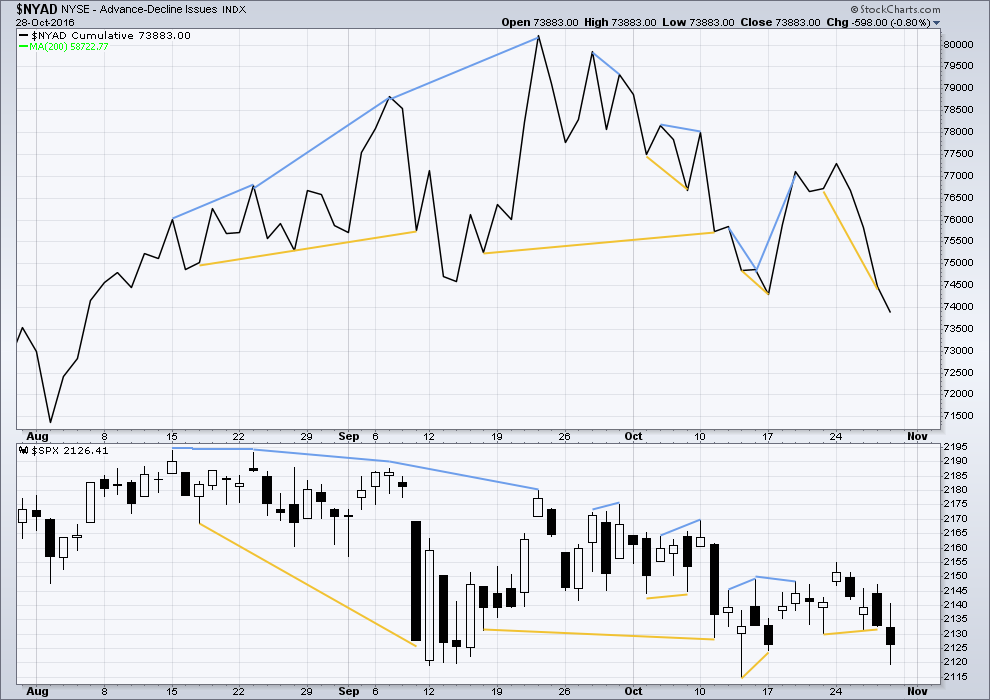
Click chart to enlarge. Chart courtesy of StockCharts.com.
Short term bullish and bearish divergence is again working between price and the AD line to show the direction for the following one or two days.
The hidden bullish divergence between price and the AD line, noted in last analysis, did not work. Price moved lower, not higher. Although most instances of divergence noted on this chart have worked, not all of them have. This is one instance that did not work.
DOW THEORY
Major lows within the old bull market:
DJIA: 15,855.12 (15th October, 2014) – closed below on 25th August, 2015.
DJT: 7,700.49 (12th October, 2014) – closed below on 24th August, 2015.
S&P500: 1,821.61 (15th October, 2014) – has not closed below this point yet.
Nasdaq: 4,117.84 (15th October, 2014) – has not closed below this point yet.
Major highs within the bear market from November 2014:
DJIA: 17,977.85 (4th November, 2015) – closed above on 18th April, 2016.
DJT: 8,358.20 (20th November, 2015) – has not closed above this point yet.
S&P500: 2,116.48 (3rd November, 2015) – closed above this point on 8th June, 2016.
Nasdaq: 5,176.77 (2nd December, 2015) – closed above this point on 1st August, 2016.
Dow Theory Conclusion: Original Dow Theory still sees price in a bear market because the transportations have failed to confirm an end to that bear market. Modified Dow Theory (adding S&P and Nasdaq) has failed still to confirm an end to the old bull market, modified Dow Theory sees price still in a bull market.
This analysis is published @ 08:30 p.m. EST on 29th October, 2016.

A small sideways inside day does not change the analysis at all.
Here’s an updated hourly chart for you.
One conclusion from today’s action is that it certainly does not look like a 3rd in a 3rd in a 3rd and so forth downwards as predicted by the Alternate count. Thus, the Alternate looks less likely.
That is exactly the conundrum. Price action does not look like a third wave in any direction imo…
Very tricky indeed on this day of Tricks or Treats!
I don’t think this is a fourth wave- too grossly out of proportion with Friday’s impulsive decline. The implication is that we could be in an on-going second wave correction with a sharp three down on deck.
Are you speaking of the daily timeframe?
Yep.
Interestingly, IWM on the same time frame does look like it is tracing out a possible fourth wave correction…
It sure would be great if we indeed have a tradable bottom, but there is still something about the price action on Friday that seems inconclusive. This endless sideways movement has made it difficult, if not impossible to make directional trades based on a clear consistent trend. IWM has also broken a long held support shelf and has been leading prices lower. If a bottom is in we should see a red VIX candle on Monday with a close at or near the low of the day. If a third wave has started, it really should on Monday display the price action that previous ones have – strong and relentless movement upward with broad market breadth and momentum. I also was hoping for a hammer on Fiday and we did not get one. VIX did penetrate the upper BB but the end of an intermediate wave ( even a minor C of an abc correction) should really show two upper BB penetrations – one for the end of the third wave, and another for the end of the fifth, the last penetration generally printing a bearish engulfing candle. Here’s hoping we get confirmation and clarification by price action early Monday.
I found it really hard to see the downwards movement as a complete five…. when it’s that difficult it may be just plain wrong.
TBH I don’t have enough confidence in my analysis of what’s happening at the hourly chart level to be ready to enter a trade on this market right now. I’ll be waiting and hoping the structure becomes clearer.
I am concerned that we may see a surprise to the downside. If that lilac trend line is properly breached then I’d be considering that there is something else going on….
I think you have already prepared for that in the Alternate Count. As I said last week, we have a descending triangle. But these are usually consolidation patterns not topping patterns. What remains true is that we see the bulls weakening each time the lilac trendline is touched / approached in that they fail to push it higher than the last swing high.
I would not be surprised to see the trendline break with what will ultimately be a false break. This would pull in a lot of bears and shake out a lot of bulls. We could move through the 2100 round number shaking out more bulls and ultimately trapping more bears.
A move to 2080 plus or minus would accomplish all this and be a good launching point for the next leg up.
I agree. I am expecting to see a sharp, but brief move to the downside to complete the current wave, then the final leg up. Looking for a bearish engulfing VIX candlestick to signal the reversal.