Upwards movement, which was expected for Wednesday’s session, produced a small green daily candlestick.
Summary: Intermediate wave (3) upwards should move above the end of intermediate wave (1) at 2,179.99. Upwards movement for today’s session lacks strength though, so this does not look like the start of a third wave. There is some bearish divergence today between price and VIX, so look out for a possible surprise to the downside tomorrow.
Last monthly chart for the main wave count is here.
New updates to this analysis are in bold.
MAIN WAVE COUNT
WEEKLY CHART
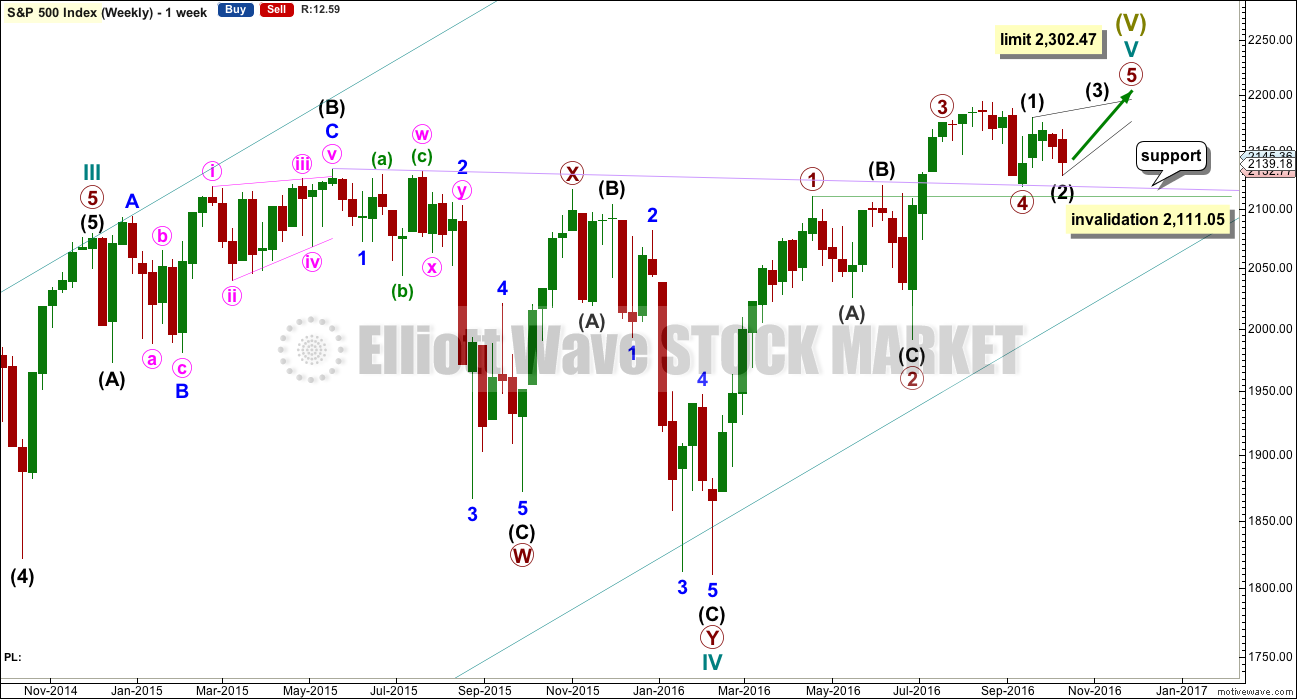
Cycle wave V must subdivide as a five wave structure. I have two wave counts for upwards movement of cycle wave V. This main wave count is presented first only because we should assume the trend remains the same until proven otherwise. Assume that downwards movement is a correction within the upwards trend, until proven it is not.
Primary wave 3 is shorter than primary wave 1, but shows stronger momentum and volume as a third wave normally does. Because primary wave 3 is shorter than primary wave 1 this will limit primary wave 5 to no longer than equality in length with primary wave 3, so that the core Elliott wave rule stating a third wave may not be the shortest is met. Primary wave 5 has a limit at 2,302.47.
Primary wave 2 was a shallow 0.40 expanded flat correction. Primary wave 4 may be exhibiting alternation as a more shallow combination.
Primary wave 4 may not move into primary wave 1 price territory below 2,111.05.
It is also possible to move the degree of labelling within cycle wave V all down one degree. It may be only primary wave 1 unfolding. The invalidation point for this idea is at 1,810.10. That chart will not be published at this time in order to keep the number of charts manageable. The probability that this upwards impulse is only primary wave 1 is even with the probability that it is cycle wave V in its entirety.
When the five wave structure upwards labelled primary wave 5 is complete, then my main wave count will move the labelling within cycle wave V all down one degree and expect that only primary wave 1 may be complete. The labelling as it is here will become an alternate wave count. This is because we should always assume the trend remains the same until proven otherwise. We should always assume that a counter trend movement is a correction, until price tells us it’s not.
DAILY CHART
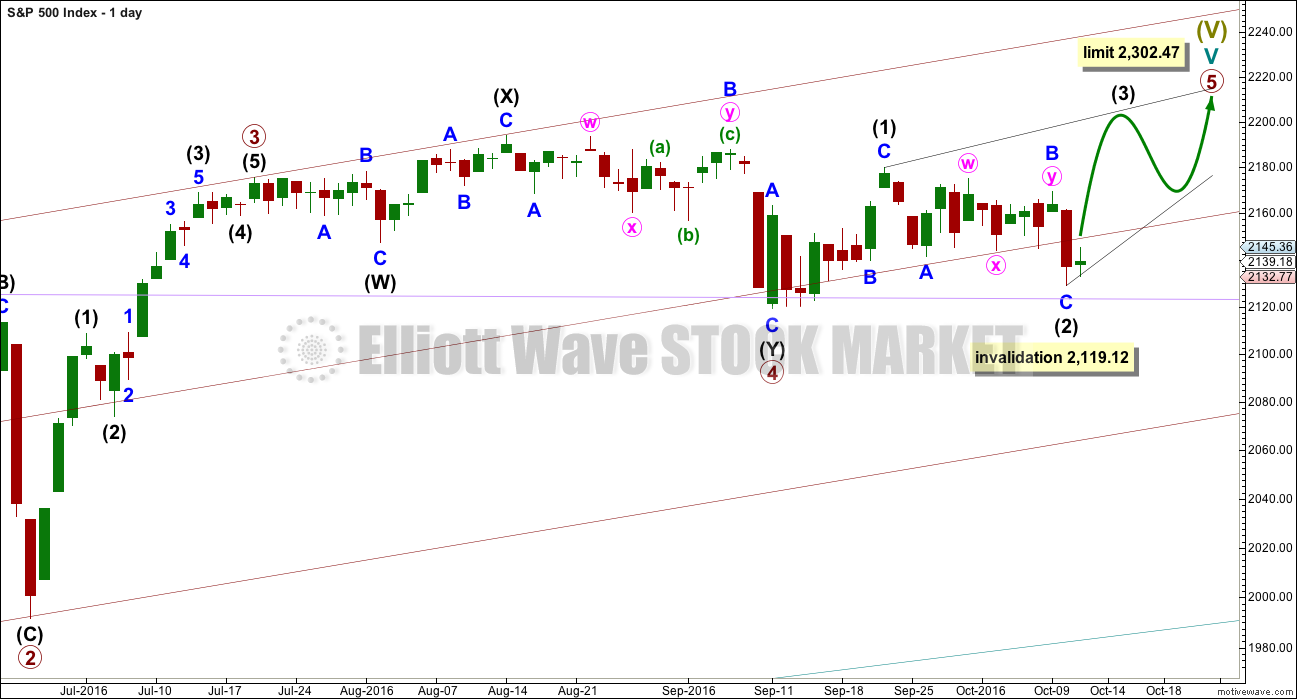
Primary wave 4 may be now complete as a double combination.
It is possible now that primary wave 4 could continue further as a triple, but because triples are very rare the probability of this is very low. If it is over here, then the proportion with primary wave 2 looks right. Within primary wave 5, no second wave correction may move beyond the start of its first wave below 2,119.12.
Primary wave 1 lasted 47 days, primary wave 2 was even in duration at 47 days, primary wave 3 lasted 16 days, and primary wave 4 has lasted 37 days. The proportions between these waves are acceptable.
If primary wave 5 has begun here, then at 2,233 it would reach 0.618 the length of primary wave 1.
At this stage, an impulse for primary wave 5 looks unlikely with invalidation of that idea at the hourly chart level. An ending diagonal now looks more likely for primary wave 5. Ending diagonals are choppy overlapping structures. The classic technical analysis equivalent is a rising wedge. They are terminal structures, doomed to full retracement at their end.
Ending diagonals require all sub-waves to subdivide as zigzags. Intermediate wave (1) fits as a zigzag and looks like a zigzag. Intermediate wave (2) will now fit as a completed zigzag. Intermediate wave (3) should now unfold as a zigzag upwards which must move above the end of intermediate wave (1) at 2,179.99.
If Super Cycle wave (V) is going to end in October, then it has only 14 days in which to complete. Ending contracting diagonals are much more common than the expanding variety, so intermediate waves (3), (4) and (5) are more likely to be shorter in both price and time than intermediate waves (1) and (2). Intermediate wave (3) may complete in a Fibonacci five days.
If primary wave 5 comes up to touch the upper edge of the maroon channel, it may end there.
HOURLY CHART
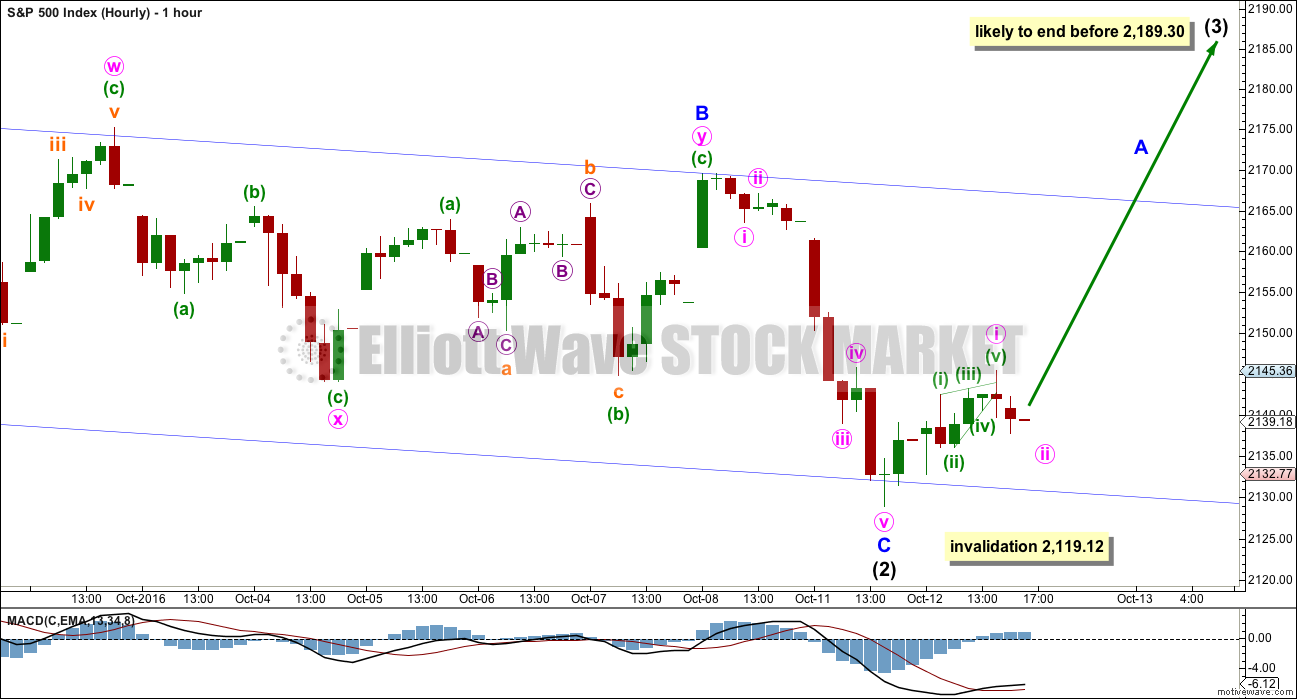
Intermediate wave (2) now fits as a completed zigzag. Minor wave B within it was a double combination: zigzag – X – flat. Intermediate wave (2), at 0.84, is slightly deeper than the normal depth of 0.66 to 0.81 the length of intermediate wave (1).
Within the zigzag of intermediate wave (2), minor wave C is 2.73 points longer than equality in length with minor wave A.
Intermediate wave (3) must move beyond the end of intermediate wave (1) above 2,179.58. If the ending diagonal is the more common contracting type, then intermediate wave (3) should end before it reaches equality with intermediate wave (1) at 2,189.30.
Intermediate wave (3) must subdivide as a zigzag.
So far a first wave up for minute wave i may be complete as a leading contracting diagonal. It is somewhat concerning today that upwards movement is not stronger because a third wave should exhibit more momentum and should have support from volume. Today’s small rise has neither. For this reason the invalidation point remains at 2,119.12.
If intermediate wave (2) continues any lower, it may not move beyond the start of intermediate wave (1) below 2,119.12.
ALTERNATE WAVE COUNT
WEEKLY CHART
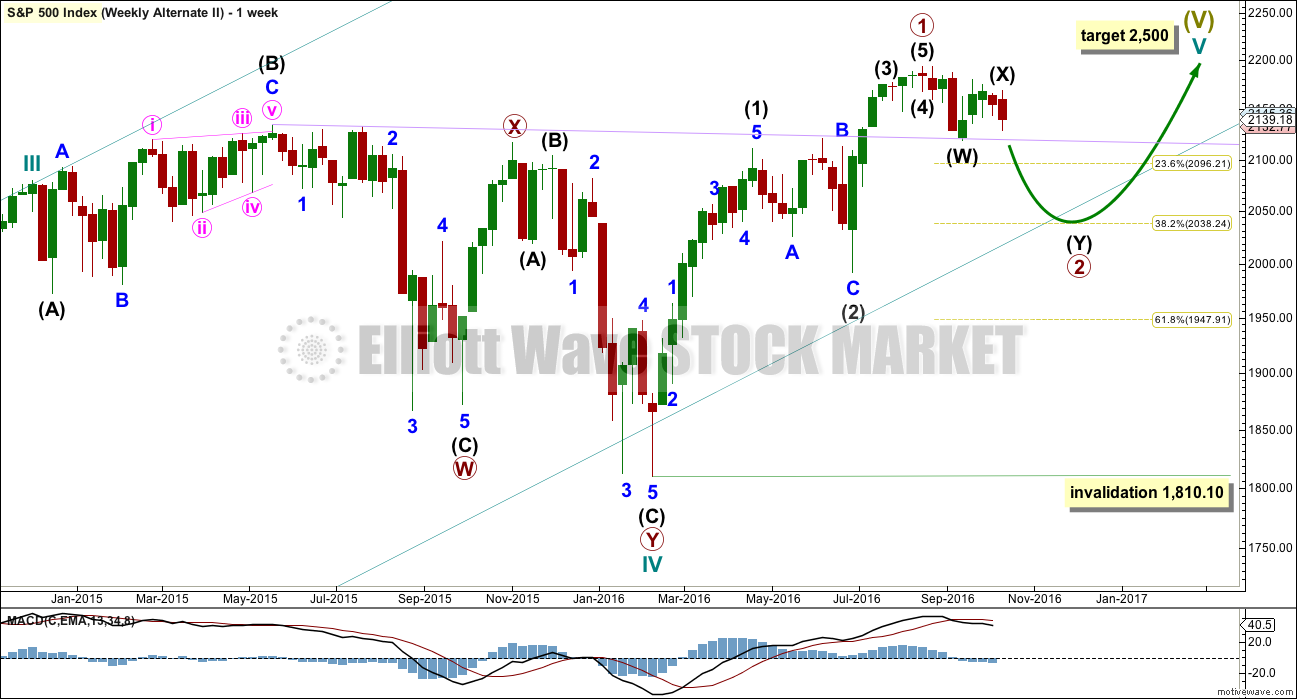
What if an impulse upwards is complete? The implications are important. If this is possible, then primary wave 1 within cycle wave V may be complete.
With downwards movement from the high of primary wave 1 now clearly a three and not a five, the possibility that cycle wave V and Super Cycle wave (V) are over has substantially reduced. This possibility would be eliminated if price can make a new all time high above 2,193.81.
If an impulse upwards is complete, then a second wave correction may be unfolding for primary wave 2. Expectations on how deep primary wave 2 is likely to be are now adjusted. It may be expected now to more likely only reach the 0.382 Fibonacci ratio about 2,038.
At this stage, it looks like price has found strong support at the lilac trend line.
Primary wave 2 may not move beyond the start of primary wave 1 below 1,810.10.
DAILY CHART
If an impulse upwards is complete, then how may it subdivide and are proportions good?
Intermediate wave (1) was an impulse lasting 47 days. Intermediate wave (2) was an expanded flat lasting 47 days. Intermediate wave (3) fits as an impulse lasting 16 days, and it is 2.04 points short of 0.618 the length of intermediate wave (1). So far this alternate wave count is identical to the main wave count (with the exception of the degree of labelling, but here it may also be moved up one degree).
Intermediate wave (4) may have been a running contracting triangle lasting 22 days and very shallow at only 0.0027 the depth of intermediate wave (3). At its end it effected only a 0.5 point retracement. There is perfect alternation between the deeper expanded flat of intermediate wave (2) and the very shallow triangle of intermediate wave (4). All subdivisions fit and the proportion is good.
Intermediate wave (5) would be very brief at only 18.29 points. Intermediate wave (5) is 1.43 points longer than 0.056 the length of intermediate wave (1).
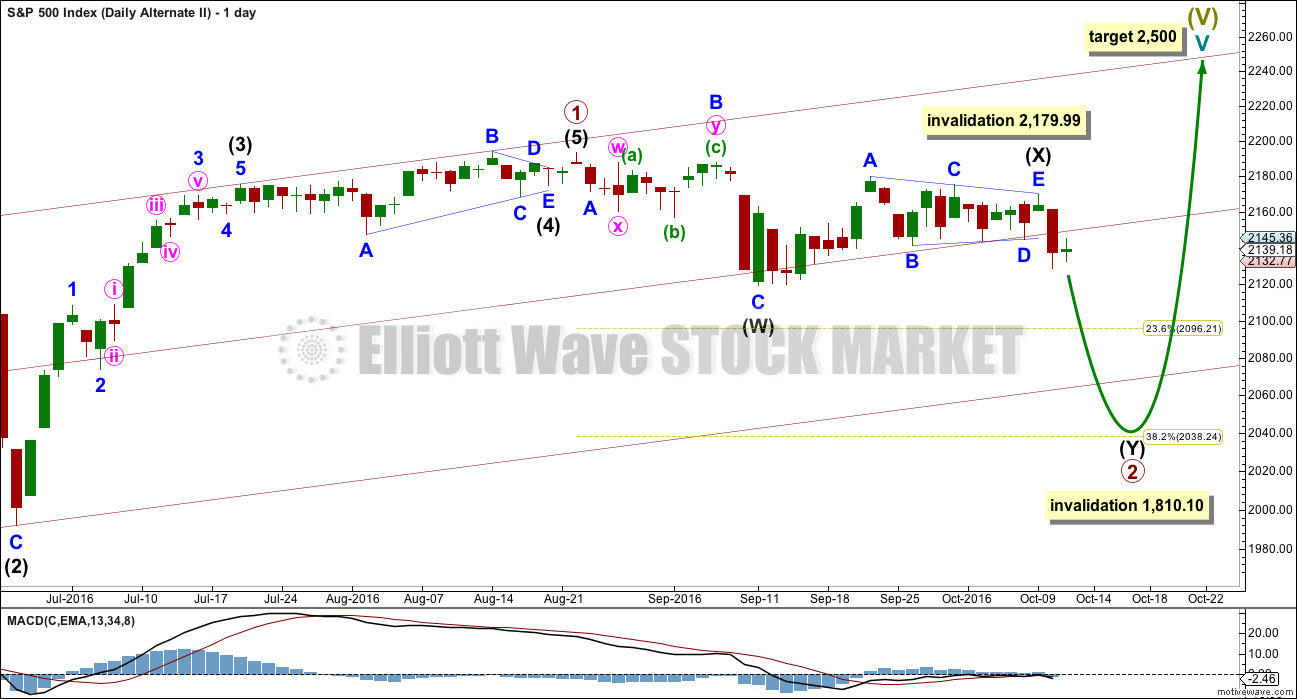
At this stage, primary wave 2 now has a completed zigzag downwards that did not reach the 0.236 Fibonacci ratio. It is very unlikely for this wave count that primary wave 2 is over there; the correction is too brief and shallow. Upwards movement labelled intermediate wave (X) is so far less than 0.9 the length of the prior wave down labelled intermediate wave (W). The minimum for a flat correction has not been met. Primary wave 2 may continue lower as a double zigzag. A second zigzag in the double may be required to deepen the correction closer to the 0.382 Fibonacci ratio.
Intermediate wave (W) lasted a Fibonacci 13 sessions. Intermediate wave (X) is now changed today to see a triangle unfolding sideways. X waves may subdivide as any corrective structure (including multiples), and a triangle is possible here.
If minor wave C within the triangle for intermediate wave (X) moves any higher, then it may not move beyond the end of minor wave A above 2,179.99. It is possible today that the triangle for intermediate wave (X) is over and the breakout downwards may come quickly.
Primary wave 2 may not move beyond the start of primary wave 1 below 1,810.10. A new low below this point would see the degree of labelling within cycle wave V moved up one degree. At that stage, a trend change at Super Cycle degree would be expected and a new bear market to span several years would be confirmed.
HOURLY CHART
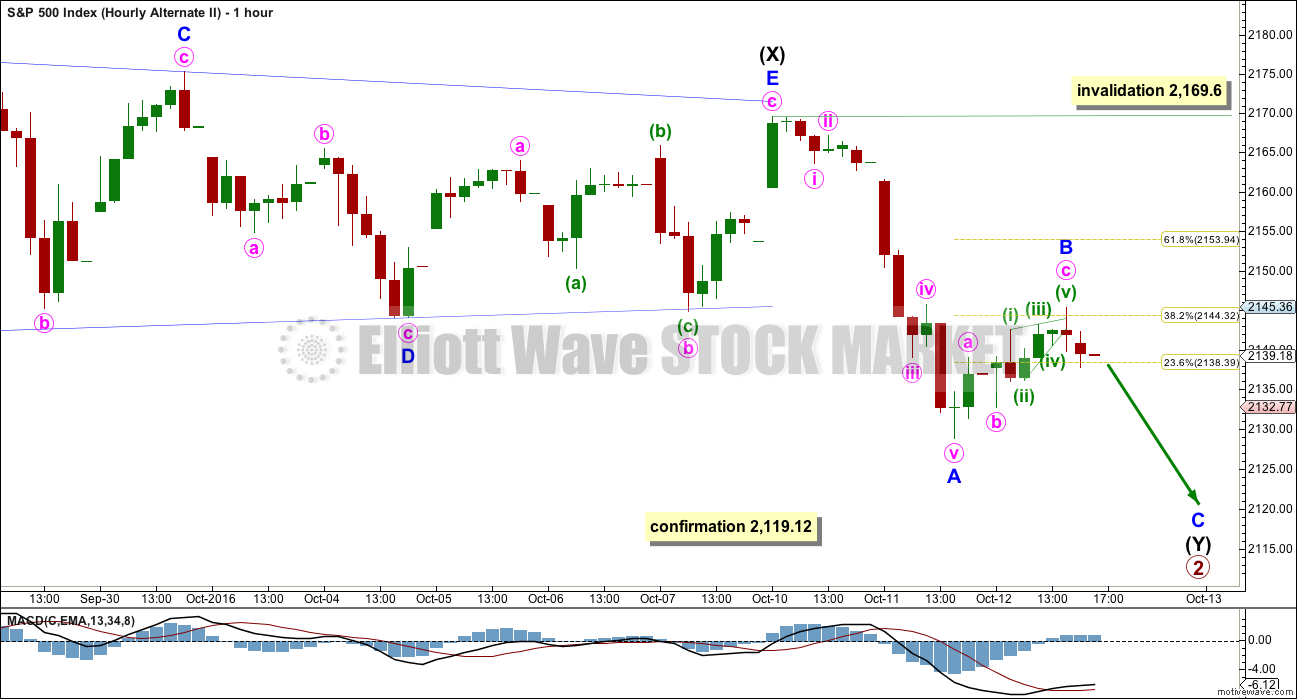
In the unlikely event that the main wave count is invalidated below 2,119.12 an hourly chart would be required for this alternate.
Intermediate wave (X) will fit as a regular contracting triangle. Intermediate wave (Y) should subdivide as a zigzag to deepen the correction. Within intermediate wave (Y), the correction for minor wave B may not move beyond the start of minor wave A above 2,169.60.
Upwards movement for today is choppy and overlapping, It looks corrective and will subdivide as a zigzag.
TECHNICAL ANALYSIS
WEEKLY CHART
Click chart to enlarge. Chart courtesy of StockCharts.com.
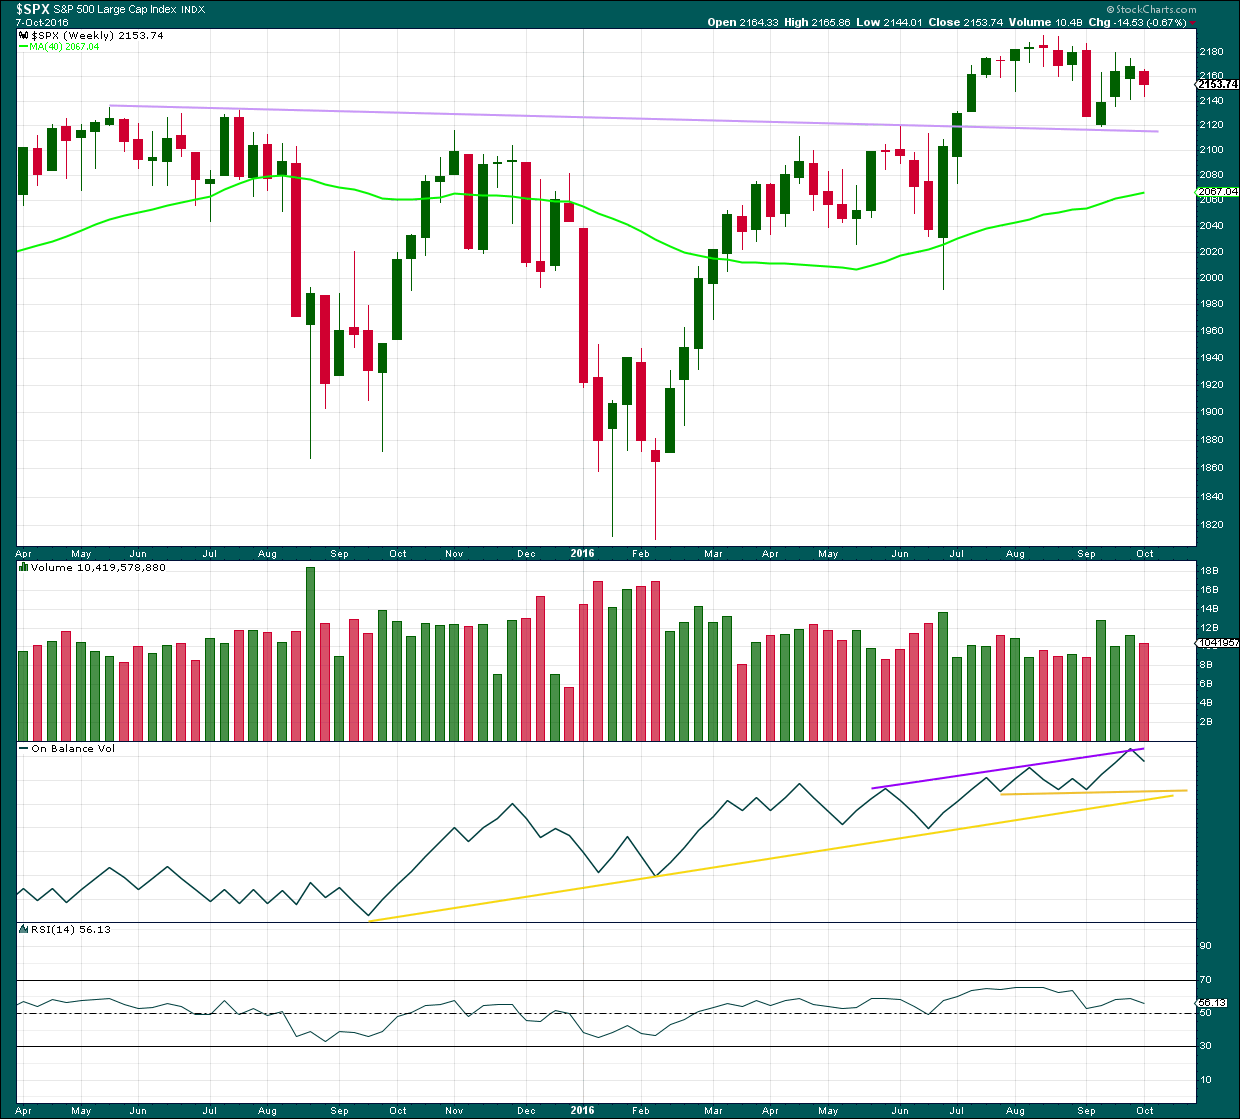
The lilac trend line has strong technical significance. Price has broken through resistance, turned down to test support, and is now moving up and away from this line. It is reasonable to conclude that a new all time high is a likely consequence of this typical behaviour.
The week before last closed green and has some support from volume. A further rise in price overall would be expected to follow. Last week is an inside week and closes red on lighter volume. The decline in price was not as well supported as the prior rise in price. This supports a bullish outlook for the mid term at least.
On Balance Volume the week before last came up to touch the purple trend line. It has found resistance and moved down from there. A break above the purple line would be a reasonably strong bullish signal. If OBV moves lower, it should find support at the yellow lines.
RSI is not extreme and exhibits no divergence at the weekly chart level to indicate weakness in price. There is room for price to rise further.
DAILY CHART
Click chart to enlarge. Chart courtesy of StockCharts.com.
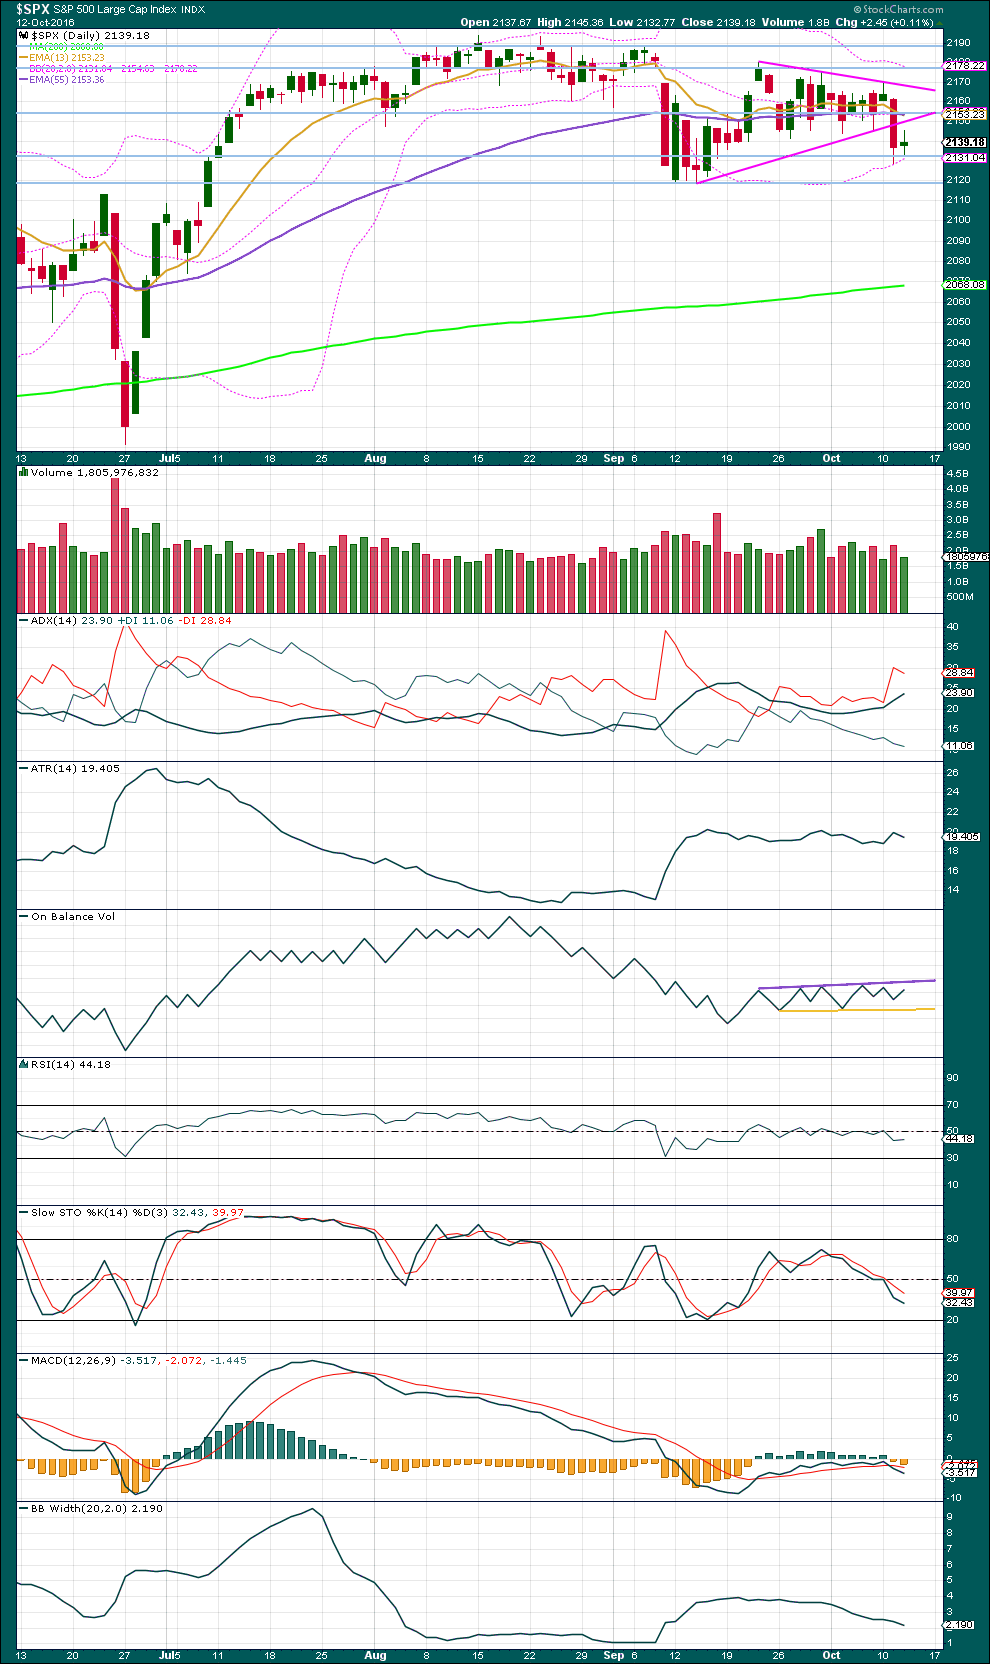
Price has broken out of the triangle downwards on a strong downwards day with some increase in volume. Downwards movement for this session is stronger than the three prior sessions, and the move down from price is supported by volume.
Now a small upwards day comes with lighter volume than the prior strong downwards day. This upwards day looks like a small counter trend bounce and not the first day of a new upwards trend. The small range and light volume do not support the main Elliott wave count.
ADX is indicating there is a downwards trend in place. ATR does not agree as it is still overall flat. Bollinger Bands are still contracting, so they disagree. Overall, a downwards trend is not yet clearly indicated.
On Balance Volume remains constrained with resistance at the purple line and support at the yellow line. There is short term divergence between price and OBV today: price made a new low below the low of the 4th of October, five sessions ago, but OBV has failed to make a corresponding new low. This short term divergence is bullish and indicates weakness in price.
If price moves lower, then it may be stopped by OBV when it finds support at the yellow line.
RSI is still close to neutral. There is plenty of room for price to rise or fall. There is no short term divergence between price and RSI between today’s low and the low five sessions prior on the 4th of October.
MACD has given a short term sell signal with a cross of MACD line below the signal line.
Stochastics is not yet extreme, but today it is getting close. If price continues lower here, it may find support about 2,120 while Stochastics moves closer to oversold.
VOLATILITY – INVERTED VIX CHART
Click chart to enlarge. Chart courtesy of StockCharts.com.
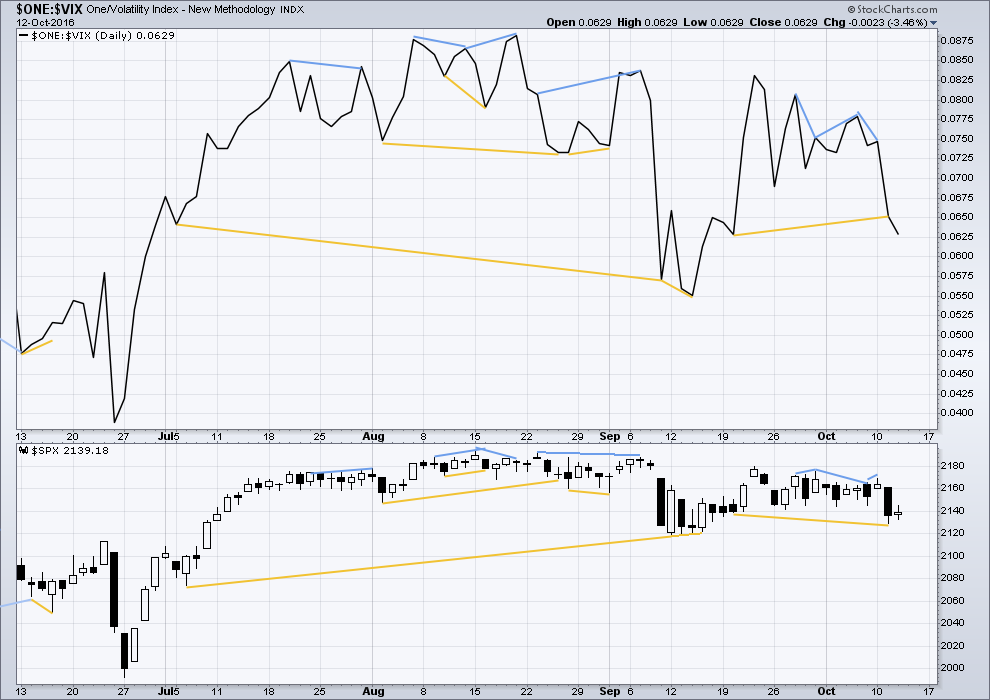
There are a few instances of multi day divergence between price and inverted VIX noted here. Bearish divergence is blue. Bullish divergence is yellow. It appears so far that divergence between inverted VIX and price is again working to indicate short term movements spanning one or two days.
Price had overall a small rise today, but inverted VIX moved reasonably lower. Normally, when price rises volatility should decline and inverted VIX should move higher. But today, while price moved higher, volatility increased as inverted VIX moved lower. This situation is not normal. VIX is giving a bearish signal with this divergence today.
BREADTH – AD LINE
Click chart to enlarge. Chart courtesy of StockCharts.com.
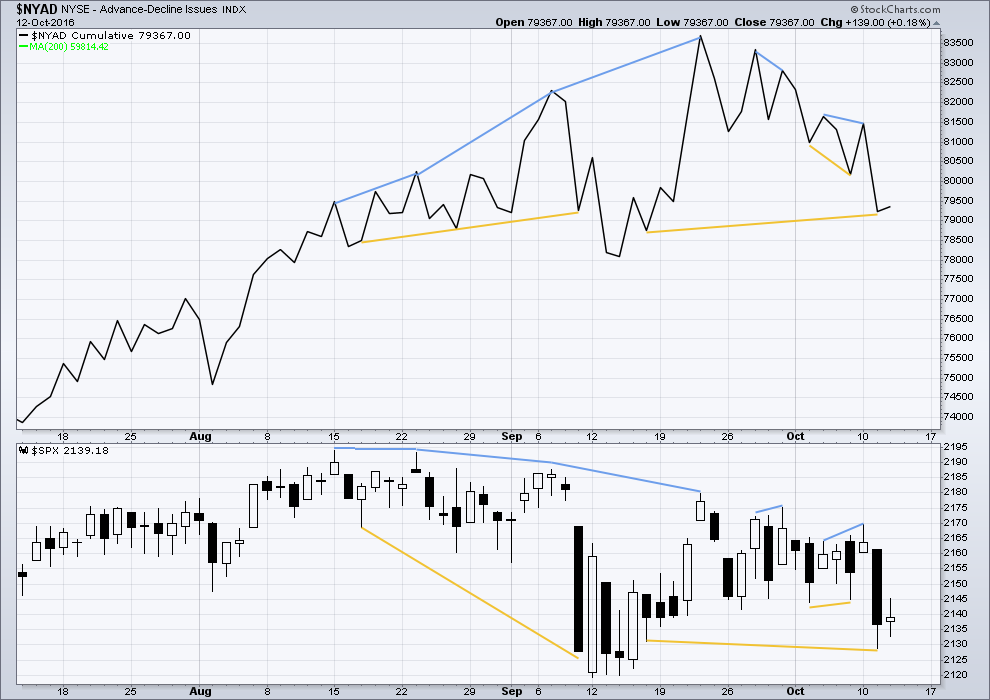
There is support from market breadth as price is rising.
Short term bullish and bearish divergence is again working between price and the AD line to show the direction for the following one or two days.
There is still mid term divergence between price and the AD line: price has made a new low below the prior low of the 16th of September, but the AD line has not made a corresponding new low. This divergence is bullish and indicates weakness in price. It may be followed by one more day of upwards movement.
DOW THEORY
Major lows within the old bull market:
DJIA: 15,855.12 (15th October, 2014) – closed below on 25th August, 2015.
DJT: 7,700.49 (12th October, 2014) – closed below on 24th August, 2015.
S&P500: 1,821.61 (15th October, 2014) – has not closed below this point yet.
Nasdaq: 4,117.84 (15th October, 2014) – has not closed below this point yet.
Major highs within the bear market from November 2014:
DJIA: 17,977.85 (4th November, 2015) – closed above on 18th April, 2016.
DJT: 8,358.20 (20th November, 2015) – has not closed above this point yet.
S&P500: 2,116.48 (3rd November, 2015) – closed above this point on 8th June, 2016.
Nasdaq: 5,176.77 (2nd December, 2015) – closed above this point on 1st August, 2016.
Dow Theory Conclusion: Original Dow Theory still sees price in a bear market because the transportations have failed to confirm an end to that bear market. Modified Dow Theory (adding S&P and Nasdaq) has failed still to confirm an end to the old bull market, modified Dow Theory sees price still in a bull market.
This analysis is published @ 08:29 p.m. EST.

There are two possible structures for cycle V. The chart published in my earlier comment below and my main wave count will follow the more common impulse.
But what if it’s an ending diagonal as Peter has asked?
So far this is what it would look like. Today’s spike down sees primary 4 now in primary 1 price territory, meeting that rule for a diagonal. The diagonal would be contracting, the most common type. The limit is for primary 5 to reach equality with primary 3, same as the main wave count for the same reason, so that the third wave is not the shortest.
But the problem I see here is the 1-3 trend line. Diagonals normally sit very well on their trend lines, they almost never overshoot. This has multiple overshoots, it looks wrong.
Also, for primary 5 to overshoot the 1-3 trend line it would have to move up really fast from here.
I’ll keep this idea charted and keep an eye on it. If the next wave up begins to look like a three and not a five then I’ll publish it within the analysis. For now it offers no divergence in terms of direction or limit to the main wave count.
Can you move Primary 1 to seven weeks or so earlier at the previous top (2111)?
Could we have a 1-2 Primary followed by a 1-2 of the next lower degree?
Yes, indeed. We could be about to move into a third wave up at two degrees.
Prechter and company see us in a minor two of intermediate five of primary five etc.
One thing is quite clear; tomorrow is not going to be a boring day!!!
Keeping my powder dry…sitting on a diamond 180/182
put straddle just for laughs….’Bye all!
I had opened a few long positions but I am exiting and going into the close neutral. Not liking this open gap one bit. It makes no sense that the bulls would not have closed it and something smells a bit fishy to me…. 🙂
New lows tomorrow, then a possible turn up for the beginning of wave 5. Corrective waves on 3 minutes all day on the way up. Just my opinion.
Once again, I think it depends on what happens with the pivots. If we see futures indicating that they are going to be demolished tomorrow we will be likely headed for SPX 1950.00 or possibly lower.
I was starting to think we were going to have a Frankie Valli “…So close and yet so far” requiem for this move off the bottom! 🙂
https://www.youtube.com/watch?v=Xqz9eyakGqY
Reminds me of my broken heart in high school. I was having a great upbeat day. Now I am crying in my drink! Gotta shake it.
Okay, I’m better. What a great song with so many connections.
Post: I left the player going and now I am listening to “Can’t Take My Eyes Off of You” Now that is my kind of song. Wait till I see my bride tonight! Thanks my friend Vern.
WOW. If I keep this channel on, I will soon be dancing. Good tunes.
🙂
The ending diagonal for primary 5 is now invalid. But a continuation of primary 4 is still on the table while price has remained above 2,111.05.
This will be today’s new main wave count. It still requires one more wave up.
There are now 12 trading days left in October. What if primary 5 moves up for a Fibonacci 8 days? It could be 0.618 the length of primary 3 and end in October. That’s possible.
Now, if this market does make a new ATH then it should be enough to turn almost everyone, including the perma bears, bullish. That is what is needed before it can be ready to turn.
That’s my musing anyway.
However, the degree of labelling within cycle V may also be moved all down one degree. This may also be only primary 1 of a much longer lasting bull market. It could go for another year, to 2,500.
Hear me now and believe me later…if the bears negate that hammer, run like hell if you are long this market!! I’m not kidding…!!!
It looks like it’s holding so far Verne. A good bottom signal that hammer.
However, the hammer is disappearing into the close.
Not good…not good at all…! 🙁
Back for a look-see. My the bulls have expended an awful lot of capital defending the pivots and buying us off the lows. They really do need to close that gap from this morning or it is going to look like the bears are toying with them. Hard to believe they would let them get this close and not finish the job. That would be what I would call a royal smack-down, butt-kicking, rump-thumping; you get the idea.
Volume at less than 52 mil much lower than average FWIW…
Just wondering about today’s volume. Any one have data relative to the last few days?
Well…unless the bears call in some reinforcements, it looks to me like this particular tussle is decided for now. We are looking at what I like to refer to a “perambulating around the pivots” and we have a well-established tradition of how such meandering resolves. Nothing much more to see today imo so I am off to get a few things done other than staring at Mr. Market. Cheerio!
Candlestick now technically qualifies as a hammer…
On the other hand, if the market pulls back from the bottom of today’s gap and then proceeds to put in a new low, that would mean more new lows to come. This is an important day.
The chances of that happening are quite remote imho. When serious market declines truly begin, an outstanding characteristic is that they head South and do not look back. The very fact that we are discussing whether or not we are going to see new lows is bullish. This move down is very likely over….
How interesting. The markets take a little dive and everybody and his grandma start yelling “The sky is falling…the sky is falling!” My inbox is overflowing with proclamations that the end is near. Don’t these people pay any attention to round number pivots and their importance clearly established these past several months? Enough already!! 🙂 🙂 🙂
The whipsaw in this market is totally nuts! Anybody trying to trade this plunge this morning is already underwater unless the decline resumes. I don’t know how position or swing traders are surviving this treacherous price action….jeez- louise!!
Didn’t know I spoke French didja? 🙂
That’s French? Huh?
If the gap fills and we have a green close at the highs of the day, that will produce a strong bullish hammer. That is a ‘big’ if of course.
If it closes above yesterday’s high (SPX 145.36), then we will also have a bullish engulfing candle. Again, a ‘big’ if.
Not yet technically a hammer, but the long lower wick is bullish. I have ignored that signal to my own detriment (monetary only of course!) in the past because of pre-conceived notions…of course that lower wick could change by the close, but if it does not, bears beware!! 🙂
Bears and Bulls circling with horns lowered and fangs and claws at the ready…this oughta be real interesting…! Somebody’s gonna get gored or clawed…but who??!! 🙂
Either a second or a fourth wave still developing. If it is a second, there is going to be a blood-bath into the close…if a fourth, we need one more low to complete the impulse down…I would expect a genuine reversal to fill this morning’s opening gap…
I set loose a little canary in the coal mine this morning in the form of a bearish SPY call spread. The market makers are usually a little ahead of the game and the long calls of the spread will typically start to perk up on an impending market reversal…will post if I see some signs of life… 🙂
No disrepect to that HSBC analyst but I have noticed over the years that when the market is getting ready for some serious throw-down, VIX BBs expand rapidly to contain the big fat green candles being printed. Another dead give-away is the price action around the round number pivots. When the bears really mean business, these pivots are taken out back and summarily shot…no if, ands or buts. Any hesitation or back and forth of any kind around these pivots is a contest the bears will loose 99% of the time. Just my two pence…
On the daily chart it looks to me like we are completing an impulse down in a fifth wave. Whether this is the start of something bigger will be determined by the kind of bounce we will be seeing shortly. If it turns out to be some kind of corrective second wave, we are in all likelihood at just the start of a much bigger decline imo…
Looka like the fifth wave of an impulse down on deck. If that’s all she wrote, we should see a very strong reversal off the impending new low and head skywards in an impulsive move. Anything less means more pain to come…for the bulls that is….
“Looka like?!” I did not know I also spoke Italian! 🙂
Nor did we Verne.
And French too…. apparently 🙂
We now have an upper BB penetration by VIX accompanied by a developing upper shadow. I can now envision an at least temporary low in place. As Rodney astutely pointed out, not a time to be executing short-side trades, but a time to take profits on them if you were already positioned.
http://finance.yahoo.com/news/hsbc-red-alert-ready-severe-123507005.html
Article provides a picture of the HSBC analyst’s EW count on the Dow.
Both his downside triggers on S&P and Dow were hit today, portending much bigger sell-offs.
Simply another take on what might be happening…
He did point that the market needed to close below the cited levels and he is absolutely right about that caveat. Never under-estimate the resolve of the banksters folks. I think we have at least one more pop higher to complete a developing ED….
I do think a close below DJI 18,000.00 and SPX 2110.00 portends a much bigger immediate fall and if that happens I will be re-opening short positions.
Lara,
Is it possible that Cycle Wave 5 is unfolding as an ending diagonal, rather than an impulse, with Primary 4 continuing a bit lower to overlap with Primary 1, leaving one final zig zag up for Primary 5?
Thanks,
Peter
I’ll chart it and take a look at the idea. If it fits then I’ll publish it today, first in comments above.
The banksters are not going to surrender the round number pivots without a fight. How we close today is going to be a great clue as to what lies ahead….if you are trading the short side remember to take profits early and often! Take all you can, give nothing back!! 🙂
On the daily charts, VIX, SPX, and $NYMO are all outside their respective bollinger bands. A day or two of this often marks a bottoming process. Those who are not short already might do well to wait. Those who are already short, might do well to start taking profits. Just my thoughts.
Absolutely. Never a good idea to chase these kinds of moves. These triangle trades as I indicated are bread and butter trades and you really need to get positioned ahead of the big move.I know I have made a good trade when I am closing positions when other folks are looking to open them as probably was the case this morning. Good to hear from ya Rod. How is that handsome feller?
My lab was very naughty this morning and somehow got out the back gate. To my surprise I saw him in my rear view mirror chasing me down the street as I left the house! I swear he has figured out a way to unlatch that back gate! Way too smart by half that dog. His name is Nox. 🙂
I once had a German Shepherd like that. There was no way I could go for a walk without her. She always found a way to follow me. When I was far enough from the house to prevent a turn-a-round, she would make herself known and continue the walk. God rest her soul. She is buried on my former home in northern Montana.
I have been following the markets etc. But I have been viewing from a daily / weekly perspective. I think we have a good possibility of a wash out here before we start another leg up after the elections. I think the Clinton’s will return to / retain their power in Washington DC and we will see four more years of the same. The 2500 SPX projection is still on the table. Time will tell.
There is a funny scene in “The Two Towers” when the people from Rohan are attacked on their way to the keep of Helm’s Deep. Legolas goes looking for Aaragorn after the fight and comes upon a dying Orc that says with a smirk –
” ‘E’s dead!…took a little tumble of the cliff…!” 🙂
Speaking of cliffs and tumbles….let’s go make some coin!
ROTFL
My son was fully into Lord of the Rings when he was a kid. I have fought many a battle with Orcs in my back yard, with plastic swords.
I made him a Frodo outfit; vest, shirt, leggings. He’d dress up and “be” one or the other character all day. Good times 🙂
I have been contending for some time that the alpha dog in the financial markets pack is not the FED, as so many believe, it’s the bond market. My long-standing view has been that while no one could call a top with certainty, what took place in the bond market would be an excellent clue as to when one was near, or had arrived. Of course when one thinks about the bond market, the one thing that comes instantly to mind is the interest rate. Bonds live or die by interest rates, and the tale of the tape so far as this long-in-the-tooth bull market is concerned has been ZIRP and NIRP imposed on the financial markets by reckless and insane banksters the last seven years. Look at the utter stupidity of all those useless talking heads on the tube who are now insisting that a FED that did not hike rates when the economy was in far better shape, reporting at one point 4% growth, are now going to hike in December when we are about to have our sixth consecutive quarter of negative earnings growth. But I digress.
If you really want to know what is about to happen in the bond market, and that has nothing to do with irrelevant FOMC drivel, keep and eye on LIBOR, the London Interbank Offered Rate, which is the rate banks charge each other for short-term loans.
Who better knows the true financial condition of their partners in crime than the banks themselves I ask you? LIBOR has gone from about 0.6 at the start of the year to almost 0.9%! A massive almost 50% hike. At 1% is the event horizon. The FED will eventually be forced to hike and it will have nothing to do with their hogwash about “data dependence” (sounds real scientific doesn’t it?), or the true state of the economy, but because the bond market leaves them no choice. The rising LIBOR signals that banks are becoming increasingly skittish about their ability to keep the ponzi scheme going…so should you… Cheers!
helloooo
Back at you doc. I have been far too consumed with all the hullabaloo about leaked emails to have much time to concentrate on this market.