Downwards movement was expected for Monday’s session to about 2,155.
Monday did move price lower, but it was more than expected closing at 2,146.
Summary: One to three days of choppy overlapping upwards movement is expected to end about 2,166. Thereafter, one to three days of downwards movement should follow. The target for the mid term remains at 2,233.
Last monthly chart for the main wave count is here.
New updates to this analysis are in bold.
MAIN WAVE COUNT
WEEKLY CHART
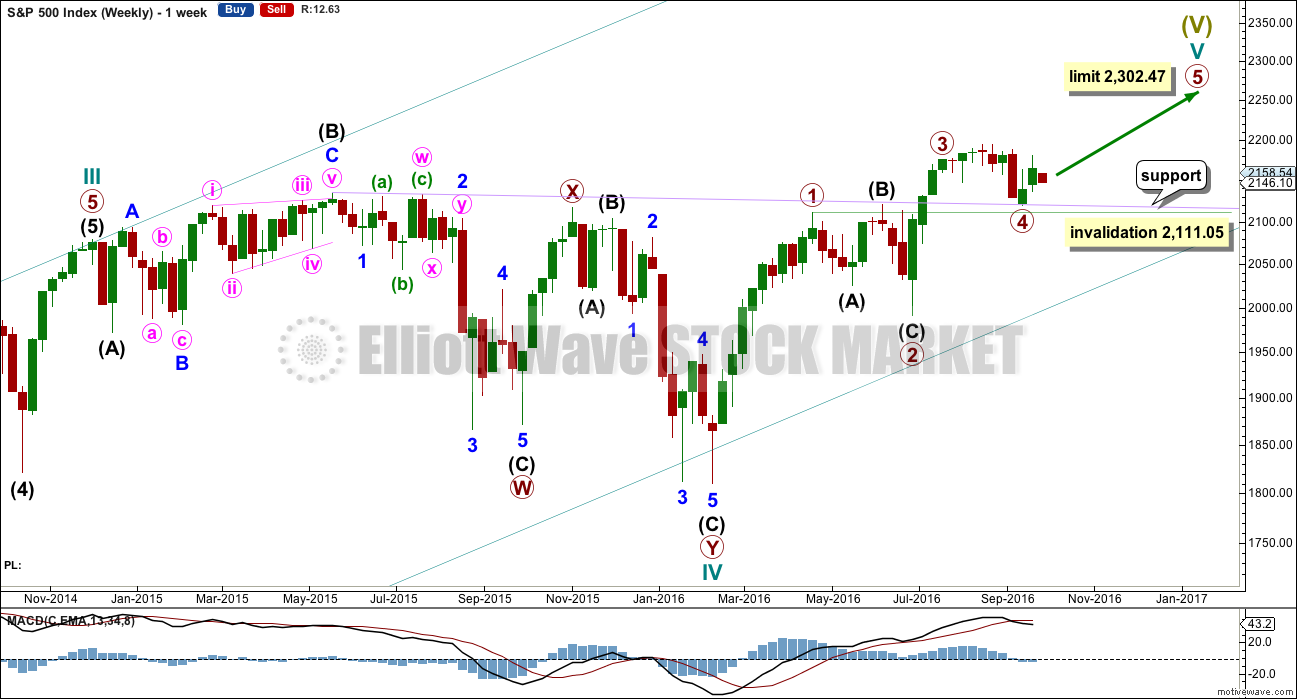
Cycle wave V must subdivide as a five wave structure. I have two wave counts for upwards movement of cycle wave V. This main wave count is presented first only because we should assume the trend remains the same until proven otherwise. Assume that downwards movement is a correction within the upwards trend, until proven it is not.
Primary wave 3 is shorter than primary wave 1, but shows stronger momentum and volume as a third wave normally does. Because primary wave 3 is shorter than primary wave 1 this will limit primary wave 5 to no longer than equality in length with primary wave 3, so that the core Elliott wave rule stating a third wave may not be the shortest is met. Primary wave 5 has a limit at 2,302.47.
Primary wave 2 was a shallow 0.40 expanded flat correction. Primary wave 4 may be exhibiting alternation as a more shallow combination.
Primary wave 4 may not move into primary wave 1 price territory below 2,111.05.
It is also possible to move the degree of labelling within cycle wave V all down one degree. It may be only primary wave 1 unfolding. The invalidation point for this idea is at 1,810.10. That chart will not be published at this time in order to keep the number of charts manageable. The probability that this upwards impulse is only primary wave 1 is even with the probability that it is cycle wave V in its entirety.
DAILY CHART
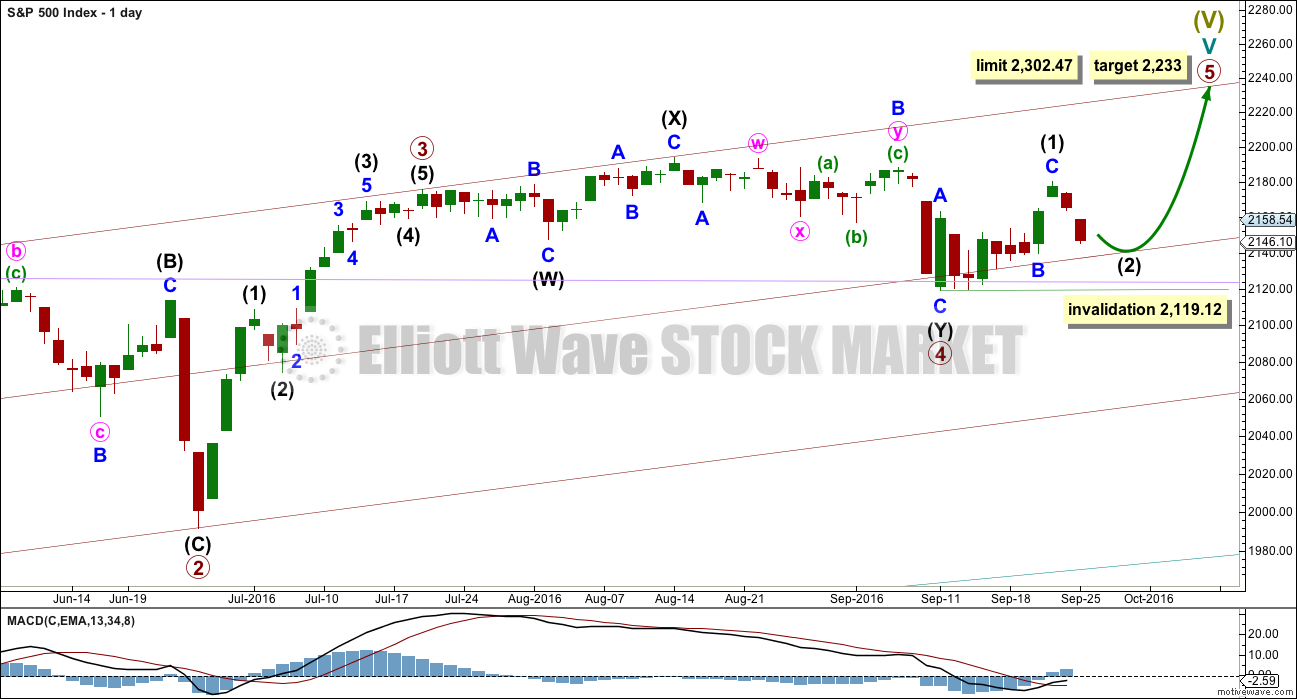
Primary wave 4 may be now complete as a double combination.
It is possible now that primary wave 4 could continue further as a triple, but because triples are very rare the probability of this is very low. If it is over here, then the proportion with primary wave 2 looks right. Within primary wave 5, no second wave correction may move beyond the start of its first wave below 2,119.12.
Primary wave 1 lasted 47 days, primary wave 2 was even in duration at 47 days, primary wave 3 lasted 16 days, and primary wave 4 has lasted 37 days. The proportions between these waves are acceptable.
If primary wave 5 has begun here, then at 2,233 it would reach 0.618 the length of primary wave 1.
At this stage, an impulse for primary wave 5 looks unlikely with invalidation of that idea at the hourly chart level. An ending diagonal now looks more likely for primary wave 5. Ending diagonals are choppy overlapping structures. The classic technical analysis equivalent is a rising wedge. They are terminal structures, doomed to full retracement at their end.
If primary wave 5 comes up to touch the upper edge of the maroon channel, it may end there.
HOURLY CHART
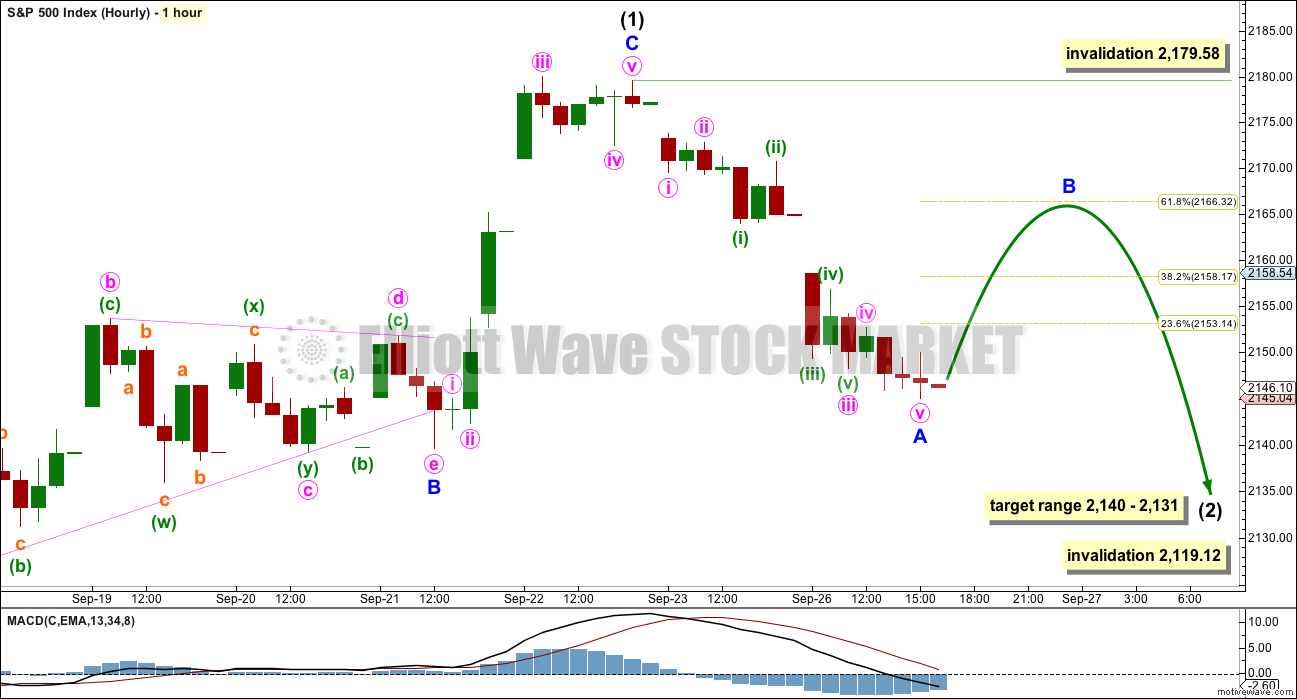
If primary wave 5 is subdividing as an ending diagonal, then all sub-waves must subdivide as zigzags. Intermediate wave (1) may be a completed zigzag.
Second and fourth waves within diagonals have a normal depth of from 0.66 to 0.81 the prior wave. This gives a target range for intermediate wave (2) from 2,140 to 2,131.
Intermediate wave (2) must subdivide as a zigzag. It may not move beyond the start of intermediate wave (1) below 2,119.12.
Intermediate wave (1) lasted a Fibonacci eight days.
Intermediate wave (2) may be expected to last either a Fibonacci five or eight days for the proportions of this wave count to have the right look, with five the first expectation. So far it has lasted two, so it may end in three more sessions.
Intermediate wave (2) should be expected to be a big obvious three wave structure. Within intermediate wave (2), minor wave B should show up at the daily chart level as at least one green candlestick or a doji. Minor wave B may not move beyond the start of minor wave A above 2,179.58.
Minor wave B may be any one of more than 23 possible corrective structures. It may last one to two sessions most likely.
When minor wave B is complete, then minor wave C downwards should unfold ending within the target range. When minor wave B is complete and the start of minor wave C is known, then the ratio between minor waves A and C may be used to calculate a target within the zone. That cannot be done yet.
ALTERNATE WAVE COUNT
WEEKLY CHART
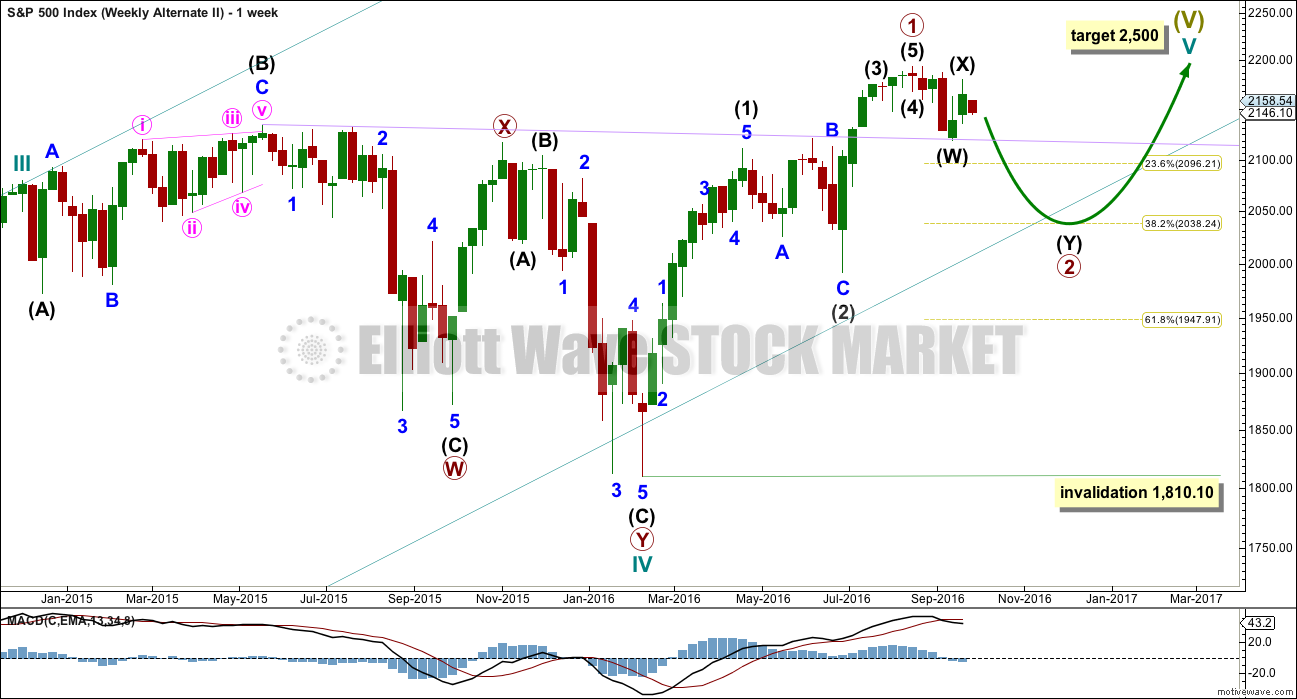
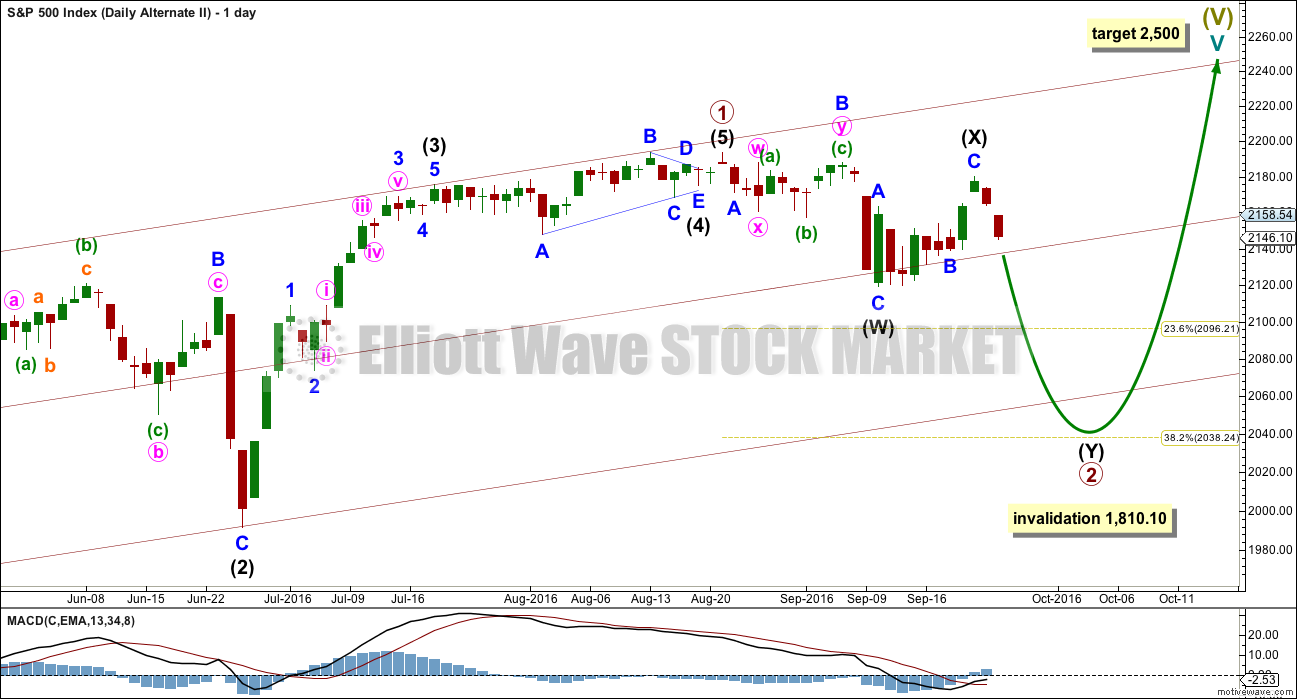
What if an impulse upwards is complete? The implications are important. If this is possible, then primary wave 1 within cycle wave V may be complete.
With downwards movement from the high of primary wave 1 now clearly a three and not a five, the possibility that cycle wave V and Super Cycle wave (V) are over has substantially reduced. This possibility would be eliminated if price can make a new all time high above 2,193.81.
If an impulse upwards is complete, then a second wave correction may be unfolding for primary wave 2. Expectations on how deep primary wave 2 is likely to be are now adjusted. It may be expected now to more likely only reach the 0.382 Fibonacci ratio about 2,038.
At this stage, it looks like price has found strong support at the lilac trend line.
Primary wave 2 may not move beyond the start of primary wave 1 below 1,810.10.
DAILY CHART
If an impulse upwards is complete, then how may it subdivide and are proportions good?
Intermediate wave (1) was an impulse lasting 47 days. Intermediate wave (2) was an expanded flat lasting 47 days. Intermediate wave (3) fits as an impulse lasting 16 days, and it is 2.04 points short of 0.618 the length of intermediate wave (1). So far this alternate wave count is identical to the main wave count (with the exception of the degree of labelling, but here it may also be moved up one degree).
Intermediate wave (4) may have been a running contracting triangle lasting 22 days and very shallow at only 0.0027 the depth of intermediate wave (3). At its end it effected only a 0.5 point retracement. There is perfect alternation between the deeper expanded flat of intermediate wave (2) and the very shallow triangle of intermediate wave (4). All subdivisions fit and the proportion is good.
Intermediate wave (5) would be very brief at only 18.29 points. Intermediate wave (5) is 1.43 points longer than 0.056 the length of intermediate wave (1).
At this stage, primary wave 2 now has a completed zigzag downwards that did not reach the 0.236 Fibonacci ratio. It is very unlikely for this wave count that primary wave 2 is over there; the correction is too brief and shallow. Upwards movement labelled intermediate wave (X) is so far less than 0.9 the length of the prior wave down labelled intermediate wave (W). The minimum for a flat correction has not yet been met. Primary wave 2 may continue lower as a double zigzag. A second zigzag in the double may be required to deepen the correction closer to the 0.382 Fibonacci ratio.
Intermediate wave (W) lasted a Fibonacci 13 sessions. Intermediate wave (X) has now lasted a Fibonacci eight sessions. If intermediate wave (Y) is equal in duration with intermediate wave (W), that would give the wave count a satisfying look.
Primary wave 2 may not move beyond the start of primary wave 1 below 1,810.10. A new low below this point would see the degree of labelling within cycle wave V moved up one degree. At that stage, a trend change at Super Cycle degree would be expected and a new bear market to span several years would be confirmed.
HOURLY CHART
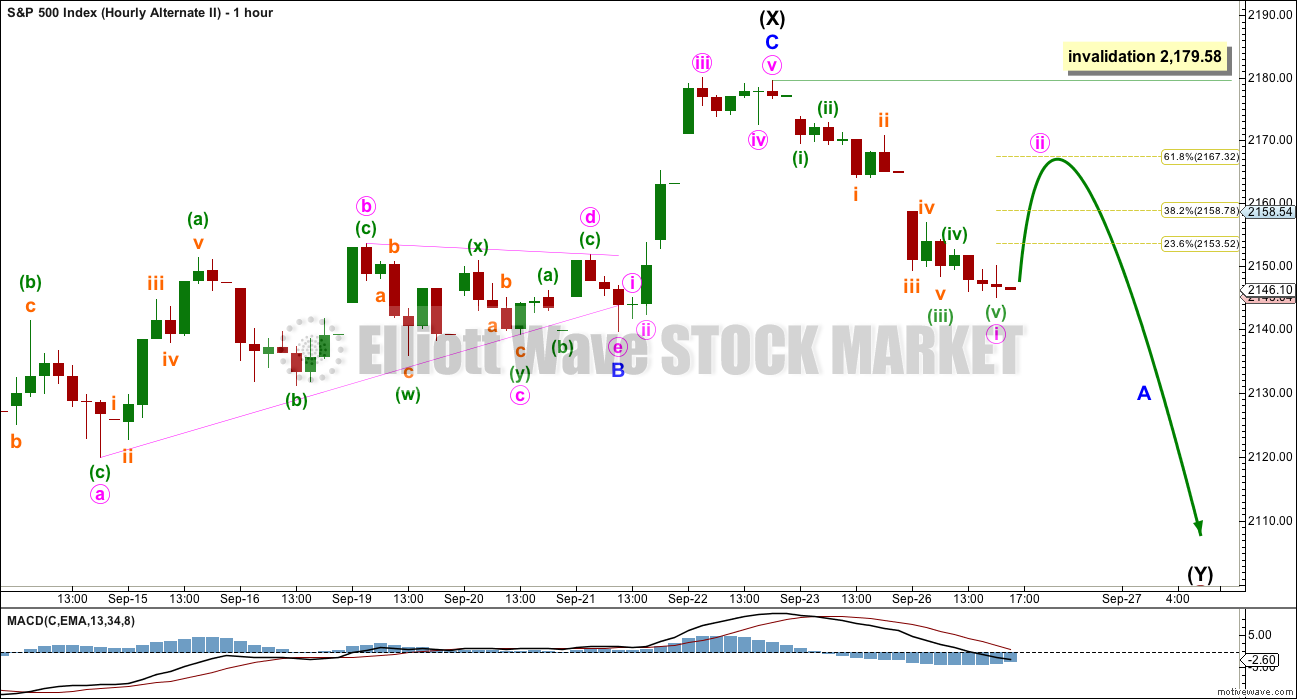
The subdivisions for this hourly chart are the same as for the main wave count hourly chart. A zigzag upwards may have completed and the triangle may be minute wave b within the zigzag.
This wave count now expects downwards movement for a Fibonacci 13 sessions overall most likely, to end about 2,038.
TECHNICAL ANALYSIS
WEEKLY CHART
Click chart to enlarge. Chart courtesy of StockCharts.com.
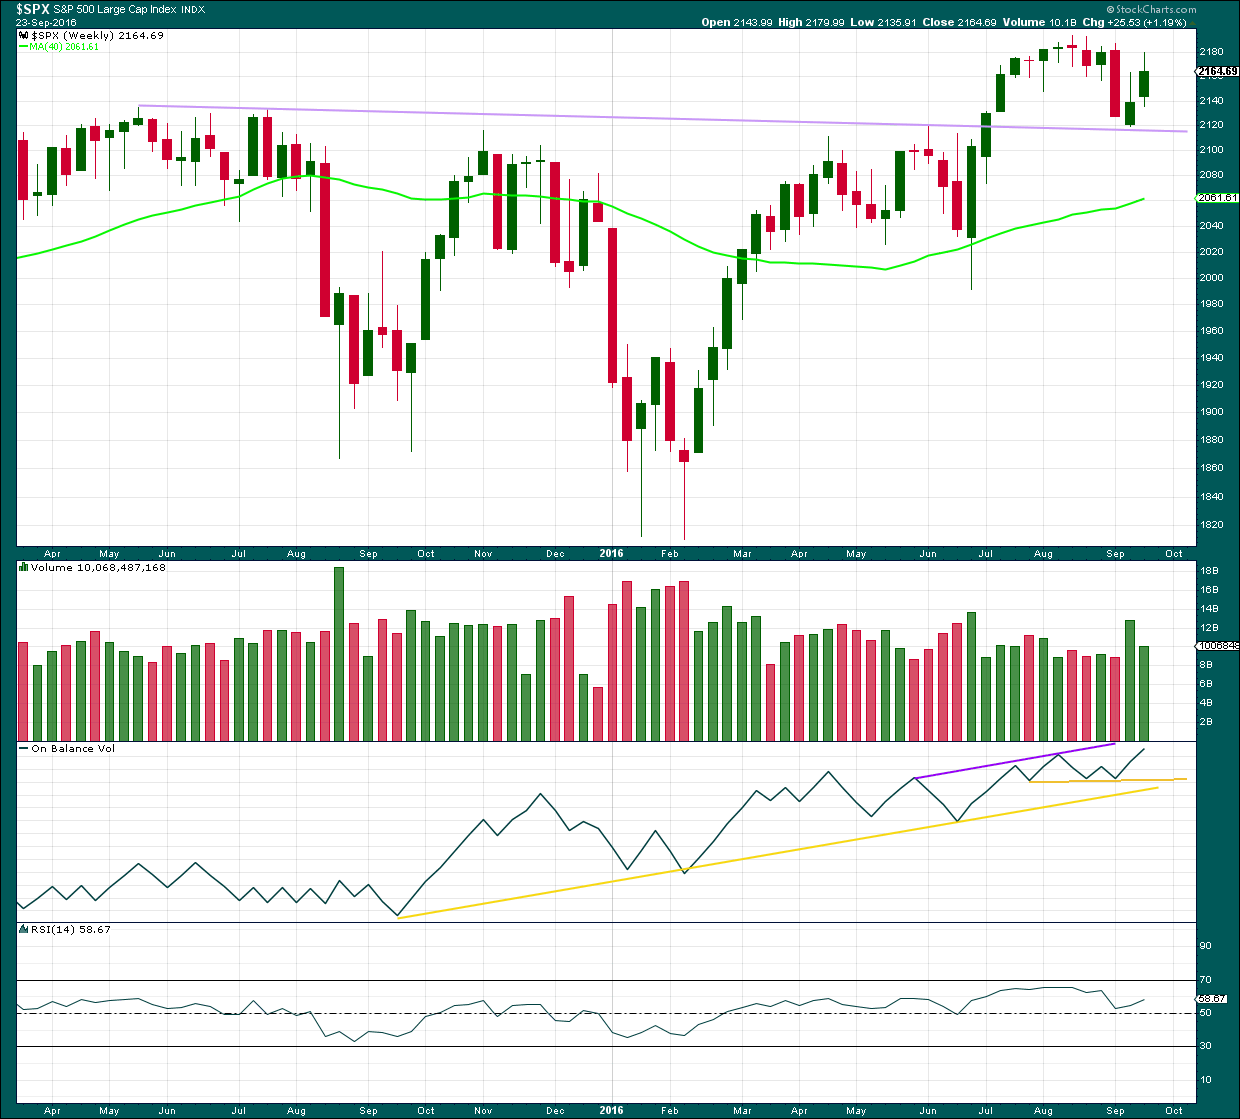
The lilac trend line has provided very strong support whereas previously provided strong resistance. The strength of this line is reinforced. If price turns down from here, it should be again expected to provide support. A break below it would be a strong bearish signal.
Last week completed a green weekly candlestick with strong volume but a long upper wick. This week completes another green candlestick but volume is lighter. The rise in price is not supported by volume, so it is suspicious.
On Balance Volume has made a new high above the high for the week of the 6th of August, but price has failed to make a corresponding new high. This divergence is bearish and indicates weakness in price. It does not say that price must turn down from here, only that price is weak. The bull market is unhealthy.
RSI is not extreme. There is room for price to rise further. There is no divergence between RSI and price at the weekly chart level to indicate weakness.
DAILY CHART
Click chart to enlarge. Chart courtesy of StockCharts.com.
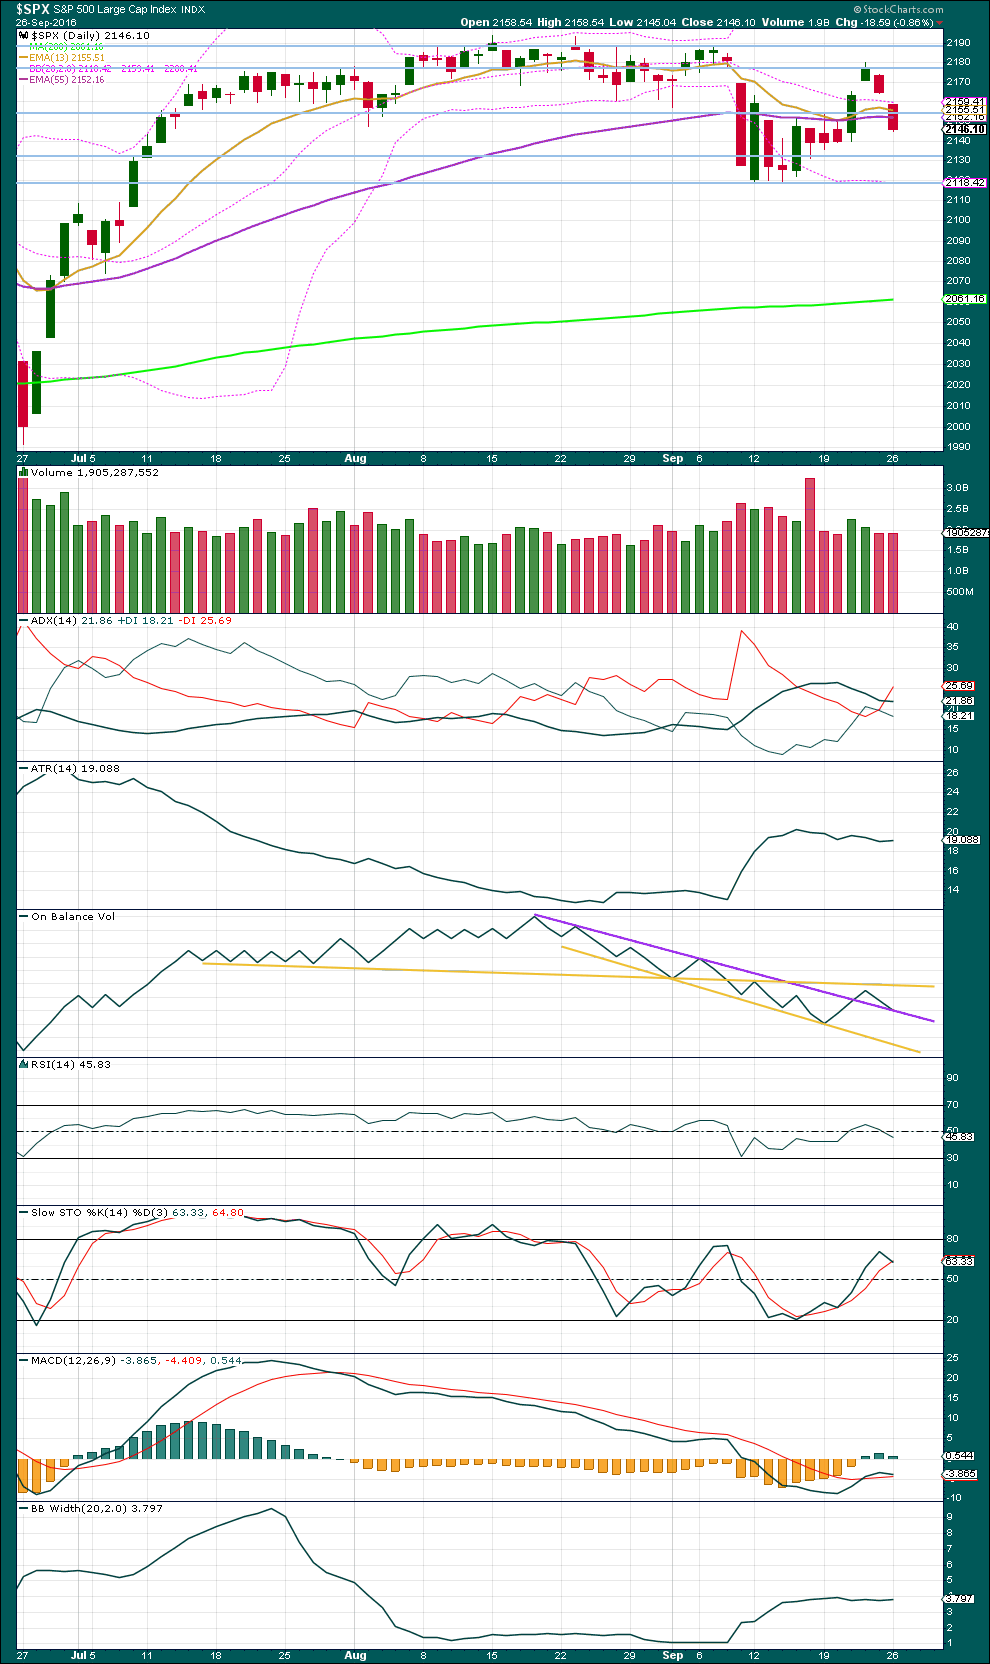
The last two red daily candlesticks come with light and declining volume. The prior upwards days had more support from volume. The fall is price is not supported by volume, so this is more likely to be a small pullback than the start of a healthy new trend. With Monday’s downwards day slightly lighter than Friday, it would be reasonable to expect a green daily candlestick for Tuesday.
ADX is declining, indicating the market is not trending. ATR is flat to declining, in agreement with ADX. Bollinger Bands have widened but are now remaining steady. This market is not trending. This market is consolidating.
Price did not find support about 2,155. The next support line is about 2,134, and thereafter about 2,120.
On Balance Volume gave a bullish signal with a break above the purple line. Now OBV has come down to test support at this line. This may assist to halt the fall in price here for now. This agrees with volume today. An upwards day for Tuesday looks like a reasonable reaction about here.
RSI is still close to neutral. There is plenty of room for price to rise or fall.
Stochastics has not yet reached overbought. Overall, a continuation of an upwards swing within this consolidation may be expected until price finds resistance and Stochastics reaches overbought at the same time.
There are three moving averages on this chart: a short term Fibonacci 13 days (gold), a mid term Fibonacci 55 days (purple), and a long term 200 days (lime). Both the mid and long term averages are still pointing up, and the mid term average is above the long term average. The longer term trend should be assumed to be up, until these averages prove it is not. The short term average has come down to kiss the mid term average and today it remains above the mid term average. The short term trend is fluctuating, exactly as expected within a consolidating market.
VOLATILITY – INVERTED VIX CHART
Click chart to enlarge. Chart courtesy of StockCharts.com.
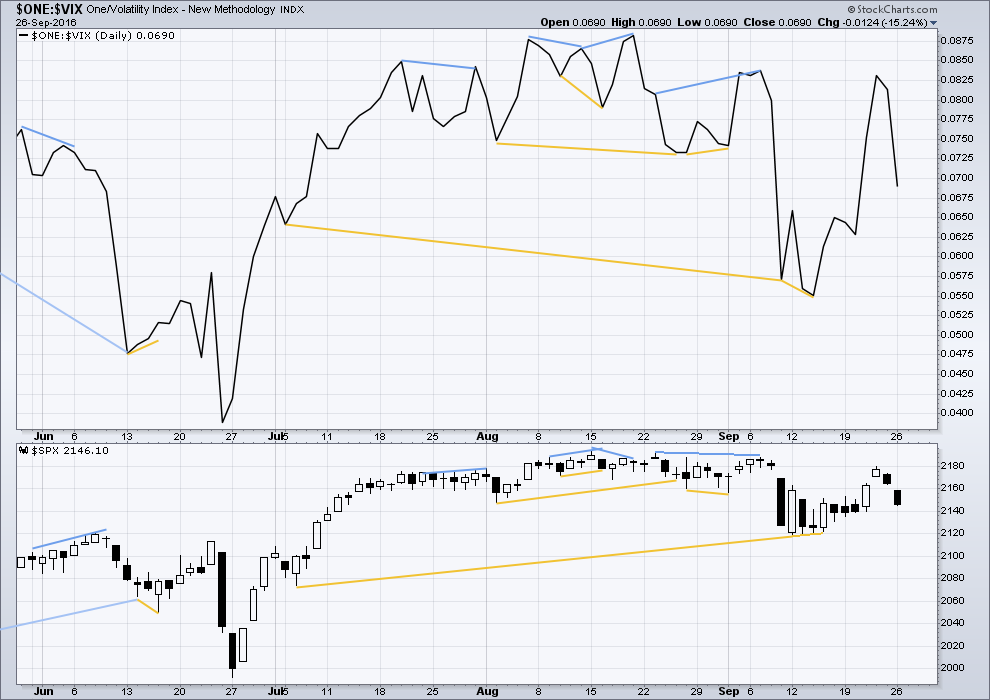
There are a few instances of multi day divergence between price and inverted VIX noted here. Bearish divergence is blue. Bullish divergence is yellow. It appears so far that divergence between inverted VIX and price is again working to indicate short term movements spanning one or two days.
At this stage, no further short term divergence is noted between price and VIX to indicate any weakness either way.
BREADTH – AD LINE
Click chart to enlarge. Chart courtesy of StockCharts.com.
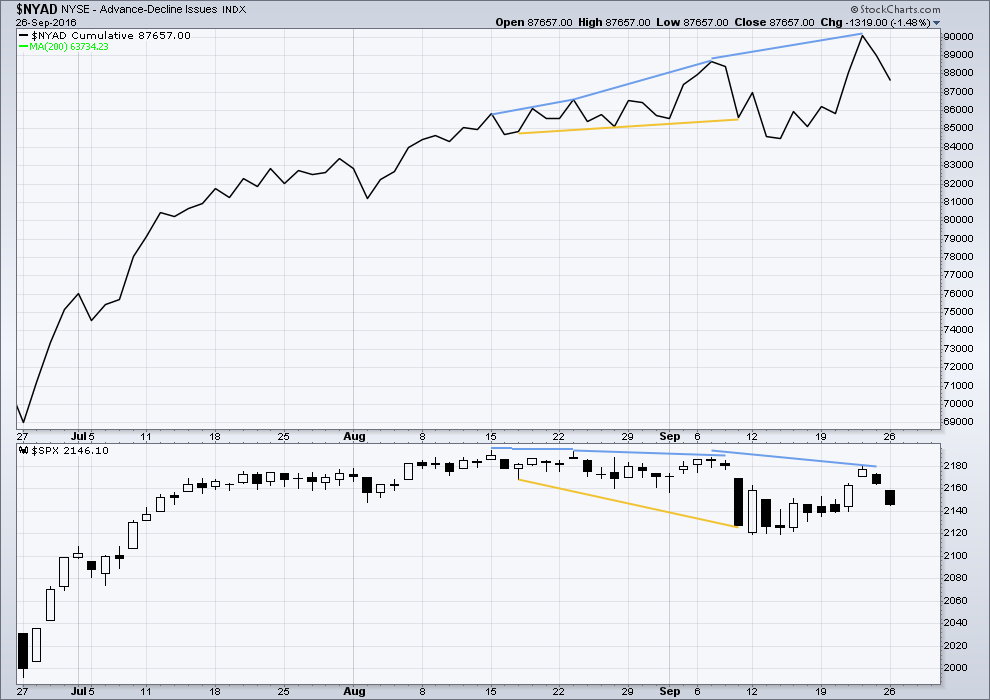
There is support from market breadth as price is rising.
Short term bullish and bearish divergence is again working between price and the AD line to show the direction for the following one or two days.
There is mid term bearish divergence between price and the AD line. The AD line made a new all time high, but price has not yet followed. This divergence suggests weakness in price. So far it has been followed by two days of downwards movement. It is reasonable to now expect this divergence is resolved.
DOW THEORY
Major lows within the old bull market:
DJIA: 15,855.12 (15th October, 2014) – closed below on 25th August, 2015.
DJT: 7,700.49 (12th October, 2014) – closed below on 24th August, 2015.
S&P500: 1,821.61 (15th October, 2014) – has not closed below this point yet.
Nasdaq: 4,117.84 (15th October, 2014) – has not closed below this point yet.
Major highs within the bear market from November 2014:
DJIA: 17,977.85 (4th November, 2015) – closed above on 18th April, 2016.
DJT: 8,358.20 (20th November, 2015) – has not closed above this point yet.
S&P500: 2,116.48 (3rd November, 2015) – closed above this point on 8th June, 2016.
Nasdaq: 5,176.77 (2nd December, 2015) – closed above this point on 1st August, 2016.
Dow Theory Conclusion: Original Dow Theory still sees price in a bear market because the transportations have failed to confirm an end to that bear market. Modified Dow Theory (adding S&P and Nasdaq) has failed still to confirm an end to the old bull market, modified Dow Theory sees price still in a bull market.
This analysis is published @ 10:34 p.m. EST.
[Note: Analysis is public today for promotional purposes. Member comments and discussion will remain private.]

Lara,
Can you please draw the boundaries for the 5th wave ending diagonal (ascending wedge) that you refer to in your post?.. Just need to be sure that we are seeing what you are. Thank you!
Updated hourly chart:
My labelling of minor wave B as close to completion is provisional. This labelling is almost certain to change.
B waves are the worst. Complicated, choppy, overlapping, there are more than 23 possible structures it may be. I’ve labelled it an almost complete zigzag but that may be only minute a or w of a flat, triangle or combination.
If it continues then about this point it may be mostly sideways.
When it’s done then a five down for minor C will complete a zigzag for intermediate (2).
O.K Guys, while we patiently wait for C down to arrive, I am taking bets on when the DJI 18,000.00 and SPX 2100 will be broken. Winner will be declared forum king/ queen for a day, and any one responding to a post by the winner will have to address him/her as “Your Royal Highness of Precise-ness”
My guess is that the pivots will both be broken on Friday September 30 at 2.59 P.M. Central Standard Time. 🙂
According to WSJ (sept. 25):
**********
“The third quarter was supposed to be when earnings growth returned to U.S. companies. Not anymore.
Companies in the S&P 500 are now expected to report an earnings decline for the sixth consecutive quarter in the coming weeks, according to analysts polled by FactSet. That slump would be the longest since FactSet began tracking the data in 2008.
The prolonged contraction has raised questions about how far stocks can rise without corresponding strengthening in corporate earnings.”
*********
What else!? SP is up 12pts… DJ more than 100 pts… There is definitely something I cannot understand…
“You cannot make yourself feel something you do not feel, but you can make yourself do right in spite of your feelings.” ( Pearl. S. Buck)
Welcome to Bizzaro World.
I think it kinda makes sense actually. The end of a fifth wave at Super Cycle degree should have a lot of divergence and weakness. It should be fundamentally unsound.
The weirder it all gets I think the stronger and faster the fall should be.
I think what happens when Super Cycle (V) ends should make those dramatic falls in Cycle wave IV look like a wee blip.
Your mission Mr Market, should you choose to accept it, is to break 18000 and 2100. As always, should you or any of your trading I.M Force be caught or killed, we will disavow any knowledge of your actions…This message will self-destruct in five seconds…
That indeed is the ticket. I refuse to light the fuse on the big guns until those pivots give way. I am playing it safe by continuing to accumulate volatility on big dips, and selling credit spreads. All eyes are on SPX 2100….I think the sharks are smelling blood…(the bears too… 🙂 )
With the ED looking more and more likely, a credible case could be made for laddering massive shorts six to eight months out….
Deutsche Bank is in trouble ! They fell another 3% to €10.22 during morning trading on the Frankfurt stock exchange.
How is this possible ? Central banks are at their best ever, in full great health, the economy is fully recovering and DJ + SP will soon close again near ATH !
How dares DB to be ill? What an offense !
Investors are increasingly worried about the financial health of the bank, which now faces a $14bn fine in the US for mis-selling mortgage-backed bonds before the financial crisis of 2008.
On Monday, the bank had denied suggestions that it had asked the German government for help in reducing the fine.
No problem !!! Super Hero FED will come soon and fix the problem ! Wo hoooo
I looked at the DB chart yesterday and figured that massive hammer was surely sign of an impending reversal, dead cat bounce though it would have been. The further plunge today ( do doubt courtesy of Merkel and company’s emphatic”Nein!!” to any talk of a bailout…let’s see how long that resolve persists…) means DB is a dead man walking…
I took a look at the all time data on Big Charts of DB yesterday. What a collapse!
It’s just so completely weird how this is being almost ignored by mainstream media.
Germany is the biggest strongest European economy. This is going to have a big impact on the world economy. It’s huge.
It’s completely bizarre how this is not being widely reported. In NZ I’ve seen zero coverage (but to be fair, not liking our media here much I don’t tend to go hunting for stuff)
Tim Knight last evening commented that DB is the only chart telling the truth about the state of the global economy, and apart from being strapped to an oxygen tube courtesy of the FED, the big US banks would look similar. We know of course the Italian lenders are also in deep trouble so it really is a head-scratcher that we are trading this close to all time highs. As long as the illusion has been in building and being perpetuated, so with opposite rapidity I expect it will vanish at the end…
This chart tells it all. It is an upside down world when Banco Santender is among the strongest performers. Its been fairly clear DB won’t be able to recover without a bailout which Merkel has refused. Interesting the DOJ asked for $14B compensation when they had to know getting paid was an impossibility. And then there is the laughable “merger” between DB and Commerzbank. Central bankers are surely are moving their chess pieces into position for what seems an inevitable crash of DB, with the Italian banks to soon follow. This is like watching a slow motion train wreck… DB is even lower today.
Then there’s this. from Zero Hedge.
This amazing chart shows DB derivative deck dwarfs the EU economy. Merkel won’t bail out DB, simply because Germany doesn’t have enough money to do so!
“Merkel Rules Out Bailout For Deutsche Bank: Depositor Bail-In Coming Up?”
http://www.zerohedge.com/news/2016-09-24/merkel-rules-out-bailout-deutsche-bank-depositor-bail-coming
What I simply am failing to comprehend is why a run on the bank has not started. Are the German people that gullible as to think their deposits in this ticking time bomb are safe??!!
Hyuk! Hyuk!
The theatre of the absurd is now even playing out on the stage of what should really be serious financial news.
Bloomberg has decided to deal with the egg on their faces over their earlier assertions that markets (plural!) had declared Clinton the debate winner. And what market (singular) they now assert “most clearly” certifies Clinton’s status as winner…???
The Mexican Peso!
Yep! You heard me. Not DAX , not CAC, not FTSE, not SPX, not DJI, not NDX, not DJT…but the PESO people! It after all really rebounded after the debate. Now that, is conclusive!
I think I will take a litte break from Mr. Bloomberg’s circus today.
That place has really gone downhill since Trish Reagan left about a year ago.
The departure of Stepahnie Ruhle six months later sealed their demise in my opinion.
The only question now is when Betty Liu and Tom Keene will leave for greener pastures. Frankly I am surprised that they are still there. How sad!
Vern,
Who do you think won the debate last night?
I literally saw only 15 about seconds of a rebroadcast on C-Span. I am deeply allergic to political speech I am afraid. I was quite surprised at how good Clinton looked and sounded during the short time I saw her speaking. Don’t get me wrong- this is no comment as to the veracity of anything she was saying. I did take a close look at the follow-up polls from the various news outfits and CNN was all alone in reporting her as the winner. It turns out that their methodology was quite suspect (polling pre-chosen majority of Democrat responders, small polling size) . Bloomberg also declared her the winner but did not cite any polling data, just that the peso rebounded…
Vern,
I agree with you about politics and political speech.
Me too. And Trump and Clinton? Life is too short to watch such a circus.
Nobody missed anything… It was BORING listening to Hillary’s Political Legalese Nonsense!
She Said a lot that seemed to go on and on endlessly and what she said meant absolutely NOTHING! Typical Politician!
The majority of the online polls has Trump as the winner with the CNBC Poll showing Trump won 68% to HRC’s 32% on 1,113,179 Votes… which I believe had the most participants.
http://www.cnbc.com/2016/09/26/vote-who-won-the-first-presidential-debate.html
Other Online Polls were posted in Zero Hedge in this article:
http://www.zerohedge.com/news/2016-09-27/hillary-vs-donald-so-who-won
Clinton won the poll on CNN … which after all is the Clinton News Network. The public could not vote on that poll. The way a supposed news organization propagandizes Hillary is sickening!
I don’t have any problem at all with conversation about Trump and Clinton in relation to markets and social mood.
But if we’re going to broaden that discussion to the merits or behaviour of either, that could get tricky.
I’ll be deleting anything that I see as negative or mean to the other side.
And I’ll also note that 48% of this membership is outside the USA. This membership is global. And those of us outside the USA may well have very different views to those of you inside the USA.
So if you bring up this topic Joe you’ll have to be prepared for some views with which you may disagree, and which may come from a very different POV.
Finally, in any discussion of this I’ll gently remind members to keep it especially polite and civil. I note too often on the interwebz that this topic often devolves to mean name calling. Now, I don’t think that will happen here, but lets keep this really polite. Pretty sure we’re capable of approaching this topic in a very civil manner.
Joe,
While you call CNN as Clinton News Network — because Hillary won that poll, it should also fairly be reported that most republicans watch CNBC and hence that poll would be slanted towards the republicans. (Even CNBC agreed to that). So lets be fair.
Finally, while I am politically neutral, it is fair to say that Trump did not look presidential (based on what I saw today on some highlights on CNBC). But the funny thing is that most trump supporters will vote for him, irrespective of what he does. Don’t forget he said and I quote : I could shoot somebody and I wouldn’t lose voters.
I am sad that as a country we could only come up with Trump and Hillary as our choices. The two party system works to the advantage of the uber rich and does little for average American in my opinion.
That’s why Donald J Trump is the champion of the Working man and woman… a voice for all those who don’t have a lobbyist in Washington … the silent majority does exist in the USA, it is NOT a myth! When we the people actually get involved in the election process and actually want to make a change for the better. It gets done!
For those here who are NOT in the USA… take note because you are actually going to get an education of how this constitutional republic really works and elects it’s President.
That is why Trump will win in an Electoral Landslide… Just like Ronald Reagan did!
If you’re listening to all the talking heads and the press… which are mouth pieces for the entrenched power… You all will be shocked!
One radio talk show host funnily refers to them as Clump and Trinton…! 🙂
Despite all that green in futures of European markets overnight, the are all in the red today, with DAX already down 1%. DAX was originally down, before they dumped all that cash, by 1.75%! Despite Bloomberg’s gleeful pronouncement that markets declare Clinton the winner (I guess they believe European markets don’t count), what price does when the markets open today may prove their glee to have been quite premature… 🙂
I am starting to think the idea of an ED for this final wave up has got to be taken quite seriously. Many very able analysts are citing this as the most likely structure. I think we are getting quite close folks….
The banksters bought futures from deep in the red once again last night, especially in Europe, and they started the buying early and often. They seem to be steadily loosing their ability to ramp the futures sky high and make it stick. When was the last time you say them pull it off? In fact buying futures out of deep in the red has been a good sign of late that the market would tank a day or two at the most later. I expect that pattern to continue and it fits well with the wave count. US futures have already started drifting lower…
Morning…First!!
Where is everyone?
Surfing 🙂