Last Elliott wave analysis expected more sideways movement for Tuesday’s session. This is exactly what has happened.
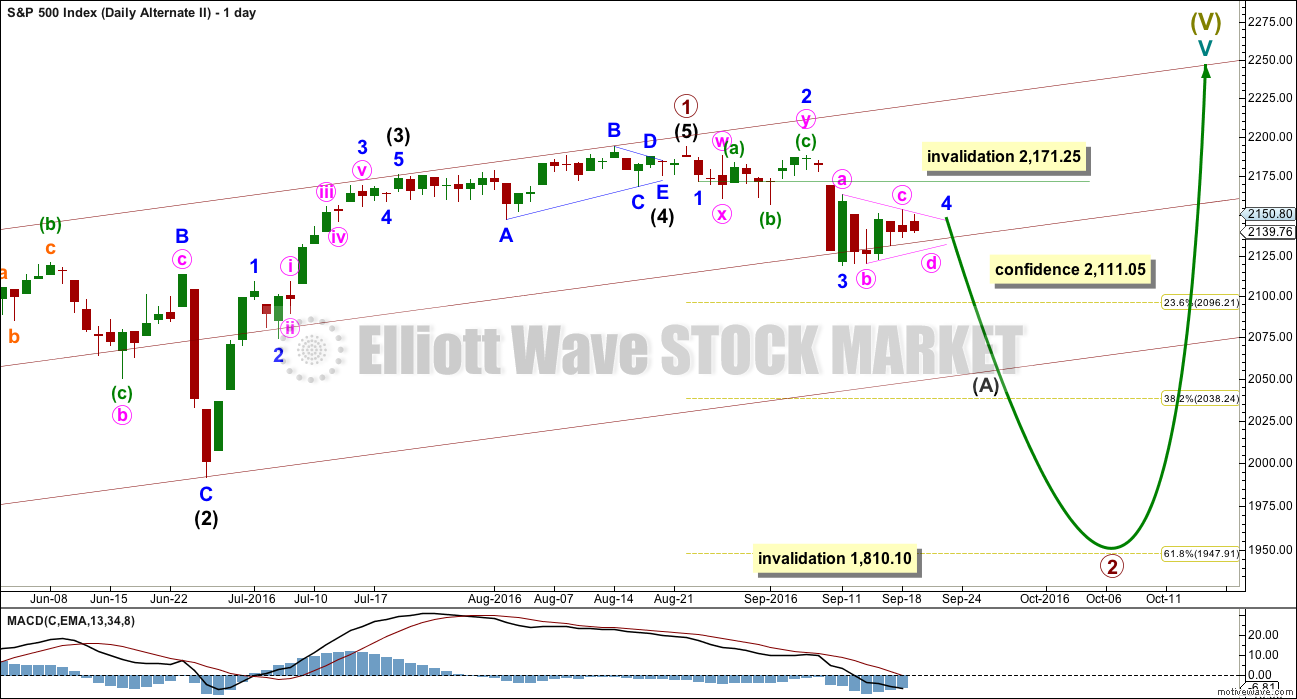
Summary: Sideways movement is most likely at this stage for a few days, a small pennant is forming. The breakout should be down. A new low below 2,111.05 would invalidate the main Elliott wave count and confirm the alternate. A new high now above 2,171.25 would invalidate the alternate and provide some confirmation of the main wave count.
Last monthly chart for the main wave count is here.
New updates to this analysis are in bold.
MAIN WAVE COUNT
WEEKLY CHART
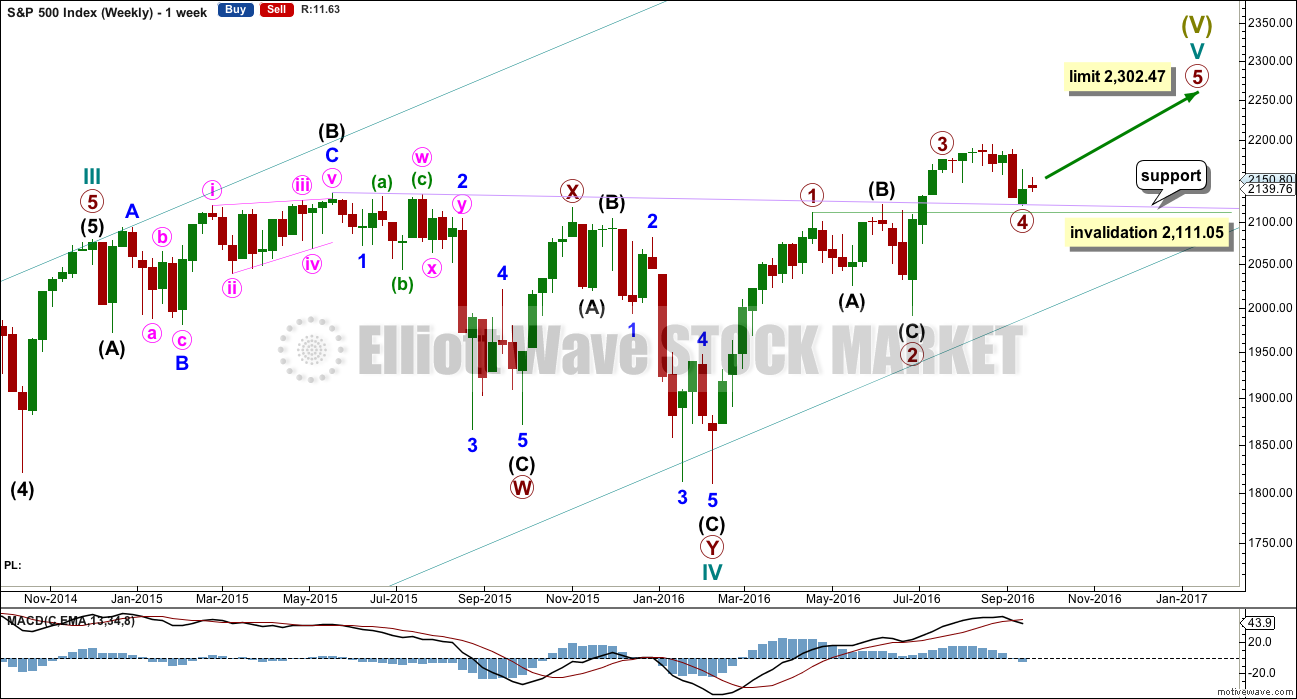
Cycle wave V must subdivide as a five wave structure. I have two wave counts for upwards movement of cycle wave V. This main wave count is presented first only because we should assume the trend remains the same until proven otherwise. Assume that downwards movement is a correction within the upwards trend, until proven it is not.
Primary wave 3 is shorter than primary wave 1, but shows stronger momentum and volume as a third wave normally does. Because primary wave 3 is shorter than primary wave 1 this will limit primary wave 5 to no longer than equality in length with primary wave 3, so that the core Elliott wave rule stating a third wave may not be the shortest is met. Primary wave 5 has a limit at 2,302.47.
Primary wave 2 was a shallow 0.40 expanded flat correction. Primary wave 4 may be exhibiting alternation as a more shallow combination.
Primary wave 4 may not move into primary wave 1 price territory below 2,111.05.
It is also possible to move the degree of labelling within cycle wave V all down one degree. It may be only primary wave 1 unfolding. The invalidation point for this idea is at 1,810.10. That chart will not be published at this time in order to keep the number of charts manageable. The probability that this upwards impulse is only primary wave 1 is even with the probability that it is cycle wave V in its entirety.
DAILY CHART
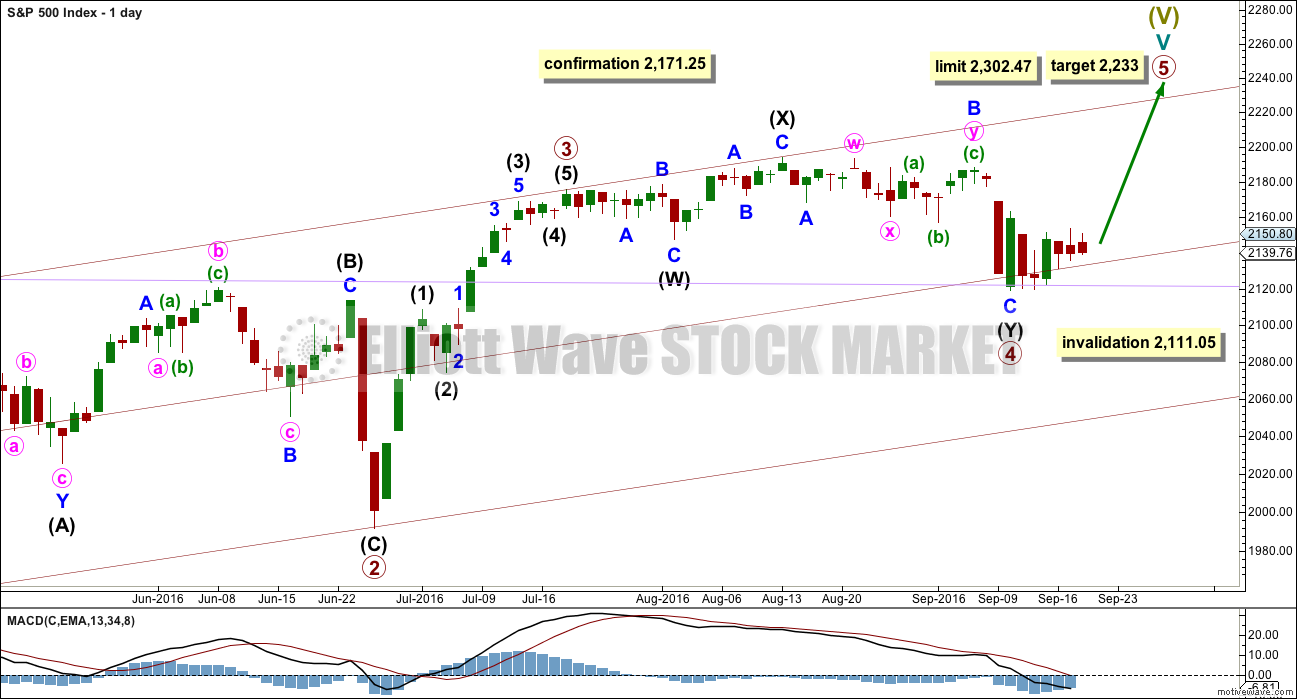
Primary wave 4 may be now complete as a double combination.
The first structure in the double is labelled intermediate wave (W) and is an expanded flat correction. The double is joined by a three in the opposite direction labelled intermediate wave (X). The second structure in the double is a zigzag labelled intermediate wave (Y).
The whole structure for primary wave 4 has a mostly sideways look, but the fact that intermediate wave (Y) has ended comfortably below the end of intermediate wave (W) must necessarily reduce the probability of this wave count. To achieve the purpose of taking up time and moving price sideways the second structure in a double should end close to the same level as the first and this one does not. This part of the wave count does not have the right look.
Primary wave 4 may not move into primary wave 1 price territory below 2,111.05.
Primary wave 1 lasted 47 days, primary wave 2 was even in duration at 47 days, primary wave 3 lasted 16 days, and so far primary wave 4 has lasted 39 days. The proportions between these waves are acceptable.
If primary wave 5 has begun here, then at 2,233 it would reach 0.618 the length of primary wave 1.
A new high above 2,171.25 would invalidate the alternate daily wave count below and provide some confirmation of this main wave count. A new high finally above 2,187.87 would provide further confidence in this main wave count; that would invalidate other scenarios for the alternate.
HOURLY CHART
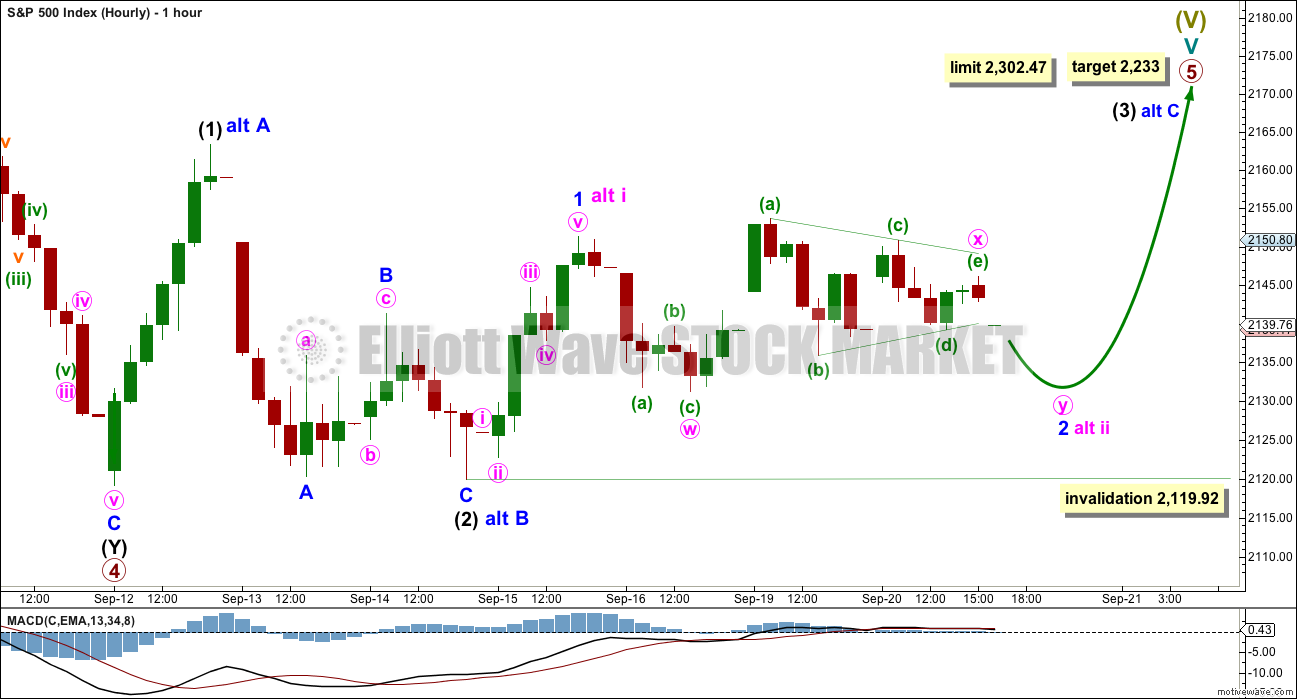
Primary wave 5 may unfold as either an impulse (more common) or an ending diagonal (slightly less common).
If an impulse upwards is unfolding for primary wave 5, then within it intermediate waves (1) and (2) would be complete. Intermediate wave (3) may only subdivide as a five wave impulse and must move above the end of intermediate wave (1) at 2,163.30. Within intermediate wave (3), minor wave 1 may be complete. Minor wave 2 may not move beyond the start of minor wave 1 below 2,119.92.
Alternate labelling: If an ending diagonal is unfolding for primary wave 5, then within it all the sub-waves may only subdivide as zigzags. So far a zigzag for intermediate wave (1) would be incomplete, so only minor waves A and most likely B would be complete. Minor wave C must move above the end of minor wave A at 2,163.30 to avoid a truncation. Within minor wave C, only minute wave i may be complete. Minute wave ii may not move beyond the start of minute wave i below 2,119.92.
Both an impulse or ending diagonal would now require a five wave structure upwards to move above 2,163.30. There is at this stage no divergence in expectations for direction.
Only when these two possibilities diverge in terms of expected direction or invalidation points will they be separated into two separate charts.
The structure of minor wave 2 or minute wave ii is adjusted today. A small triangle is forming. This may be an X wave to join two structures in a double. Minor wave 2 or minute wave ii may be completing as either a double zigzag or a double combination. The second structure in the double may be either a zigzag or a flat correction. Minute wave y may last another one to few days.
ALTERNATE WAVE COUNT
WEEKLY CHART
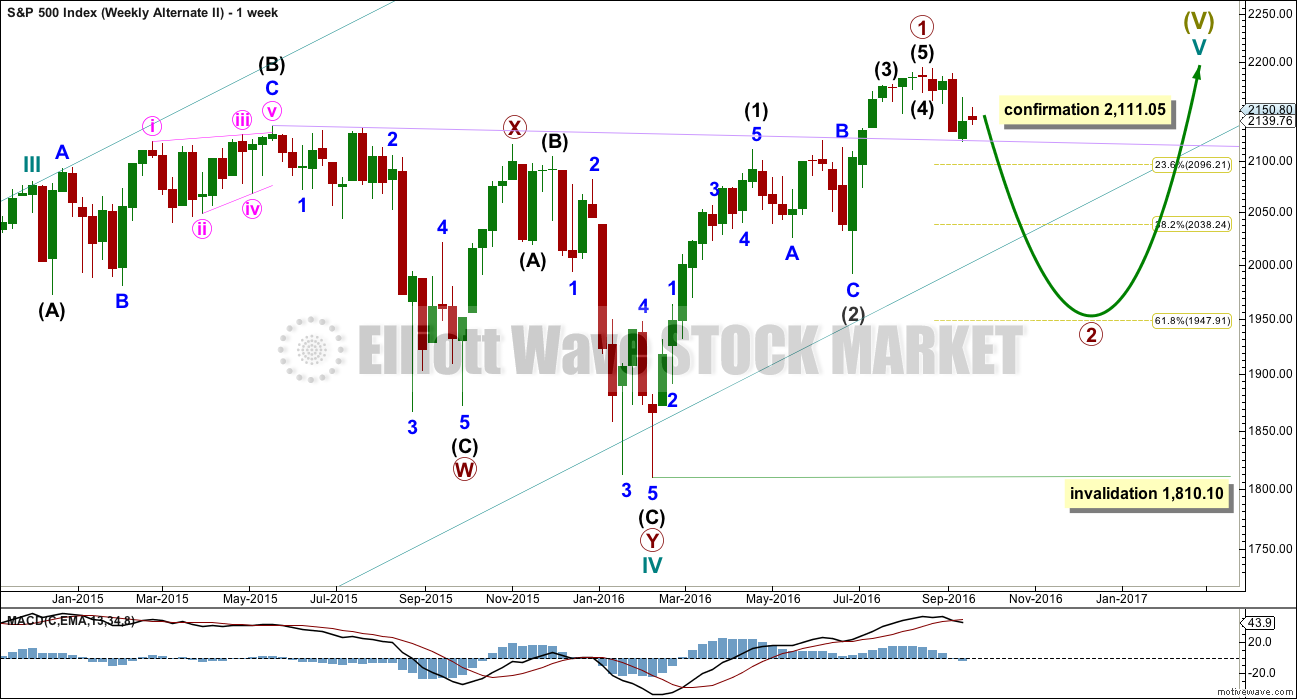
What if an impulse upwards is complete? The implications are important. If this is possible, then primary wave 1 within cycle wave V may be complete.
If the degree of labelling within cycle wave V is moved up one degree, then it is possible that recently Super Cycle wave (V) ended and the S&P has just begun a very large bear market to span several years. This scenario is possible, but absolutely requires price confirmation before it can be taken seriously. Only a new low below 1,810.10 would confirm this very bearish scenario.
If an impulse upwards is complete, then a deep second wave correction may be unfolding for primary wave 2. If primary wave 2 is to reach as low as the 0.618 Fibonacci ratio, then it would break below the larger teal channel about Super Cycle wave (V), which is copied over here from the monthly chart. This is possible: the S&P does tend to break out of its channels towards the end of a movement yet still continues in the prior direction before turning.
Primary wave 2 may not move beyond the start of primary wave 1 below 1,810.10.
DAILY CHART
If an impulse upwards is complete, then how may it subdivide and are proportions good?
Intermediate wave (1) was an impulse lasting 47 days. Intermediate wave (2) was an expanded flat lasting 47 days. Intermediate wave (3) fits as an impulse lasting 16 days, and it is 2.04 points short of 0.618 the length of intermediate wave (1). So far this alternate wave count is identical to the main wave count (with the exception of the degree of labelling, but here it may also be moved up one degree).
Intermediate wave (4) may have been a running contracting triangle lasting 22 days and very shallow at only 0.0027 the depth of intermediate wave (3). At its end it effected only a 0.5 point retracement. There is perfect alternation between the deeper expanded flat of intermediate wave (2) and the very shallow triangle of intermediate wave (4). All subdivisions fit and the proportion is good.
Intermediate wave (5) would be very brief at only 18.29 points. Intermediate wave (5) is 1.43 points longer than 0.056 the length of intermediate wave (1).
So far primary wave 2 may be unfolding as a zigzag. The common depth for a second wave is the 0.618 Fibonacci ratio of the first wave it is correcting, so a reasonable expectation for primary wave 2 would be to end about 1,948.
At this stage, it is beginning to look strongly like a fourth wave triangle is unfolding sideways within an impulse unfolding downwards. When the triangle is complete, then the breakout should be downwards. This may be an impulse for intermediate wave (A). It may also be the first impulse down of a larger bear market if the degree of labelling within cycle wave V is all moved up one degree.
The triangle for minor wave 4 exhibits perfect alternation with the combination for minor wave 2. Minor wave 2 lasted nine days. If minor wave 4 is to be even in duration, then it may continue for a further three days.
Minor wave 4 may not move into minor wave 1 price territory above 2,171.25.
Primary wave 2 may not move beyond the start of primary wave 1 below 1,810.10. A new low below this point would see the degree of labelling within cycle wave V moved up one degree. At that stage, a trend change at Super Cycle degree would be expected and a new bear market to span several years would be confirmed.
HOURLY CHART
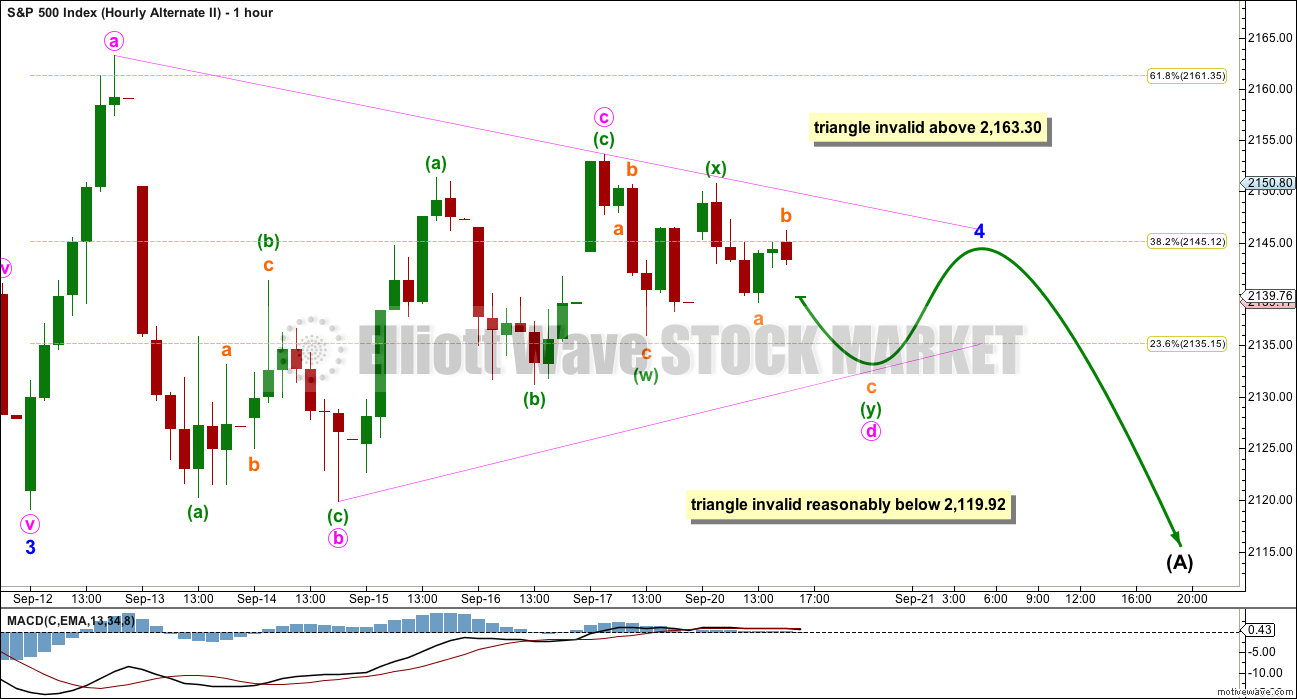
MACD is now hovering about zero, which indicates a triangle is most likely unfolding. The triangle may be a regular contracting or barrier triangle for a fourth wave.
Within the triangle, minute wave c may not move beyond the end of minute wave a above 2,163.30.
Minute wave d for a contracting triangle may not move beyond the end of minute wave b below 2,119.92. For a barrier triangle minute wave d may end about the same level as minute wave b, so that the b-d trend line is essentially flat. What this means in practice is minute wave d may end slightly below 2,119.92; this invalidation point is not black and white.
The final small zigzag for minute wave e may not move beyond the end of minute wave c for both a contracting or barrier triangle. It would most likely fall short of the a-c trend line.
This wave count expects overall sideways movement for most of this week to complete a small triangle. When it is done, the breakout for this wave count would be expected to be downwards.
This wave count expects tomorrow to see overall downwards movement, which may not move reasonably below 2,119.92. If price moves strongly below 2,119.92, then the triangle may be over. It may at this stage be labelled as just complete. However, triangles are very tricky structures and require patience. It is easy to label them as complete before they are. The triangle would have a better look and minor wave 4 would have better proportion with minor wave 2 if it were to continue further for another few days.
TECHNICAL ANALYSIS
WEEKLY CHART
Click chart to enlarge. Chart courtesy of StockCharts.com.
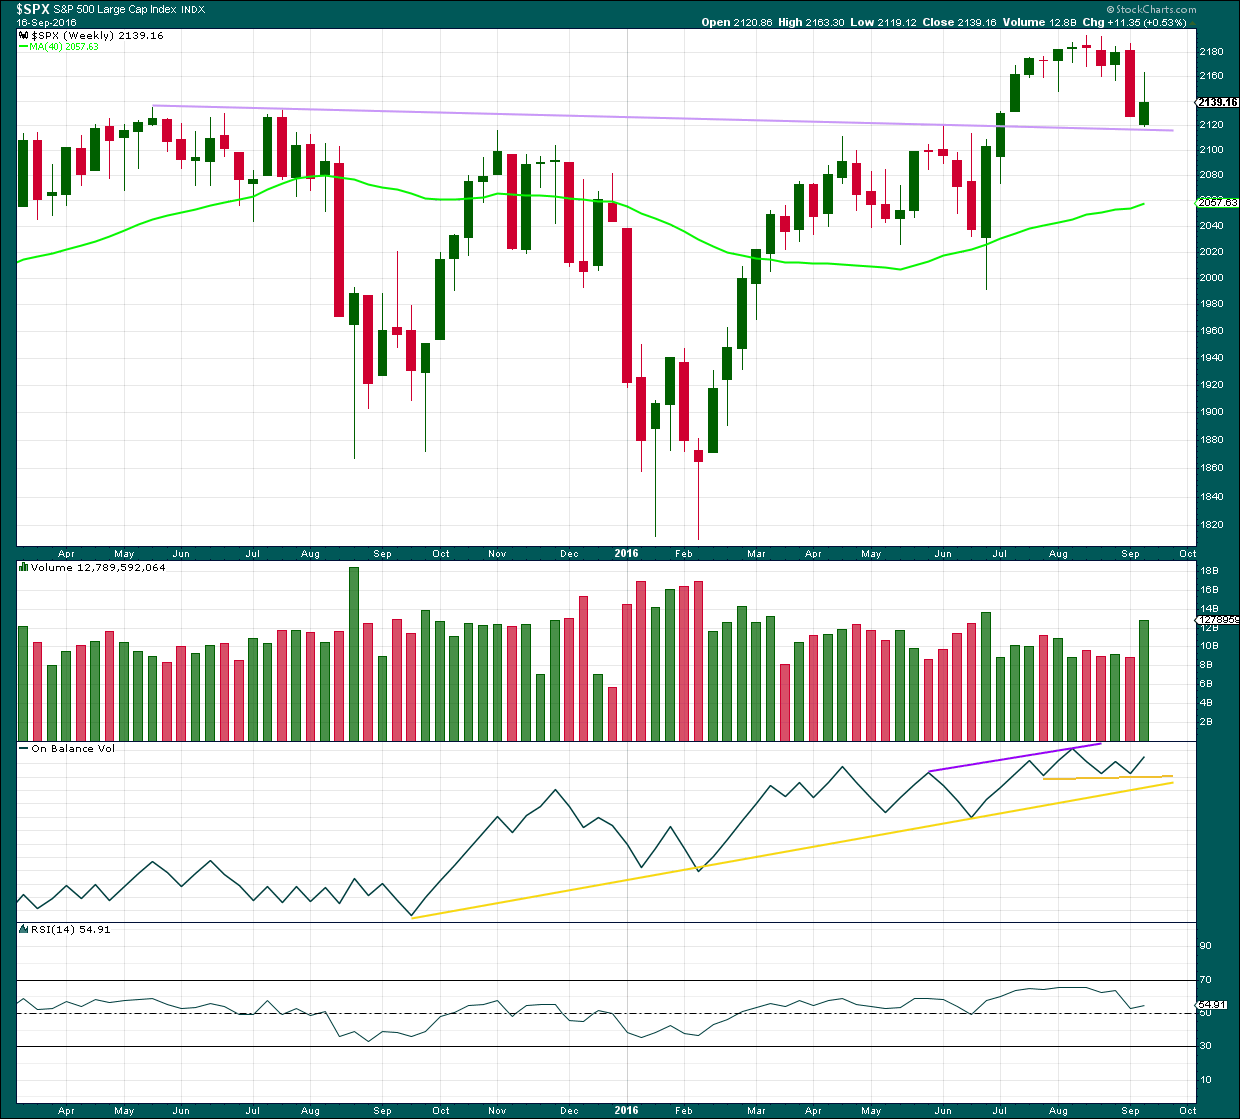
Last week completes a green weekly candlestick which has found support at the lilac trend line. The long upper wick is bearish and the green colour is bullish. A strong increase in volume indicates support for overall upwards movement, but to understand more clearly what is happening last week in terms of volume we need to look inside the> week at daily volume bars.
On Balance Volume is providing a bullish signal last week with a move up and away from the short yellow trend line. There is divergence between price and OBV last week: the high for last week from price is lower than the last green weekly candlestick but OBV has made a lower high. This indicates weakness in upwards movement from price last week and it is bearish.
RSI is still just above neutral. There is room for price to rise or fall.
DAILY CHART
Click chart to enlarge. Chart courtesy of StockCharts.com.
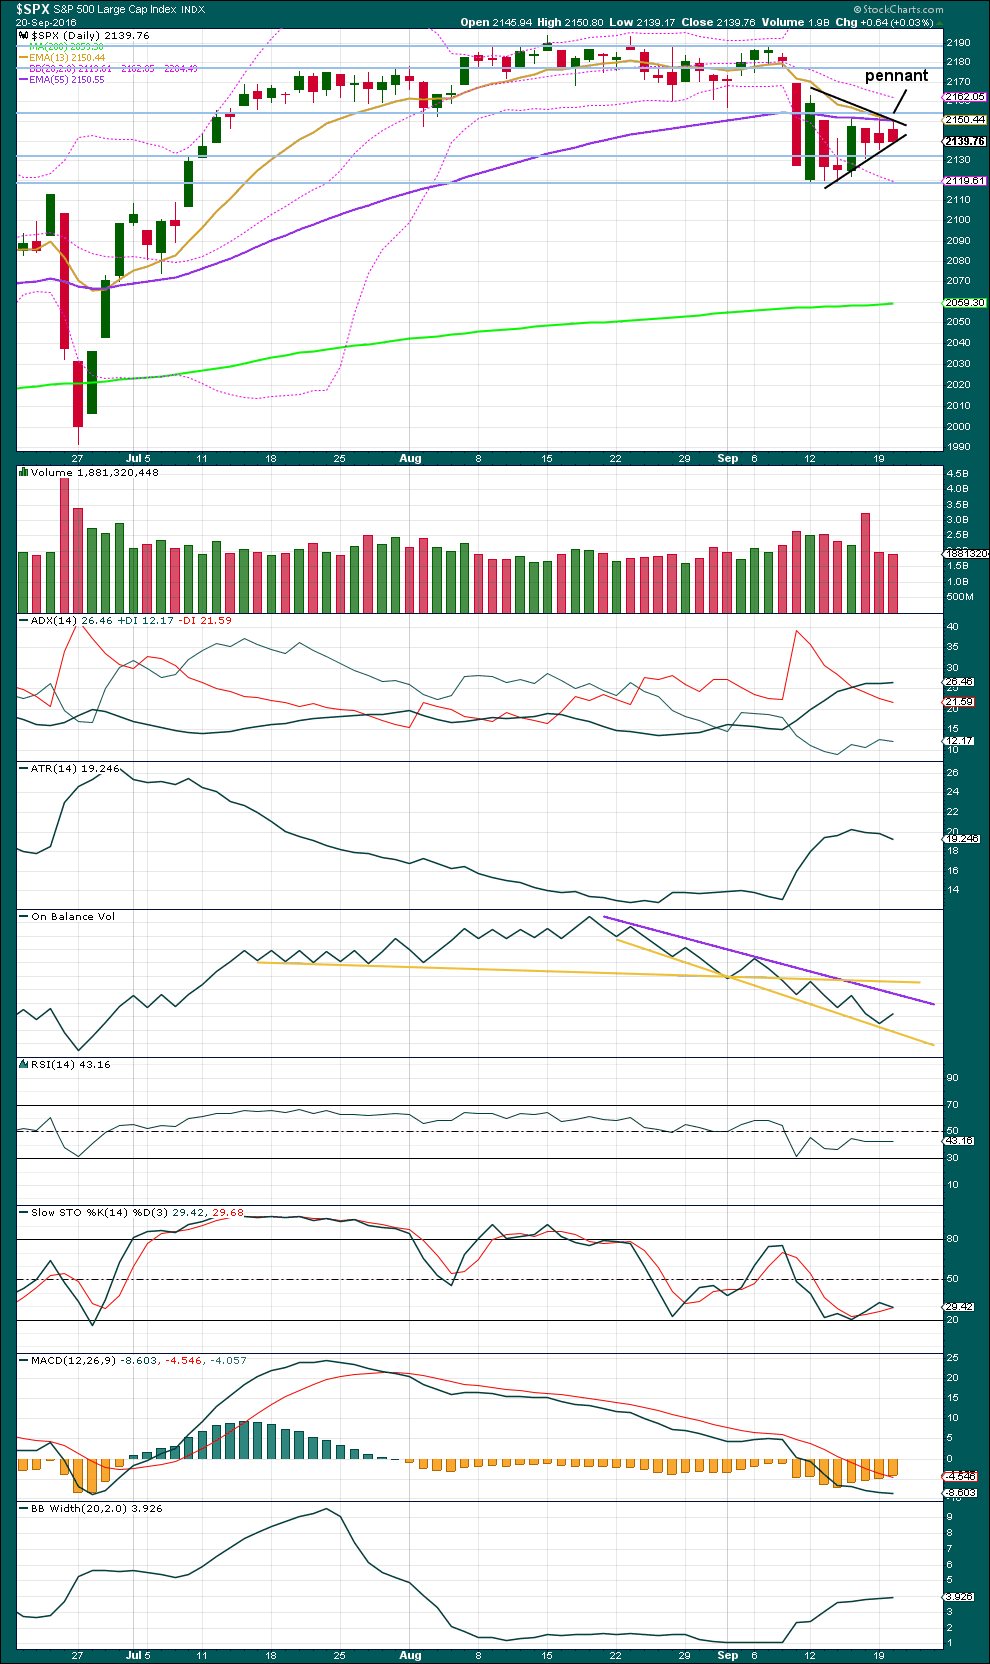
Price today has again moved overall lower to complete another red daily candlestick. Price has been moving overall sideways now for seven sessions; a small pennant pattern may be unfolding. This is supported by declining volume as price moves sideways (ignoring the options expiry volume). Pennants are reliable continuation patterns. A target for the next piece of downwards movement would be calculated about 2,082.
ADX is today is slightly increasing, again indicating the market may be trending. If so, the trend would be downwards as the -DX line remains above the +DX line.
ATR is declining. If a pennant is forming, then this makes sense.
Bollinger Bands continue to slightly expand; volatility has returned to the market. However, the rate of expansion has slowed. Again, with a pennant forming this makes sense.
On Balance Volume today has turned upwards negating the weak bearish signal given yesterday. The lower yellow support line is redrawn today to sit on the last OBV low. This line is steep but now has been tested five times, so it has reasonable technical significance. A break below this yellow line would be a bearish signal. A break above the purple line would be a bullish signal.
RSI is close to neutral. There is plenty of room for price to fall. There is no divergence between price and RSI to indicate weakness at this stage.
Stochastics is not extreme, but it may move into oversold and remain extreme for a reasonable period of time during a trending market.
VOLATILITY – INVERTED VIX CHART
Click chart to enlarge. Chart courtesy of StockCharts.com.
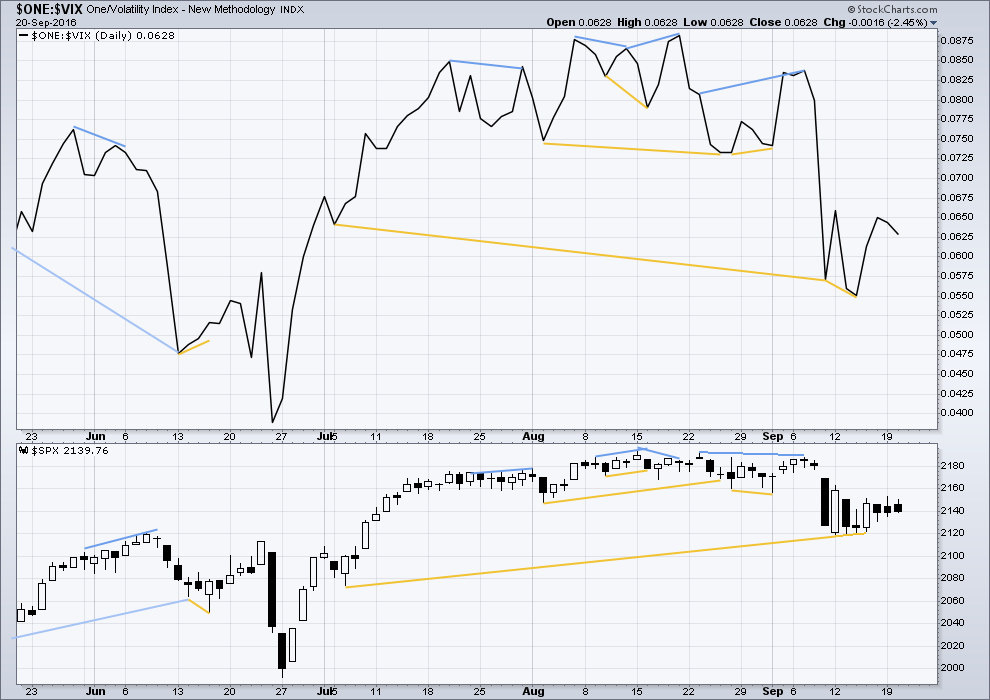
Volatility is declining as price is rising. This is normal for an upwards trend.
There are a few instances of multi day divergence between price and inverted VIX noted here. Bearish divergence is blue. Bullish divergence is yellow. It appears so far that divergence between inverted VIX and price is again working to indicate short term movements spanning one or two days.
At this stage, no further short term divergence is noted between price and VIX to indicate any weakness either way.
BREADTH – AD LINE
Click chart to enlarge. Chart courtesy of StockCharts.com.
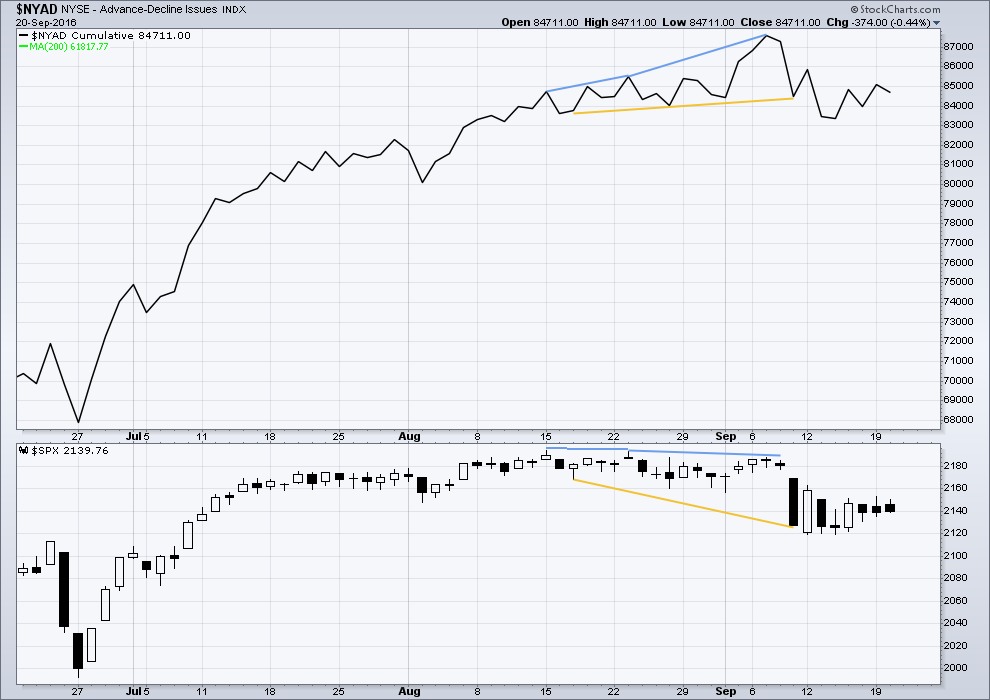
There is support from market breadth as price is rising.
Short term bullish and bearish divergence is again working between price and the AD line to show the direction for the following one or two days.
There is no short term divergence to indicate weakness.
DOW THEORY
Major lows within the old bull market:
DJIA: 15,855.12 (15th October, 2014) – closed below on 25th August, 2015.
DJT: 7,700.49 (12th October, 2014) – closed below on 24th August, 2015.
S&P500: 1,821.61 (15th October, 2014) – has not closed below this point yet.
Nasdaq: 4,117.84 (15th October, 2014) – has not closed below this point yet.
Major highs within the bear market from November 2014:
DJIA: 17,977.85 (4th November, 2015) – closed above on 18th April, 2016.
DJT: 8,358.20 (20th November, 2015) – has not closed above this point yet.
S&P500: 2,116.48 (3rd November, 2015) – closed above this point on 8th June, 2016.
Nasdaq: 5,176.77 (2nd December, 2015) – closed above this point on 1st August, 2016.
Dow Theory Conclusion: Original Dow Theory still sees price in a bear market because the transportations have failed to confirm an end to that bear market. Modified Dow Theory (adding S&P and Nasdaq) has failed still to confirm an end to the old bull market, modified Dow Theory sees price still in a bull market.
This analysis is published @ 09:18 p.m. EST.

One of those rare occasions on which I agree with those guys over at EWI.
This move off the lows looks corrective to me and they are calling it an ABC correction with new lows ahead after this C wave up completes.
A few journalists at the FED meeting concluded that Frau Yellen is confused. Eric Shatzker of Bloomberg News asked how how she can project 350 basis point raises over the next three years based on expected inflation when she is at the same time projecting continued declines in the productivity of the US workforce. She mumbled and stumbled and several journalists rightly concluded that her protracted blatherings bore no relationship whatsoever to the real world, and were intended only for consumption by numbskulls. Don’t get me wrong. Frau Yellen is no dummy- not by a long shot. They are blowing smoke up our keysters folks…just blowing smoke… 🙂
As the market has closed all I want to say is thank you for all the well wishes on my birthday and thank you Mr. & Mrs. Market for the fabulous birthday gift. It is quite generous of all of you all (as they say in the US South).
Next step for the bull is to fill the gap at SPX 2177. If it keeps going, that is very strong evidence for the bull. If it halts and heads south, it is evidence or support for the bear.
I cannot believe no one commented on the RBBMI reading which is still pointing up. By the way, I go back to the mountains the last week of October to take another look. I am expecting I may see a bear just before we have our Presidential election in the US. That is a perfect time for the bear to show up, shortly after the election from about 2200 SPX.
Have a great evening everyone.
At the end, I should have written, “from above 2200”.
I still think this move up is bogus. We have an open gap in both DJI and SPX that should have been filled today if this move up was a serious one and it remains open. Let’s see what develops. Closed sell side of a few bearish call spreads on triangle invalidation and now holding upside calls just in case…
Triangle invalidated! Looks like we are heading higher. Time to hedge short positions…
Updated hourly EW count:
Bad news. The triangle is going to be more long lasting and drawn out. But hey, look on the bright side folks, it means that we can be positioned for the fifth wave down.
Minute c moved slightly higher, it may fit as a double zigzag. My labelling of minuette (y) is at this stage provisional, I need more time on the 5 minute chart to look at how this subdivides.
Minute d down next.
Then minute e up.
Then the triangle would be done.
So at least two more days, maybe longer. A very testing time. Low volatility (again!) sideways movement.
Au contraire! That is excellent news! I can fire off a few more bearish credit spreads as this protracted wind continues! 🙂
NASDAQ now at a Lifetime High!
Bang ZOOM… To the moon Alice… to the moon!
This looks to me like a classic head-fake break from a protracted triangle…just saying…. 🙂
Given that the utilities, energy, and gold miners rallied harder than the other sectors tells me that downside is more likely. It’s a sign of an end of a bull cycle. So I’m expecting the alternate to play out…hopefully, anyway.
Hopefully grandma Yellen can’t get out of bed when the market needs support overnight–“I dreamt about accommodating, and I can’t get up.”
I knew there is a time delay for radio broadcasts but I did not think there was one for television. I just noticed that market data on Bloomberg is a few seconds behind my trading platforms’ streaming quotes…funny, although I doubt too many are using the Bloomberg TV stream to make investing and trading decisions…
Unf’ingbelievable…of course, I shouldn’t be surprised. This is exactly what Verne predicted that there would be no rate raise and now grandma Yellen thinks there may be a rate drop. This lady goes back and forth on everything…”economy not overheated yet”…bs. Accommodation, blah blah blah…what a dog! They have no credibility…I wish people would stop asking if they are worried of losing credibility…they now have none. How much more “evidence” do these idiots need? They have all the data in the world.
And then there’s the story of BOJ buying bonds to prevent the bond yield curve from rising…THAT’S NOT A FREE MARKET.
No volatility at all…I can’t believe it. Has anybody ever seen this before?
And yes, I think grandma Yellen is lying about supporting the current administration. One would think that if things are so super great, we would raise rates…be less destructive to future money.
I’m thinking that gold will rise with the idiotic market…no sense being bearish this crap as it is being artificially supported. I see smarter investors going in gold for the longer term.
Those keystone cops are in far more trouble than they know. Their problem now is that when we get the first quarter of negative GDP growth, which is inevitable, they do not have much room to ease. If there is even so much as a hint of implementing negative rates in this country you will have an immediate and relentless run on the banks as folk rush to withdraw deposits…and there goes the fractional house of cards….
That is a very good point, Verne. A few months back, Warren Buffett (I’m not a fan of him either, but he’s smart and is a huge player) stated that he was considering pulling out physical cash from a bank and putting it in his own personal vault…he’s someone who likes to have cash in his hand, and I agree with him on that.
It’s overdue for a run on the banks like we had in the 1930’s…when will it happen? Couple months, few years, decades? Timing is everything, but fraud is welcomed in this market. Trust me, Buffett should have gone to jail in 2011, 2012 timeframe…and he is certainly one of the nicer fraudsters.
I suspect that Buffet, as well as any one else paying attention has already taken his cash out of harm’s way…
You are a little late on the credibility issue (glad you are on board now) but the Fed lost every last ounce of credibility early in the year when they didn’t raise .25 per meeting in 2016 after starting in December 2015.
That whole board better start getting their resumes out there… they all will hit the unemployment line SOON and joining that 20%+ of Americans that don’t have a job they are trained and qualified to do. Hey Federal Reserve board… the Fast Food Chains are hiring! Would you like fries with that order??? That will be the extent of your future analysis.
The volume and price range suggests that the bots are busily selling to one another. The banksters are going to have to make a big cash dump before the close if they want to keep this animal afloat….
Good morning Verne. You have me giggling here before coffee.
Now I have a little vision in my head of little bots doing business with each other…. and they’re kinda cute 🙂
Me too! Can you imagine? ” And here is your change madam bot…thank you very much for your business!” 🙂
There goes yammerin’ Yellen.
“We have decided that the case for a rate increase has substantially strenghtened, but have decided to wait for further evidence…” Yada! Yada! Yada!
Hee! Hee! Just you wait till November; we gonna raise for sure!! Mppffffff!!! 🙂
That is Code for…
“Well the presidential election is in November and WE all who vote on the board and some of the regionals don’t care and haven’t cared all year about anything other than getting Hillary elected. So we are leaving rates unchanged again. When the election is over… we shall either continue to keep rates unchanged or go to Negative Interest Rate Policy in 2017
OR
If that outsider wins, we shall immediately move to normalize interest rate policy like we should have 3 years+ ago!”
Yeah. I had completely forgotten about the political implications but you are right of course. A rate hike at this stage would have certainly been another nail in the coffin of Ms. Clinton…
Speaking of politics, what really upset me recently was when Obama campaigned with Hillary and said, “if you don’t vote for Hillary, it’s an insult to me.” So you’re telling me that there’s only 2 choices?!? I’m not a fan of Trump, but I certainly dislike Hillary and all of her corruption.
What really makes me mad is when someone tells me what I have to do, regardless of how I feel about that politician–it’s not true democracy or republic basis. So I fear that my sister (huge liberal) will do whatever Obama tells her to do and vote for Hillary even though she doesn’t agree with her…yup, she is that dumb politically.
The narcissism of of this man knows absolutely no bounds.
It also speaks volumes of the remarkable contempt he has for his audience to make such a statement.
Most intelligent folk would view that kind of condescension as reason enough to not vote for Hillary….I certainly, as you opined, would.
Wow! Those puts did not wast any time going into the green…!
Selling SPY 214 calls of straddle a decent 25% pop.
Adding to 214 puts for double tap…
I can’t stand it. Is the entire world gone stark raving bad wasting all this time talking about whether that incompetent and corrupt squad at the is FED going to put a gun to their own heads???!!!
Gimme a break!!!!!!
He he – mind that blood pressure now Verne me old pal LOL 🙂 🙂
Still watching from the sidelines – just as well I don’t rely on trading to make a living or I’d have very big problems atm.
Just watchin & awaiting 🙂
Hyuk! Hyuk!
I really take these dolts on the tube way too seriously….I should know better… 🙂
Yeah. Quite a few individuals I know who used to trade full time have moved on. Anyone whose trading style depended entirely on volatility for success has really found it hard to turn a profit in this moribund market.
I am deeply grateful to the trader who taught me some time ago that the way to make consistent profits in the market was not by buying, but by selling. I have no idea how folk who don’t use credit spreads and trade for a living stay alive.
As you say, thankfully some of us have other means…
Broken trend-line…
Moving back up to test underside of broken trend-line of the last week…
My confidence is based on the following logic: at the end of the day, FED’s credibility is on the table. FED echoes the most powerful economy in the world. Beginning 2016 they said (with conviction) that they will hike more than once this year. They might don’t move today, and decide to wait for the next meeting in december, ok!
What will happen if some negative economic event begins to show up? There will be no more 2016 meeting available to delay…and the FED will loose its credibility in front of the rest of the world … especially in front all those godforsaken countries -:)
The U.S election (as far as the 2016 runners are concerned – no offense) is no real matter to be proud of … and U.S has to stand proud in front of the rest of the world. BOJ has failed … ECB has failed … BOE has failed …it’s time for the FED to stand for freedom!
“FED credibility” is the ultimate oxymoron. Whatever credibility this outfit may have had I am afraid has been long ago squandered. They have a Faustian choice between continuing to be the laughing stock of the global community, at least to those who have the slightest of clues, and blowing up global markets and bringing about their own ultimate demise. That is an easy call… 🙂
If Lara’s alternate count turns out to be the correct one, it is going to call for some nimble trading in the weeks ahead. Wave five of intermediate A of primary two would in all likelihood bounce off the SPX 2100 level.
If we get an expanded flat, the market could conceivably go on to new highs in an intermediate B of primary two, followed of course by a bull massacre in an intermediate C of primary two down to complete the correction. I have a sneaking suspicion that this is exactly what we are going to see develop. That intermediate C down would be the perfect vehicle for shaking out weak bulls just ahead of the final manic run to the top in primary three up. Makes your head spin doesn’t it??!! 🙂
FED will hike. Period.
Hi Eric:
I must say I admire your confidence. Have you entered any positions that anticipate a rate hike?
I always like to ask whether folk put their money where their convictions are. I personally have been short TLT for the past month with an equally firm conviction that the FED will not voluntarily raise rates this year. I entered my short position when TLT was trading at 139.
Hi Vern,
my confidence is based on a belief that is held with personal strong conviction .. despite, I must admit , there is superior evidence to the contrary!
I have one short Mini-Future Certificate on the SP, with leveraging effect. Financing level is 2200, therefore the leverage is not that high.
From Europe, we can trade with CFDs indexed on futures. I will as well wait 2 p.m and scalp short the SP with SL.
Bonds will react quicker, whatsoever….
“This place is full of trouble, torments, and amazements. Please come, heavenly powers, and guide us out of this godforsaken country!” (Shakespeare – The Tempest)
Eric,
Godforsaken country??? Do you live in France?
Amen! Good luck to us all!
Good morning to all. I had to write today because it is my birthday!
I have been reading the posts. But because of time constraints and the fact that my home computer has been in the shop for several weeks, I have not been writing on this blog. Another reason is that it seems most who write here may be perennial bears. It is tough to be a bull in such an environment.
I went 50% long the markets shortly after the 2134 breakthrough. I went 100% long a bit afterwards. As Lara’s analysis indicated at the time, the breakthrough confirmed a bull market count. I have stuck with it and all positions are profitable.
Then at the beginning of September I went to the mountains of the Western US looking for bears. I could not find any and I could not find any signs like bear scat! What I did find was lots of bull elk. Their bugle calls were heard day and night. So the RBBMI (Rodney’s Bull Bear Mountain Indicator) agreed with Lara’s main Elliott count. The bull is here. Well, take that for what it is worth. Some say it is a lot of bull. We also had the VIX close above its BB then inside followed by another day lower. This often signals a very good SPX buy.
I was very happy to see Olga posted a few days back. Hi Olga.
Today and the rest of this week may be very revealing as we break out of the triangle. I agree with Verne, if the DJI 18,000 and SPX 2100 round numbers are not taken out soon and decisively, we may be off to the races upwards with the next bull wave. I am still of the opinion we may see a bull market blow off sometime soon to 2500. Election time is just around the corner in the US.
Have a great day everyone and may you have good health and prosperity.
Happy Birthday Rodney! Great to hear from you 🙂 🙂
Hi Rod! Great to hear from you.
Be sure to hedge! 🙂
I happen to agree that we have 50/50 chance of a third of five up yet to come. Macro economic conditions also tells me that a top being in is not out of the question so caution on the long side is in my humble opinion warranted. As indicated ( ad nauseam), a break of the pivot, will open the spigot! 🙂
As far as being a perma bear, that does not mean there are not profits to be made on the bullish side!
I have been happily selling rips the last week…what fun!!! You do have to be nimble though.. 🙂
Happy Birthday to you! 39 again ?
Happy Birthday Rodney. Good to hear from a bull on this site. I agree with you. We could stay volatile for few days, even go down some but end of the year will be higher. Enjoy your day!!!
Happy Birthday to you!
Happy Birthday Rodney!
Happy birthday Rodney, and may you have many more.
As Verne says, hedge. There is again a possibility that a top is in, but then we’ve been here before. It’s not confirmed.
For now, if 2,111.05 is breached then you know what that means. Either a deep pullback underway, or the start of a bear market. And we won’t know which one it is until 1,810.10 is breached.
So happy to hear you’re lurking about 🙂
The dysfunction, and deplorable (and yes, that is the proper use of the word!) desuetude of the purveyors of so-called financial news continues. Sadly, this means it also continues in the thinking of most market participants. It is bordering on amusing to watch the fulminating over what irrelevant banksters are going to do next, while almost completely ignoring the most critical financial news of the hour, namely the imminent collapse of DB. The paucity of news reporting on this seismic event is not at all commensurate with its importance. Make no mistake about it. I don’t care what evaluations they are currently trading at, the fact of the matter is that the collapse of DB spells the demise of every major financial institution trading on global markets, as well as some that are not. The are all joined at the hip. It is the one glaring fact that should cause us all to seriously consider the possibility that a top may already be in, in this ill-fated market. Tread carefully.
Yes… dysfunction, and deplorable! But it is even deeper than that… Have you read the latest by David Stockman??? The full article is worth a read! Here are two highlights…
The Biggest Washington Whopper Yet
by David Stockman • September 20, 2016
You can’t find lazier people than in the mainstream financial press, but their exuberant cheerleading about the purported 5.2% gain in the real median household income in 2015 surely was a new high in mendacity. And we are not talking about the junior varsity here: The Washington Post was typical with a headline of superlatives followed by even more exuberance in the text:
+
We call it the “birther” theory of the labor market. It turns out that 52% of all the new jobs—-5.25 million—-reported by the BLS since the end of the recession were imagined, not counted.
This amounts to still another whopper from the government statistical mills, and more evidence that the so-called recovery is based on a tissue of lies.
http://davidstockmanscontracorner.com/the-biggest-washington-whopper-yet/
Anyone placing stock in any statistic coming out of the cabal of malefactors now running the US government need to have their head examined… 🙁
Vern,
What is interesting is that when data is bad, then bears jump on it as evidence the economy is bad and so on and so forth. Yet when data is positive, then they say it is fabricated. Can’t have it both ways. Most people with a 401K, owning a house, real estate , other investments have definitely done better from the low of 2008. I don’t think you can dispute that. Whether it is artificially lifted; that is another story.
All the Data is Fantasy… It’s ALL Fudged, good and bad! Why? Because anything that is fudged must reverse at some point!
If you ever have done any accounting or are educated in it… it’s is buried in some form of adjustment or reserve. If you keep an honest balance sheet… at some point all these adjustments must reverse. If the balance sheet is fictional also, then it’s really going to all go to zero!
That may be an oversimplification Sundeep. Remember not too long ago the smart bears were all making bullish trades on bad news as the market was interpreting bad news as “good”. The implication being that the FED would not raise rates and possibly administer additional stimulus. If you know how to read these reports, there is absolutely no doubt that they are all lies. They are clearly attempting to portray the state of the economy as far better than it actually is. They have correctly reckoned on the ignorance and gullibility of the masses to pull off the con. Whether you look at top and bottom line revenue of US companies the last 12 quarters, the number of “estimated” new businesses and jobs created, the plummeting velocity of money, and the constant downward revision of GDP growth…well…you get my drift…
First !!!!
BOJ in a few hours and then FED tomorrow. Both stocks and currency markets should see some volatility.
aaaaannnnd… the S&P goes sideways. Again.
This market tests the patience of saints!