In the short term, some downwards movement was expected for Wednesday’s session, which is exactly what happened.
Summary: The trend remains the same, until proven otherwise. Assume the trend is up while price is above 2,147.58. In the short term, tomorrow may see lower movement to 2,171 – 2,168 before the upwards trend resumes. The mid term targets are 2,332 or 2,445. If price makes a new low below 2,147.58, then probability will shift to a deep pullback beginning, target zone 1,938 to 1,881.
Last monthly chart for the main wave count is here.
New updates to this analysis are in bold.
MAIN WAVE COUNT
WEEKLY CHART
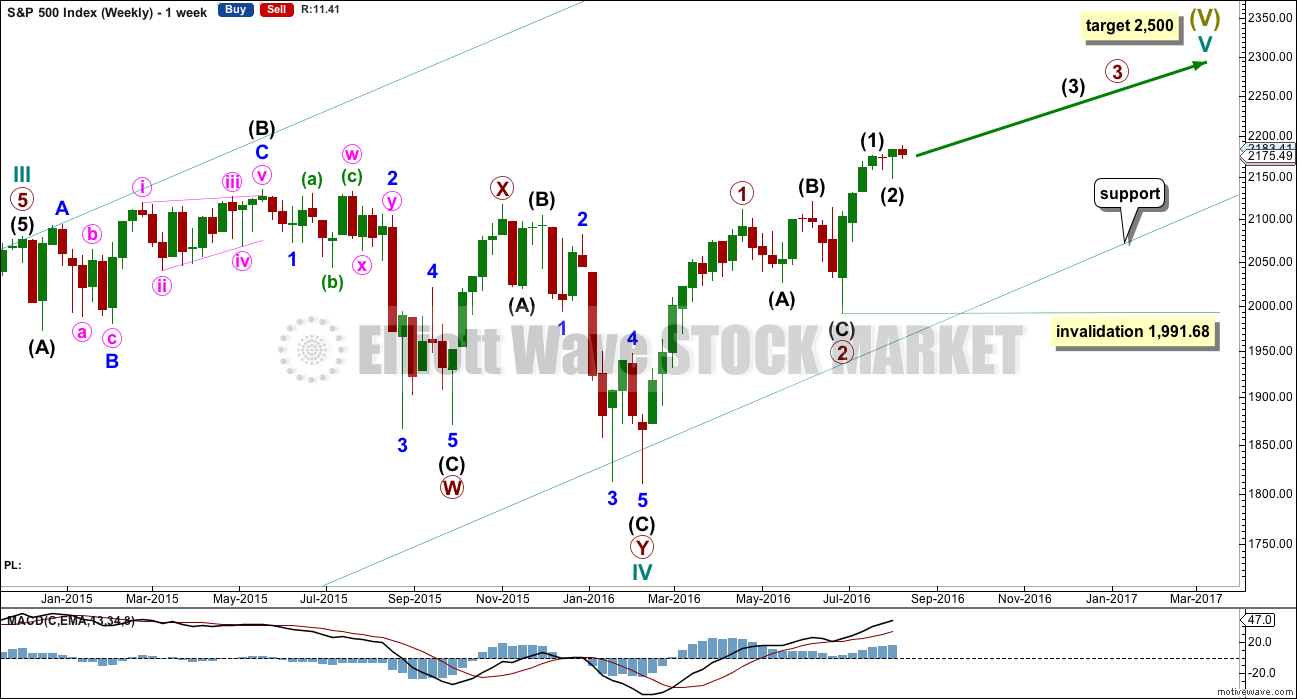
Cycle wave II was a shallow 0.41 zigzag lasting three months. Cycle wave IV is seen as a more shallow 0.28 double combination lasting 15 months. With cycle wave IV five times the duration of cycle wave II, it should be over there.
Cycle wave I lasted 28 months (not a Fibonacci number), cycle wave II lasted a Fibonacci 3 months, cycle wave III lasted 38 months (not a Fibonacci number), and cycle wave IV lasted 15 months (two more than a Fibonacci 13).
If the target for cycle wave V is for it to be equal in length with cycle wave I, then it may also be expected to be about equal in duration. So far cycle wave V is in its sixth month. After this month, a further 22 months to total 28 seems a reasonable expectation, or possibly a further 15 months to total a Fibonacci 21.
This first weekly wave count expects the more common structure of an impulse is unfolding for cycle wave V. Within cycle wave V, primary waves 1 and now 2 should be over. Within primary wave 3, no second wave correction may move beyond its start below 1,991.68.
There is one other possible structure for cycle wave V, an ending diagonal. This is covered in an alternate.
DAILY CHART
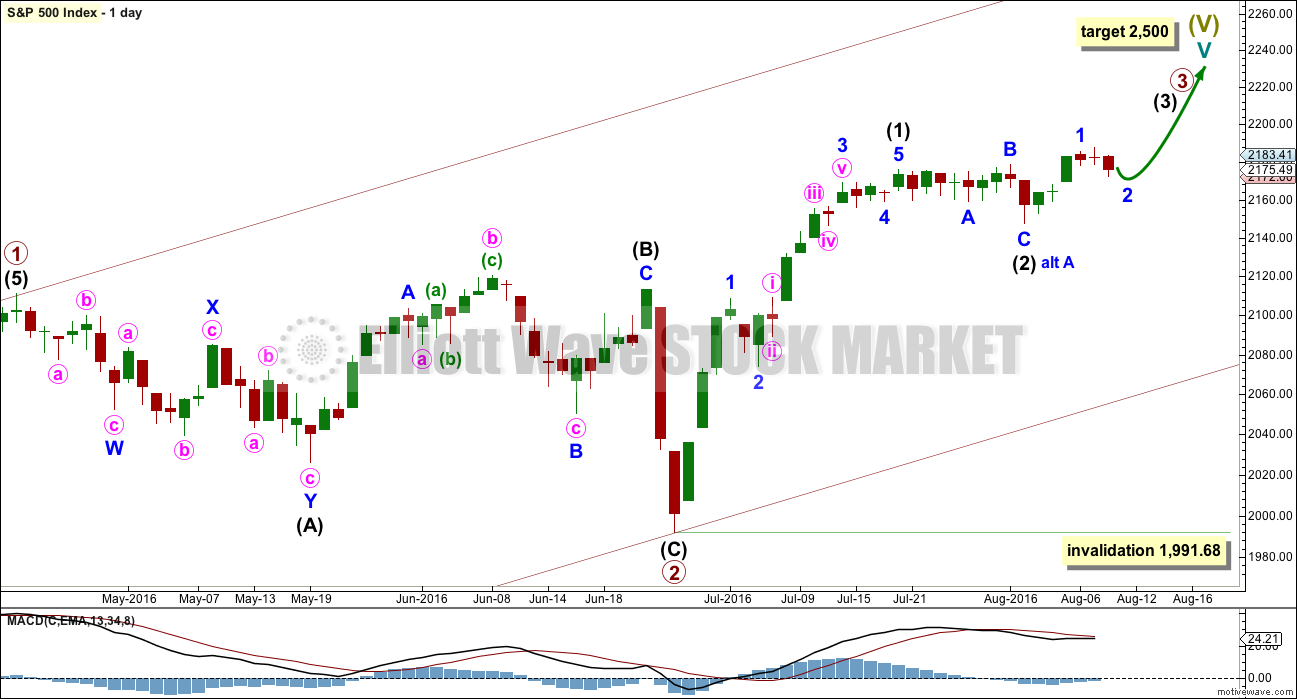
Primary wave 2 is complete as a shallow regular flat correction. Primary wave 3 is underway.
Within primary wave 3, intermediate wave (1) is a complete impulse. Intermediate wave (2) may now be a complete flat correction.
If the degree of labelling within intermediate wave (2) is moved down one degree (alternate labelling), then it is still possible that only minor wave A is complete as a flat correction. It is possible that intermediate wave (2) may complete further sideways as a longer lasting flat correction, or a double flat or double combination. All options would expect sideways movement though, not a deep pullback.
Within a possible continuation of intermediate wave (2), there is no upper invalidation point for the idea because there is no rule stating a limit for a B wave within a flat. There is a convention within Elliott wave that states once the possible B wave is longer than twice the length of the A wave the probability that a flat is unfolding is so low the idea should be discarded. Here that price point would be at 2,203.68.
Above 2,203.68 more confidence in this wave count and the targets may be had.
Intermediate wave (2) may not move beyond the start of intermediate wave (1) below 1,991.68.
At this stage, it looks most likely that intermediate wave (3) has begun. It should be expected to show the subdivisions of minor waves 2 and 4 clearly on the daily chart with one to a few red daily candlesticks or doji. With minor wave 2 now showing as two red candlesticks and one doji, this wave count so far has a typical look. Minor wave 2 may end tomorrow. If it does, it may total a Fibonacci three days.
HOURLY CHART
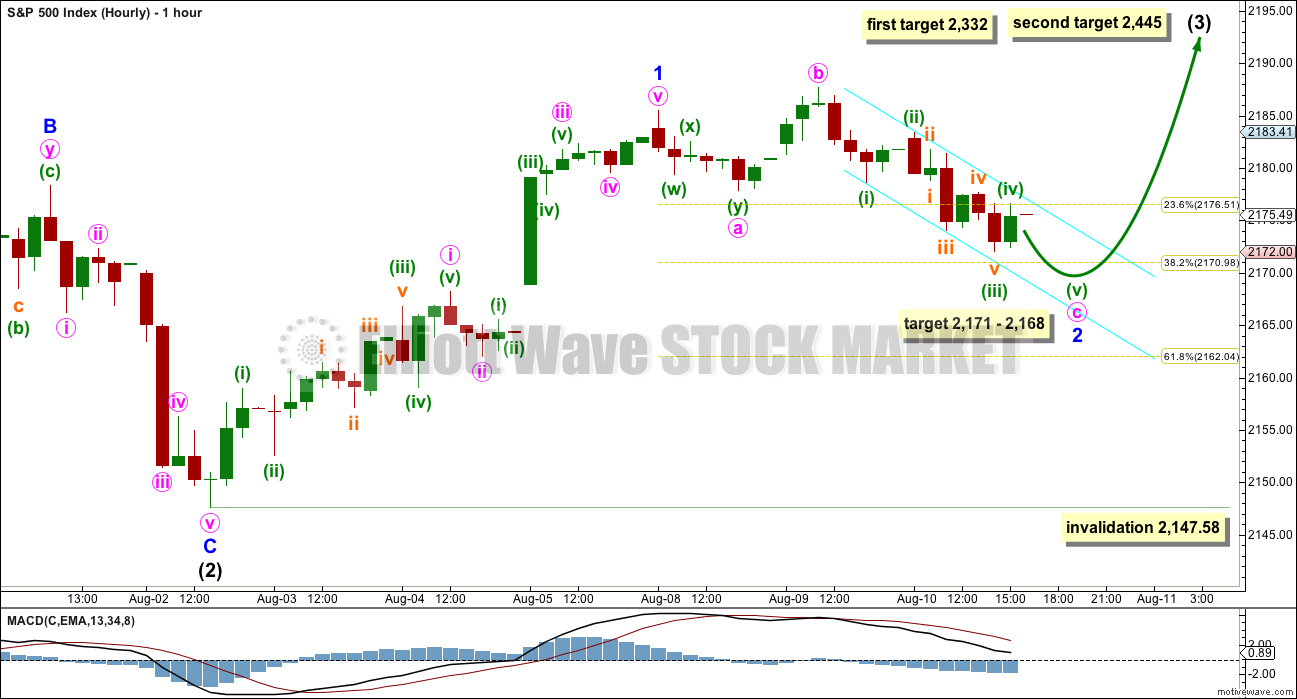
Minor wave 1 now fits as a complete impulse. With downwards movement for Monday’s session showing as a small red daily candlestick, it looks like minor wave 1 was over at Monday’s high.
Ratios within minor wave 1 are: minute wave iii is 0.81 short of equality in length with minute wave i, and minute wave v has no Fibonacci ratio to either of minute waves i or iii.
Minor wave 2 so far fits best as an incomplete expanded flat correction. These are very common structures.
Minute wave a fits as a three, a double zigzag. Minute wave b may have been a sharp single zigzag. So far minute wave c is subdividing as a perfect impulse, with the third wave of minuette wave (iii) within it an extension showing its subdivisions clearly. A final fifth wave down for minuette wave (v) would complete the structure of minute wave c and the whole structure of minor wave 2.
At 2,168 minute wave c would reach 2.618 the length of minute wave a. This is close to the 0.382 Fibonacci ratio of minor wave 1 at 2,171 giving a 3 point target zone. Also, at 2,168 minuette wave (v) would reach equality in length with minuette wave (iii). The lower edge of the target zone is favoured.
A small best fit channel is drawn about minute wave c in cyan. Expanded flats do not fit neatly within channels, so a channel about their C waves may be used to indicate when they are over. If price breaks above the upper edge of this best fit channel with upwards, not sideways movement, that shall be some indication that minor wave 2 may be over and minor wave 3 upwards may have begun.
The next wave up for the S&P is expected to be a third wave at three degrees for this wave count, so an increase in upwards momentum and support from volume would be expected.
At 2,332 intermediate wave (3) would reach equality in length with intermediate wave (1). This is a reasonable Fibonacci ratio to use for the target because intermediate wave (2) would be very shallow at only 0.15 of intermediate wave (1).
At 2,445 intermediate wave (3) would reach 1.618 the length of intermediate wave (1).
Intermediate wave (3) may only subdivide as an impulse. Minor wave 1 would still be incomplete within intermediate wave (3). Minor wave 2 may not move beyond the start of minor wave 1 below 2,147.58.
ALTERNATE WAVE COUNT
WEEKLY CHART
This alternate may again diverge from the main wave count, so it will again be published.
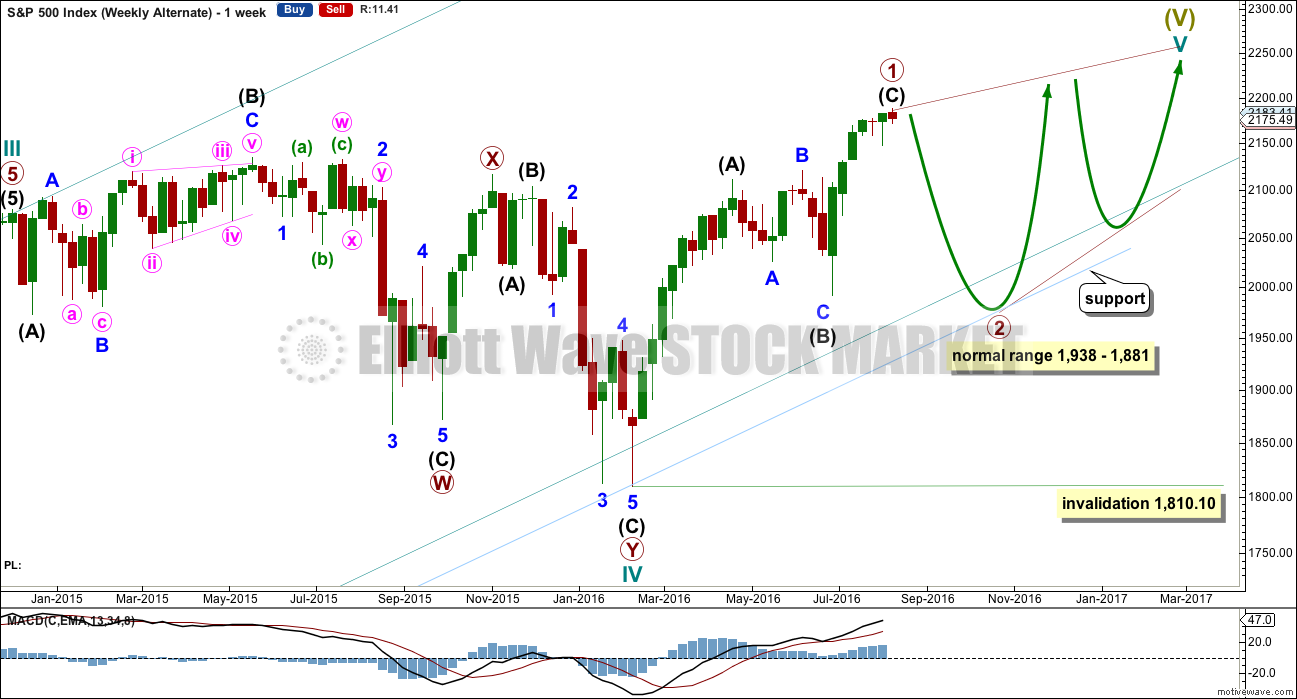
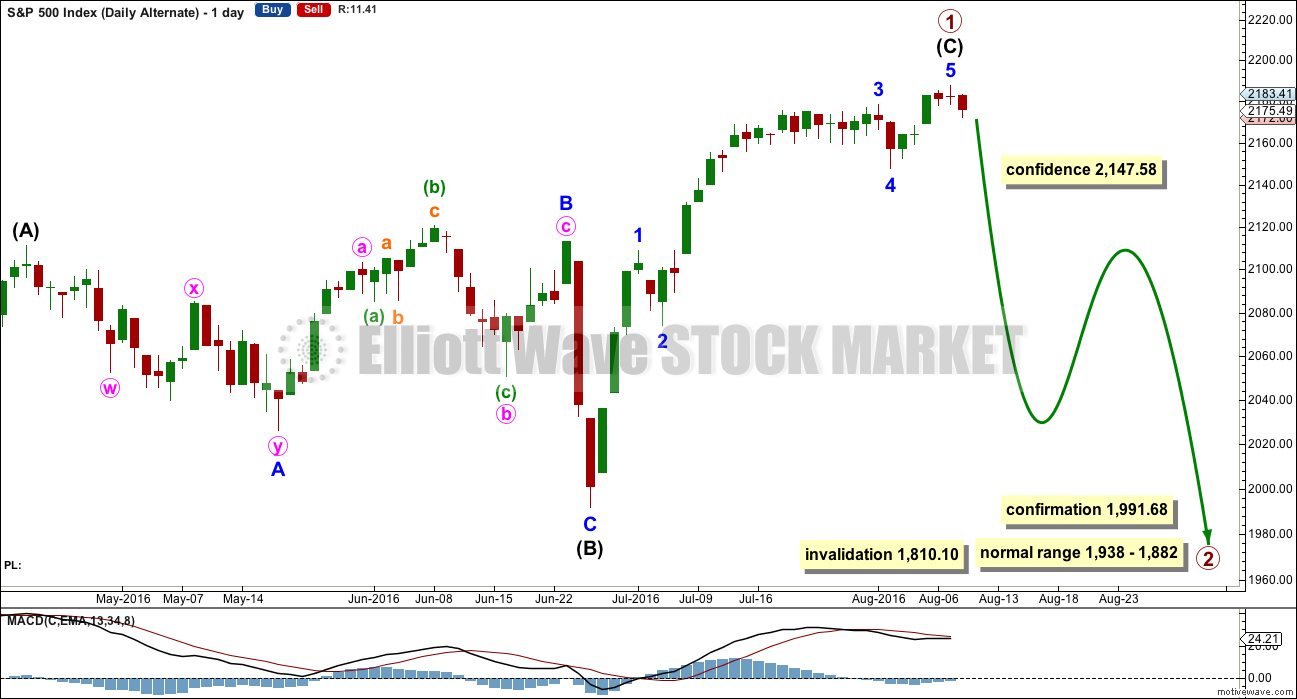
The other structural possibility for cycle wave V is an ending diagonal. Ending diagonals are more often contracting than expanding, so that is what this alternate will expect.
Ending diagonals require all sub-waves to subdivide as zigzags. Zigzags subdivide 5-3-5. Thus primary wave 1 may now be a complete (or almost complete) zigzag, labelled intermediate waves (A)-(B)-(C) which subdivides 5-3-5.
The normal depth for second and fourth waves of diagonals is from 0.66 to 0.81 the prior actionary wave. Primary wave 2 may end within this range, from 1,938 to 1,881.
Primary wave 2 may not move beyond the start of primary wave 1 below 1,810.10.
When primary wave 2 is a complete zigzag, then another zigzag upwards for primary wave 3 must make a new high above the end of primary wave 1. It would most likely be shorter than primary wave 1 as diagonals are more commonly contracting. If primary wave 3 is longer than primary wave 1, then an expanding diagonal would be indicated.
The psychology of diagonals is quite different to impulses. Diagonals contain corrective characteristics and subdivide as a series of zigzags. When diagonals turn up in fifth wave positions, they take on some of the properties of the correction which inevitably follows them. The deterioration in fundamentals and underlying technicals is more extreme and more evident. There is some support for this idea at this time.
The final target of 2,500 would not be able to be reached by an ending contracting diagonal. The final target for this alternate would be calculated only when primary wave 4 is complete.
The classic pattern equivalent is a rising wedge.
DAILY CHART
It is possible now that intermediate wave (C) is a complete five wave impulse. However, this wave count suffers from disproportion between minor waves 2 and 4 which gives this possible impulse an odd look. It looks like a three where it should look like a five. However, the S&P just does not always have waves which look right at all time frames.
Because this wave count expects to see a substantial trend change here from bull to bear for a multi week deep pullback, it absolutely requires some indication from price before confidence may be had in it. A new low below 2,147.58 this week would add confidence.
At this stage, there is not enough selling pressure to support this wave count. When the market has fallen recently, it has fallen of its own weight. For a deep pullback sellers would have to enter the market and be active enough to push price lower. That is not happening at this time.
TECHNICAL ANALYSIS
WEEKLY CHART
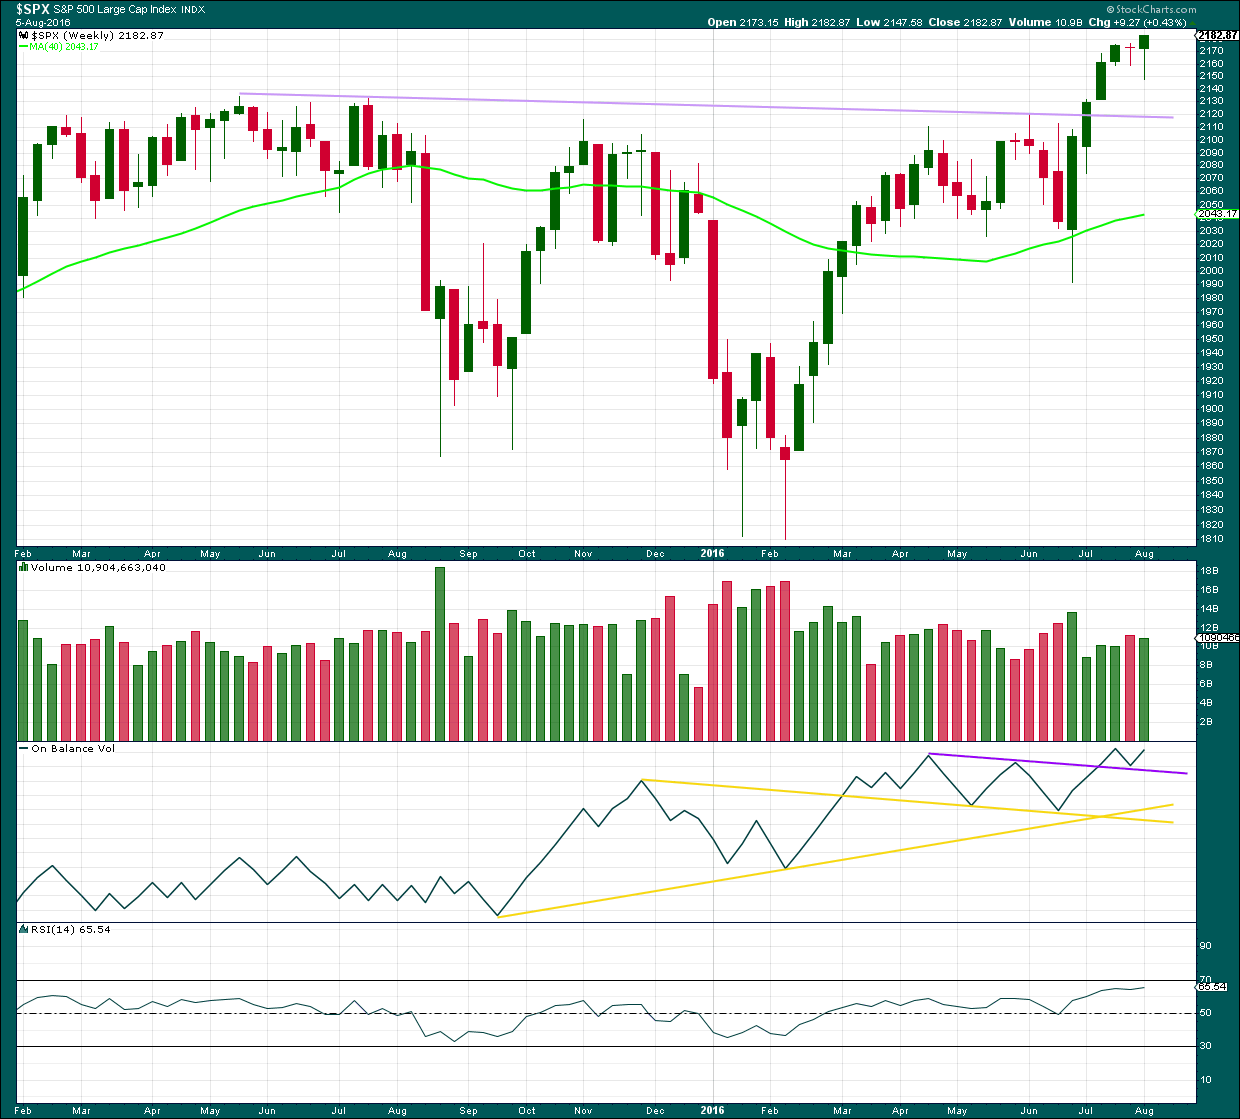
Click chart to enlarge. Chart courtesy of StockCharts.com.
The bearish implications of the stalled candlestick pattern should now be fulfilled with two weeks of a small consolidation.
Last week ended with a new high at the close. The weekly candlestick is a hanging man, but due to the bullish implications of the long lower wick and the green real body this requires confirmation with a downwards week before the bearish implications can be considered seriously.
At this stage, any deeper pullback should find strong support at the lilac trend line. Support at this line should stop any pullback from being very deep.
Last week the bulls were dominant. They rallied to push price out of a consolidation and managed to hold price above prior resistance to close above on Friday. The long lower wick of this weekly candlestick is bullish.
The weekly candlestick comes with slightly lighter volume than last downwards week. The rise in price was not well supported by volume. But that has been a common pattern in recent months, so perhaps not too much bearishness should be read in to this here.
On Balance Volume is still bullish as it remains above the purple trend line.
RSI is not yet overbought. There is room yet for a further rise in price.
DAILY CHART
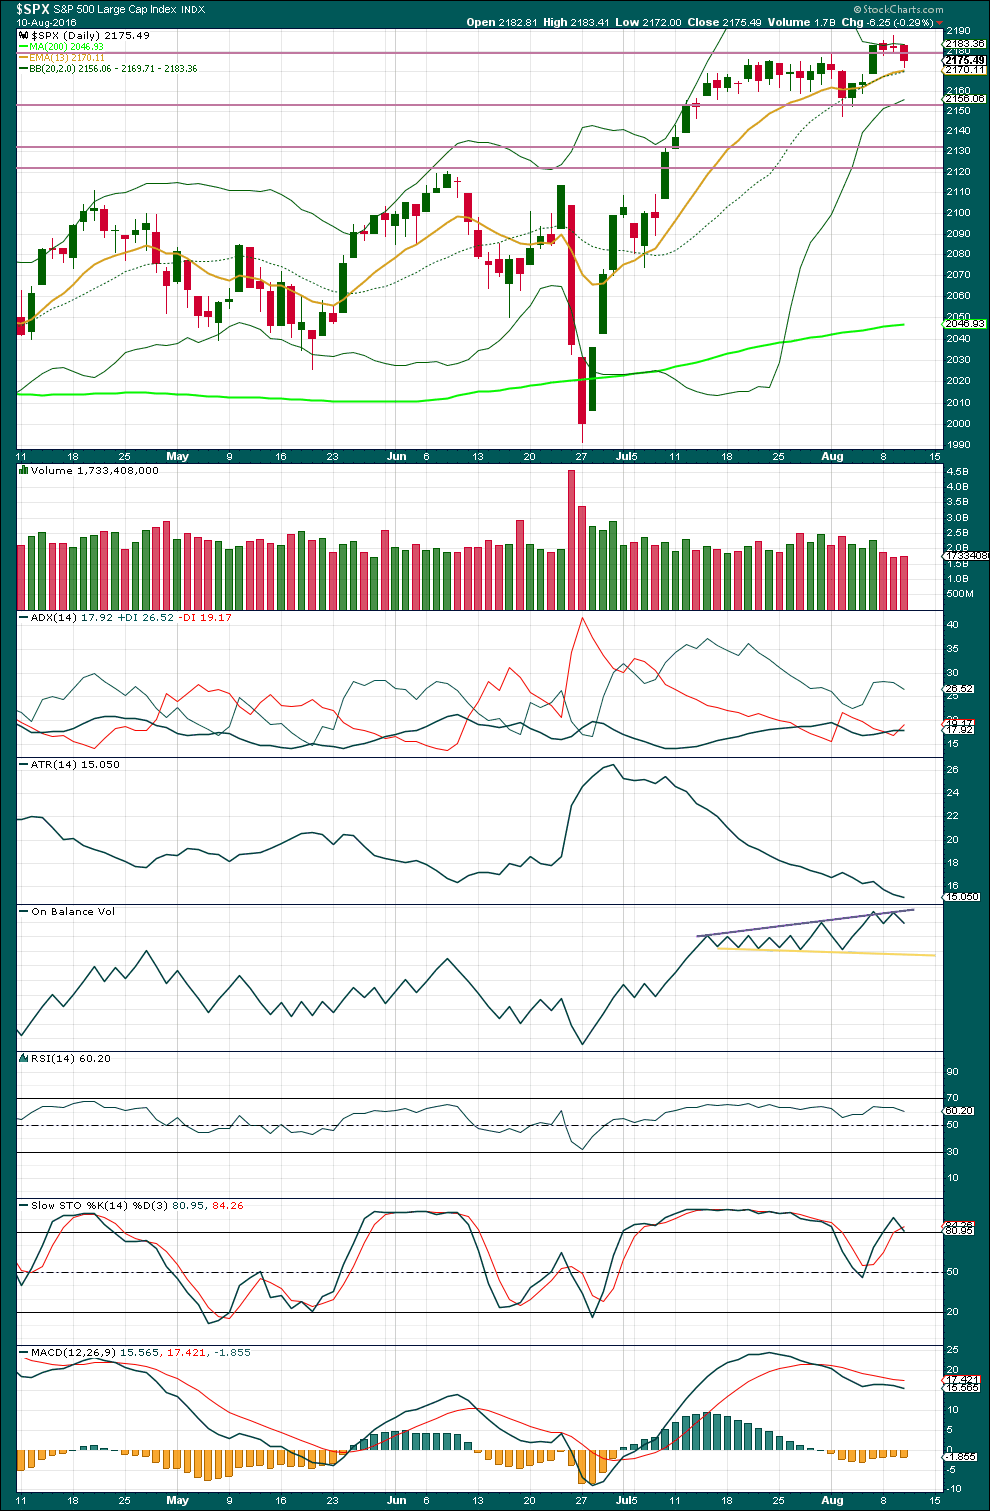
Click chart to enlarge. Chart courtesy of StockCharts.com.
Price has moved lower and closed back within the prior consolidation. The upwards breakout may have been false or may only have been premature.
ADX has declined slightly further today indicating the market is still consolidating. ATR agrees as it too is declining. Bollinger Bands are severely contracting. This consolidation looks to be very mature.
A break above 2,188 on a day with increased volume would indicate an upwards breakout. A break below 2,148 would indicate a downwards breakout, preferably with support from volume for confidence.
During this consolidation, it is a downwards day of 27th of July that has strongest volume indicating a downwards breakout may be more likely than upwards. However, this trick with volume has recently proven to be unreliable for the S&P at the monthly time frame and may also prove unreliable here. It is a weak indication to take note of, but it will not be given too much weight.
The last three upwards days still have stronger volume than the last three downwards days. In the short term, the volume profile looks more bullish than bearish. Today, another red daily candlestick comes with slightly increased volume; the fall in price today had a little support from volume. This supports the Elliott wave count at the hourly chart level. There may yet be a little more downwards movement.
During the longer term upwards trend from the low on 27th of June, price is finding support about the 13 day moving average and the mid line of the Bollinger Bands. With both of these aligned now, this may offer reasonable support.
Trend lines on On Balance Volume are redrawn today. A break above the grey line would be bullish. A break below the yellow line would be bearish.
RSI is not extreme. There is room for price to rise or fall.
Stochastics is returning from overbought. A continuation of a downwards swing may be expected for a range bound approach to this market, to continue until Stochastics reaches oversold and price finds support about 2,150 – 2,145.
Lowry Research shows this rise comes with increasing market breadth. There is not enough selling pressure for price to fall; the consolidation looks like a period of accumulation. With a breakout on slightly higher volume for Friday, this accumulation phase looks to be over and the sideways range was a pause in an upwards trend and not the start of a new downwards trend. With broad agreement between Lowry’s analysis and this analysis presented here, I have more confidence in the upwards trend continuing.
VOLATILITY – INVERTED VIX CHART
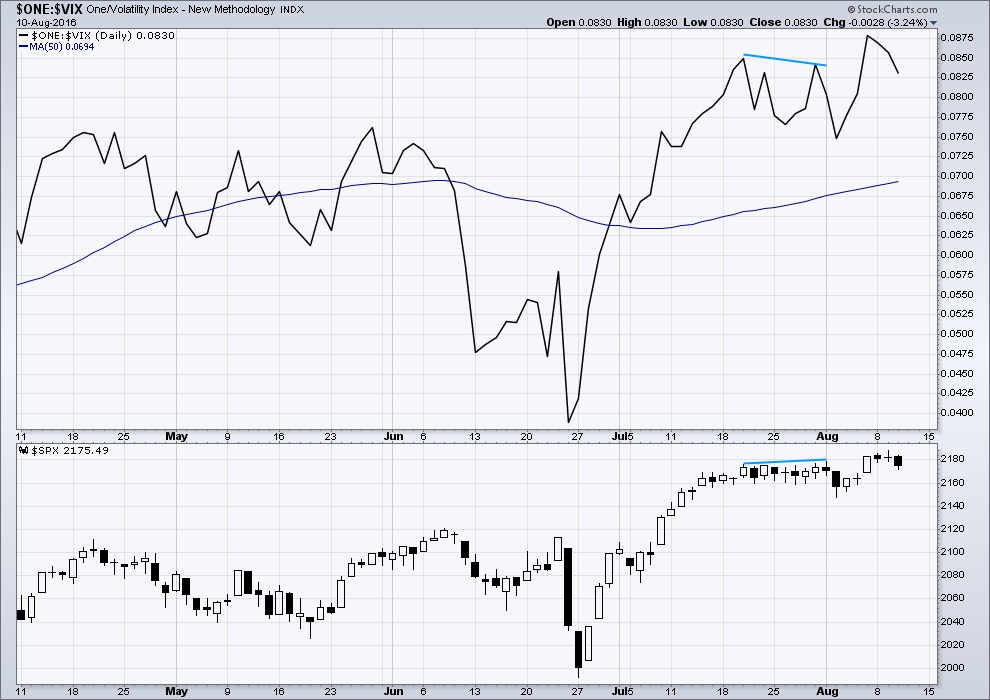
Click chart to enlarge. Chart courtesy of StockCharts.com.
Volatility is declining as price is rising. This is normal for an upwards trend.
There is an example of multi day divergence with price and VIX (blue lines) which did lead to some downwards movement. The downwards movement that resulted from this divergence lasted only for two days, but it did make a new low.
BREADTH – AD LINE
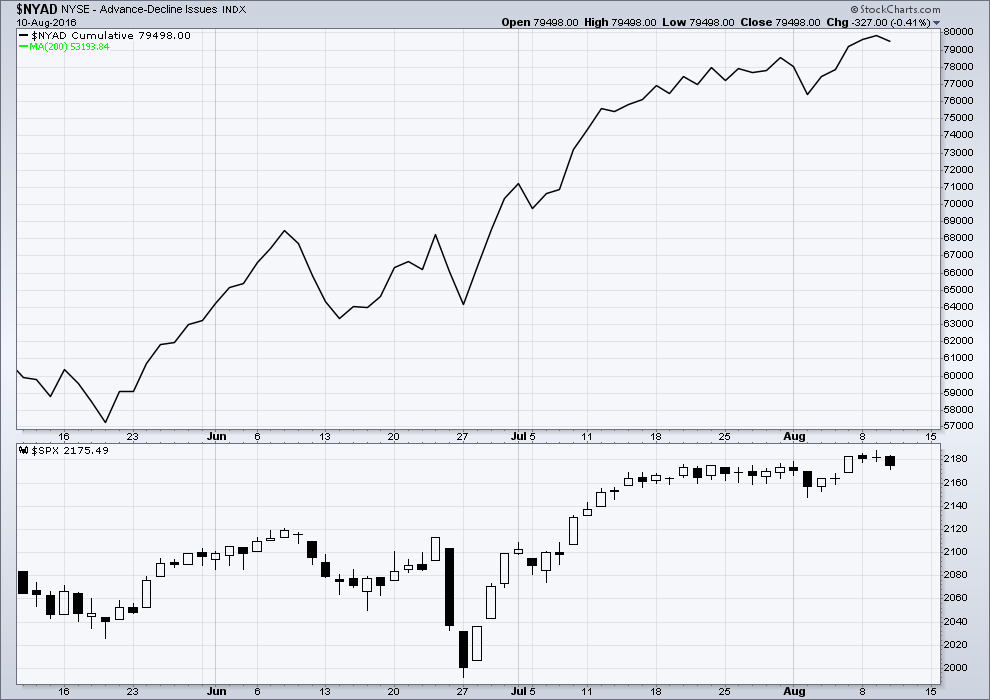
Click chart to enlarge. Chart courtesy of StockCharts.com.
There is support from market breadth as price is rising. The AD line shows no divergence with price; it is making new highs with price.
DOW THEORY
Major lows within the prior bull market:
DJIA: 15,855.12 (15th October, 2014) – closed below on 25th August, 2015.
DJT: 7,700.49 (12th October, 2014) – closed below on 24th August, 2015.
S&P500: 1,821.61 (15th October, 2014) – has not closed below this point yet.
Nasdaq: 4,117.84 (15th October, 2014) – has not closed below this point yet.
Major highs within the new bear market:
DJIA: 17,977.85 (4th November, 2015) – closed above on 18th April, 2016.
DJT: 8,358.20 (20th November, 2015) – has not closed above this point yet.
S&P500: 2,116.48 (3rd Nobember, 2015) – has now closed above this point on 8th June, 2016.
Nasdaq: 5,176.77 (2nd December, 2015) – has now closed above this point on 1st August, 2016.
Dow Theory Conclusion: Original Dow Theory still sees price in a bear market because the transportations have failed to confirm an end to that bear market. Modified Dow Theory (adding S&P and Nasdaq) has failed still to confirm an end to the old bull market, modified Dow Theory sees price still in a bull market.
This analysis is published @ 08:59 p.m. EST.

No volume data from StockCharts yet. But if we see any increase over yesterday then I’d have confidence an upwards breakout is underway.
I’m trying to be flexible here and adjust to market conditions. The fact is this: price has been rising since the low of 27th June, it’s made very important new all time highs. That signal from price cannot be ignored, if we want to make money here.
It’s doing it on light volume. But one thing is working reasonably well: On Balance Volume is working, and watching for small increases from one upwards day to another is working. So these small signals, weak though they may be, are whats working so lets go with that.
Divergence isn’t working, although VIX did warn of the drop on 2nd August, so it may still be working… sometimes. I’ll keep an eye on it.
According to Lowry’s (and I put these guys in the Highly Professional Highly Experienced category) selling pressure is weak. I see this in light and declining volume for downwards days.
It looks like we’ll not be seeing a deep pullback. It looks like price may just drift higher, weakly, but still higher.
This may be one of the weakest third waves in history…. which for the much bigger picture at Super Cycle degree does actually make sense.
We’re here to make money folks. Go with the trend.
And a slight increase in volume for todays upwards day adds a little confidence to the main wave count.
Even if this isn’t a third wave up at three degrees, there is an upwards trend and it looks like the sideways consolidation may now be over. Fairly likely to be anyway.
As always, nothing in technical analysis is certain. This is an exercise in probability. So if members are going long here then it is essential that stops are used.
I’m long now, just under 2% of equity and my stop is just below yesterdays low.
Some very strange things going on in the market and I scalped today’s move up but am now on the sidelines. I am at a complete loss to comprehend the price action in volatility in the middle of what should be a third wave up at several degrees. UVXY has re-traced almost its entire downward move on this strong move up in SPX. It should not be doing that- it should be absolutely tanking and heading for the teens. Does anyone else see a five wave up from the June 27 low? ‘Bye all!
Lara,
I agree with you. Like NZ, big real estate bubbles in China, Hong kong, London, several cities in US, India and on and on. It will pop at some point but my point is simple: if one has money sitting on the sidelines that NEEDS to be invested, the stock market (selective stocks) still is less frothy then buying real estate in those cities or bonds for that matter. I hear some pundits call it TINA (There is No Alternative). And with global QE still happening and expanding and now with infrastructure spending talks in Japan, US and other places, we still have some juice left in the markets. Eventually everything will pop, but as CJ said, it can be a while.
The problem with real estate is it’s not fungible.
I wouldn’t want to be the one caught holding the parcel when the music stops.
Then it’s hard to sell, and easy to make whopping losses.
With the almost vertical slope on Auckland’s real estate figures right now it’s a market I’m studiously avoiding. I don’t mind missing out on the last little spike, I’m waiting for the crash and the market to bottom to buy.
And I’m completely prepared to watch it continue upwards for another year or so…
Now the NZ stock market is a good one. That’s fungible. And that’s doing very well indeed.
I’ve heard some about the real estate bubbles in Australia and Canada too. And of course, here in NZ we’re somewhat focussed in China with it geographically close and NZ having a large Chinese population. But the media in NZ don’t cover that (they do a horrible job of pretty much anything actually with a couple of exceptions).
Looking at this map of China’s property prices, I don’t see that ending well 🙁
I have done a bit of reading on geo-strategic relocation and they talk about the large Chinese presence in NZ. If the folk there are as fiercely loyal and patriotic as they are in the BVI I expect they will be fine. Of course if the Chinese for any reason decided to do a South China Sea in NZ that could be a problem… 🙂
Looking forward to rock bottom prices in Auckland! 🙂
You, me and many thousands of NZers who are sick of renting and living in cars 🙁
We had that problem on St John in the American Virgin Islands when families who had lived on the island for generations found themselves unable to keep up with real estate taxes as off island buyers bid property prices through the roof. They finally settled on differing rates for indigenous folk and grand-fathered them into a kind of tax exempt status so the could keep their homes. Although there are some spectacular properties on my own Island of Tortola for some reason real estate taxes there have remained laughably low. People pay only a few hundred dollars per year for multi-million dollar properties.
Hey… there’s surf there Verne! Looks quite good too!
no worries Vern — also scaled some longs and added ES puts for Sept
Vern,
Just added VIXY as a hedge to the longs
VIXY will not hedge your long as it is an inverse VIX ETF. If you want to hedge your long position using volatility VXX is better or UVXY.
Oops! My mistake Sunny. I was thinking you SVXY…
New high in SPX confirms DJI.
As far as tops etc. I let you all have fun with that. I will simply follow Lara’s insights and follow the trend until broken. Sure a correction can come at some point. But 2500 S&P target looks good. This is one of the most hated rallies I have seen in 20 years. Strange times.
VO,
Real estate is one thing that is selling like hot cakes everywhere. Commercial, residential, multi family etc. On another note; if stock market is over valued, what do we say for global real estate where rents yield less than S&P dividends. Something to ponder…
I don’t see it. In every town in the US, there’s at least 1 if not 2 malls that are struggling or hanging on by the skin of their teeth. Real Estate may be up off the bottom from 2011/2012, but hardly where it was back in ’06.
We are about to have a credit collapse of unimaginable proportions. This is going to effect all assets……everything. No one has money to spend…evident in our current velocity of money. This is why retail sales is falling, this is why cars and homes sales are looking more like a top here.
Joseph is 100% correct IMO, we are at the beginning of the big D.
We have a massive real estate bubble in NZ. Hugely inflated.
A chart of Auckland average prices has a steep, almost vertical slope at the end.
That bubble’s gotta pop…
The big problem with bubbles though I am learning with slow moving markets like real estate, is it is insanely difficult to predict their end. Impossible I think.
You can only tell the bubble has popped a little after the fact I think.
Vern,
Even though I now do 40% or more of my shopping on Amazon, Macys is still interesting. At least the real estate portfolio they own. At some point the brick and mortar players will have to consolidate, sell some real estate or lease it. Which brings me to an interesting place — Amazon. And online retail sales which will continue to increase and within 15 – 20 year be 50% of ALL retail sales. Amazing —
Only if you can sell that real estate. With ‘everyone’s’ retail sails numbers down from a brick and mortar standpoint, what can they really get for their property?
I can’t help but feel like we are closer to a significant top. I’ve been fishing for a short trade. Several times I’ve been stopped out, other times I made small profits, but one day (real soon IMHO) the big one is coming….soon.
I’ve been fishing for a short trade going on three years now.
It’s been painful and there is no reason why it can’t be painful for another three years.
Real estate where I’m at is hot. As far as your retail sales outlook, I think you are basically ignoring online sales.
I should have pulled out when Lara warned of 2134 weeks ago. I got out of my shorts later than I should have but have been rewarded going long as I’ve held my nose and erased a lot of those losses.
Nicely done.
Yes, the psychology of switching from bear to bull is a lot harder than I expected.
Psychology… it’s the most important aspect and most difficult I think to trading. It’s one thing to analyse a market, and quite a different exercise to put that analysis into practice and trade a market.
A few strange things about this ramp higher folks. Not only is the volume problematic, why is VIX not confirming with new lows??!!! Something’s just a bit fishy….non-confirmation of new DJI high by SPX does not help so let’s see if that changes soon…
DJI today made a new ATH.
DJT still is way down below it’s ATH back in November 2014. It’s lagging.
So we have non confirmation from DJT that a bull market is back.
However, that does not and so far has not stopped the S&P from continually making new highs.
Clearly an impulse up off yesterday’s lows. A three wave move down with a higher high today makes it hard to argue with the third wave up scenario. The low volume is something I guess we should be accustomed to as it has been that way for years…
Interesting that so far SPX not confirming DJI new ATH; I expect it will shortly…
momo is slowing down with each leg up. There’s a pretty large seller here too. High likely hood they fade this rally into the close IMHO…. especially if Dudley doesn’t get a re-fresh from Yellen with some more fiat! LOL!!!
Breakout appears to be upwards. Volume a huge problem. The retail euphoria is indeed bogus. Both Macy and Kohl’s are short candidates imho.
Anyone have thoughts on the chance they can cook tomorrow’s retail sales number?
Retail sales numbers should be horrible with the recent GDP numbers.
Year over Year (6 month period) Macy’s Sales are down (5.7%) and GAAP EPS down almost 50%.
So any Good Retail Sales number is exactly what you say… They cooked “tomorrow’s retail sales number”
If the moron market believes the cooked good numbers then it just proves the Market is a Dumb F _ _ K!
Recent down channel has been broken to upside before a final drop suggesting it was a 3 wave corrective pattern. If you relabel main hourly with minor wave 1 ending at 2187.9, and minute 4 of minor 1 an expanding flat ending at as is currently labelled minute a, then minor 2 correction could be over. would look to buy over 2188.
Again no clear indication from futures whether we get a break-out or a break-down.
I have been getting stopped out of trades with such regularity trying to trade SPX that I am doing nothing more than providing regular income for my brokers – it is hardly worth the effort. It is starting to look like the volatility signal was indeed a head-fake as downward move lasted less than one day. I will therefore be SOH until either futures or intra-day action demonstrate conclusively where we are headed…namely a break of 2160 on high volume or conversely, 2187 on high volume. As one savvy trader once admonished me, never chase the market…let it come to you…have a great trading day everybody! 🙂
first (all lower case).
oh no!!!!!
All good things must come to end Jules. Long live the new king, CJ!
YES… All good things must come to end (Bull Run within Bear Market)!
Let the REAL cleansing begin and occur (Painful Deep Long Cleansing) so that a real new long-term renewal can begin! One way or another the cleansing will occur! You can’t change the course of nature!
TICK…TICK…TICK… POP!