Upwards movement was expected but did not happen.
Price remains just above the invalidation point on the hourly wave count.
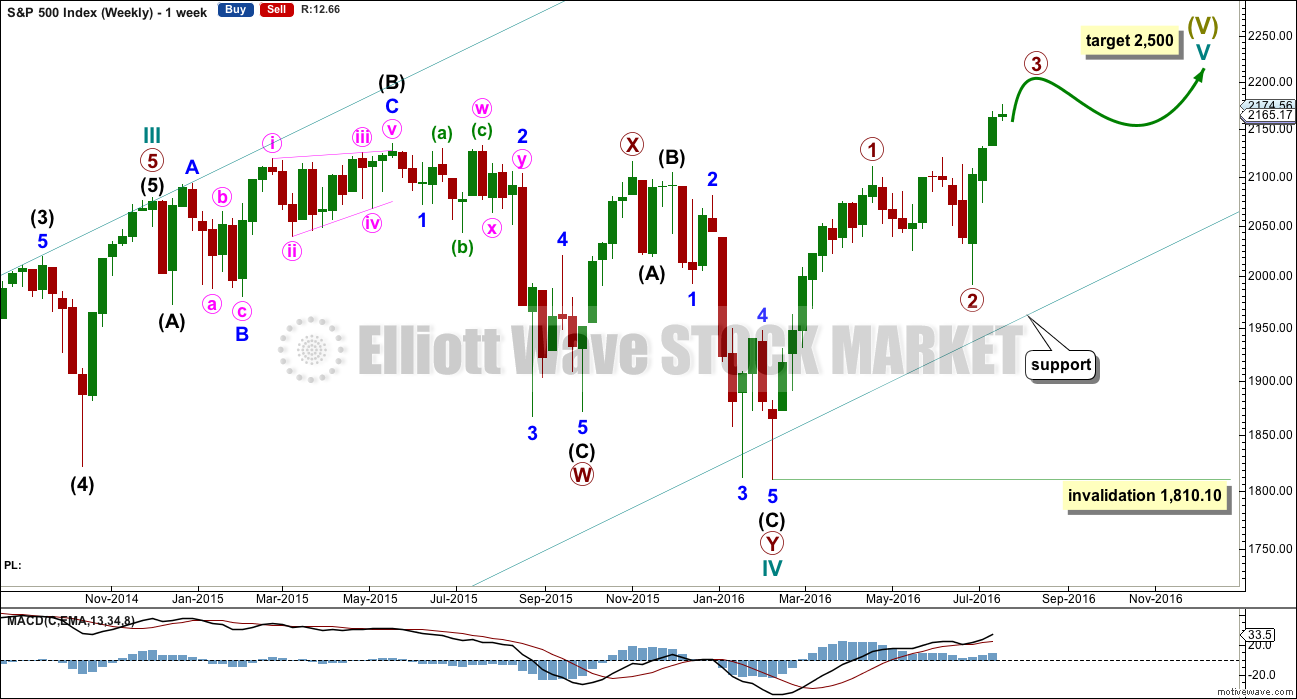
Summary: Sideways movement for another three sessions may complete a fourth wave. This will be the preferred outlook while price remains above 2,155.79. A break below 2,155.79 would indicate a deeper pullback may have arrived. Any pullback here is very likely to remain above 2,111.05.
Last monthly chart for the main wave count is here.
New updates to this analysis are in bold.
WEEKLY CHART
Cycle wave II was a shallow 0.41 zigzag lasting three months. Cycle wave IV is now seen as a more shallow 0.28 double combination lasting 14 months. With cycle wave IV nearly five times the duration of cycle wave II, it should be over there.
After some consideration I will place the final invalidation point for this bull wave count at 1,810.10. A new low below that point at this time would be a very strong indication of a trend change at Super Cycle degree, from bull to bear. This is because were cycle wave IV to continue further sideways it would be grossly disproportionate to cycle wave I and would end substantially outside of the wide teal channel copied over here from the monthly chart.
Cycle wave I lasted 28 months (not a Fibonacci number), cycle wave II lasted a Fibonacci 3 months, cycle wave III lasted 38 months (not a Fibonacci number), and cycle wave IV lasted 14 months (one more than a Fibonacci 13).
If the target for cycle wave V is for it to be equal in length with cycle wave I, then it may also be expected to be about equal in duration. So far cycle wave V is in its fifth month. After this month, a further 23 months to total 28 seems a reasonable expectation, or possibly a further 16 months to total a Fibonacci 21.
Wave count I should be preferred while price remains above 2,074.02. If price moves below 2,074.02, then wave count II would be confirmed.
DAILY CHART I
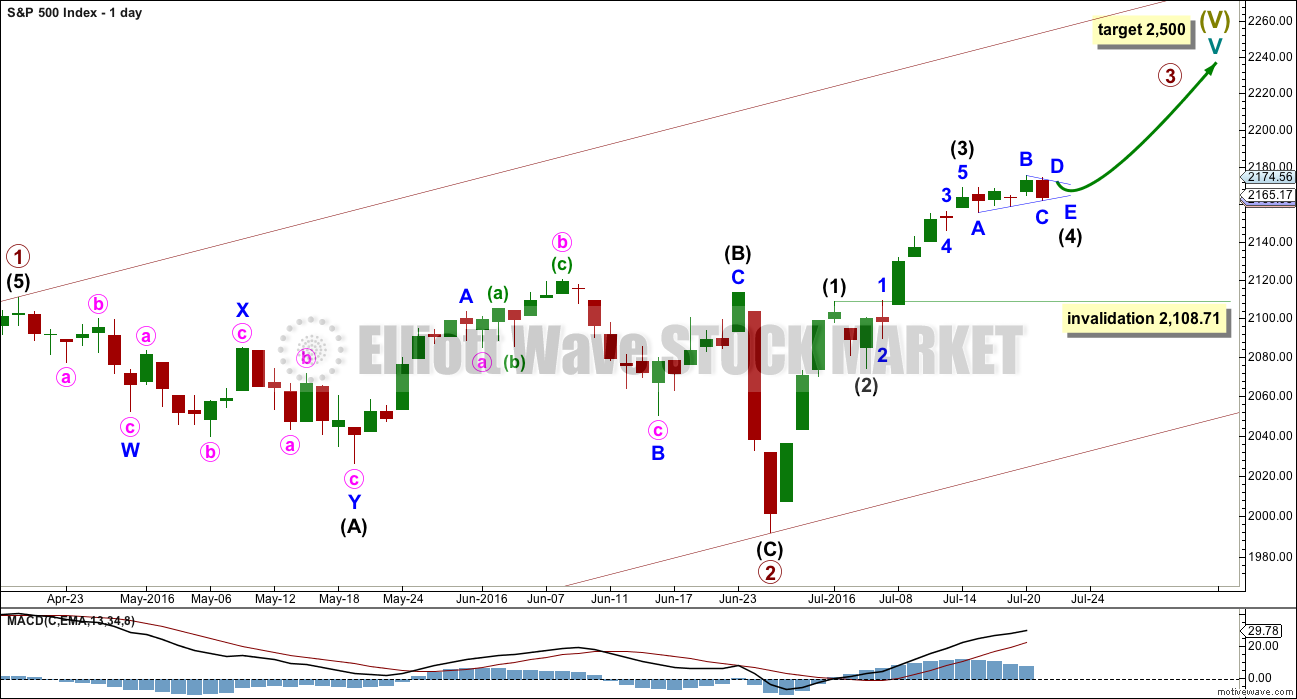
It is still most likely that primary wave 2 is already complete as a shallow regular flat correction. Primary wave 3 is most likely underway.
At this stage, within primary wave 3, it now looks like intermediate wave (3) may be over and intermediate wave (4) may be moving sideways, so far subdividing as a running contracting triangle. If intermediate wave (3) is over, then it was shorter than intermediate wave (1), and there is no Fibonacci ratio between the two waves. This limits intermediate wave (5) to no longer than equality in length with intermediate wave (3).
A target for primary wave 3 to end may not be calculated at this time. When intermediate wave (4) is complete, then a target will again be calculated for primary wave 3 to end.
Because the limit to the length of intermediate wave (5) places a limit on how high primary wave 3 can go, the final target for cycle wave V to end now looks to be too high. When primary waves 3 and 4 are complete then the final target for primary wave 5 can be calculated at primary degree. At that stage, the target at 2,500 will probably change and it will probably be lower, if this wave count at that stage is still correct.
When primary wave 3 is complete, then the following correction for primary wave 4 may not move back down into primary wave 1 price territory below 2,111.05.
Intermediate wave (4) may not move into intermediate wave (1) price territory below 2,108.71.
Intermediate wave (1) lasted four days, intermediate wave (2) was a quick zigzag over in just two days, and intermediate wave (3) may have been over in six days. Intermediate wave (4) has so far lasted five days. If it continues for another three, it may total a Fibonacci eight.
HOURLY CHART I
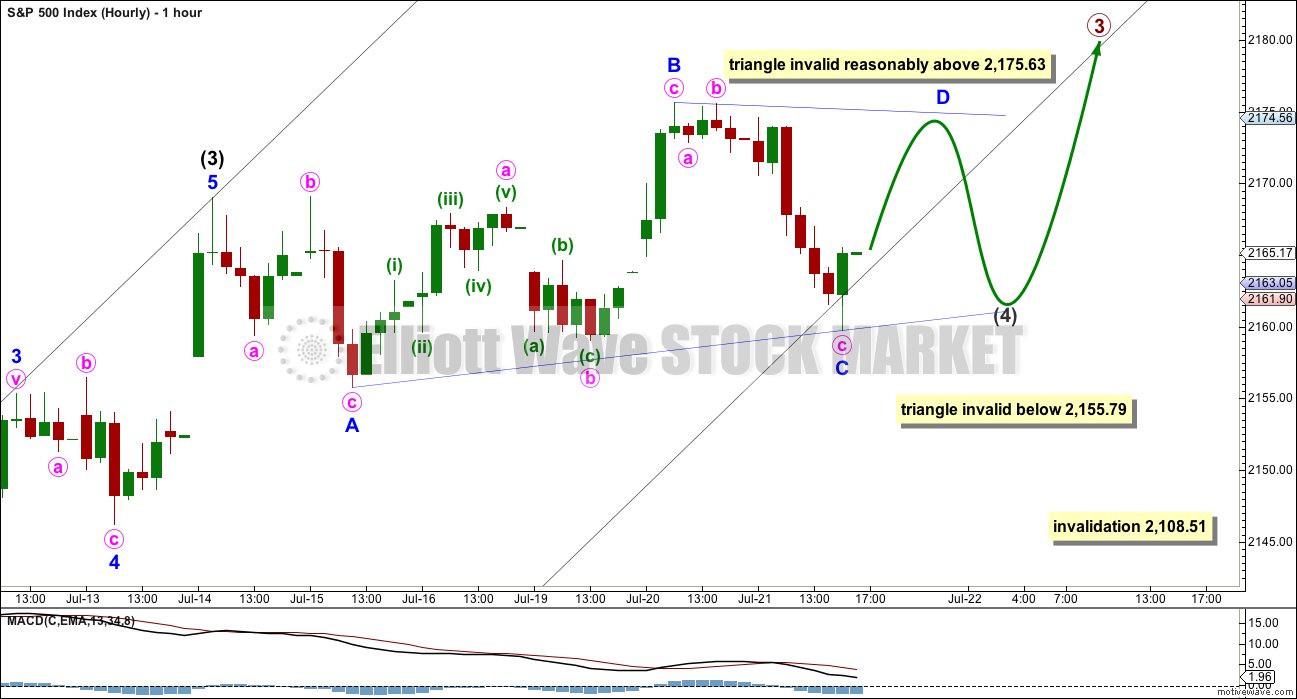
Intermediate wave (4) may be a running contracting (or barrier) triangle as labelled, or it may yet morph into a double flat or double combination. The triangle labelled will remain valid as long as price remains above 2,155.79; minor wave C may not move beyond the end of minor wave A.
If price moves below 2,155.79, then intermediate wave (4) would be relabelled as a multiple: a double flat or double combination.
If a triangle is unfolding as labelled, then minor wave C would most likely be over here so that the A-C trend line has an upwards slope. If minor wave C moves any lower when markets open tomorrow, then the probability of a triangle would decrease.
Minor wave D of a contracting triangle may not move above the end of minor wave B at 2,175.63. Minor wave D of a barrier triangle may end about the same level as minor wave B at 2,175.63, as long as the B-D trend line remains essentially flat. In practice this means minor wave D may end slightly above 2,175.63. This is the only Elliott wave rule which is not black and white.
When minor wave D is complete, then a zigzag down for minor wave E may complete the triangle. Minor wave E would most likely fall short of the A-C trend line. Minor wave E may not move below the end of minor wave D.
If sideways movement unfolds as this labelling expects, then it would be a fourth wave and would confirm labelling the end of intermediate wave (3). The implications are important. This would limit the length of primary wave 3 and make the final target at 2,500 too high.
Intermediate wave (4) may not move into intermediate wave (1) price territory below 2,108.51. This wave count remains valid while price remains above this point.
HOURLY CHART I – ALTERNATE
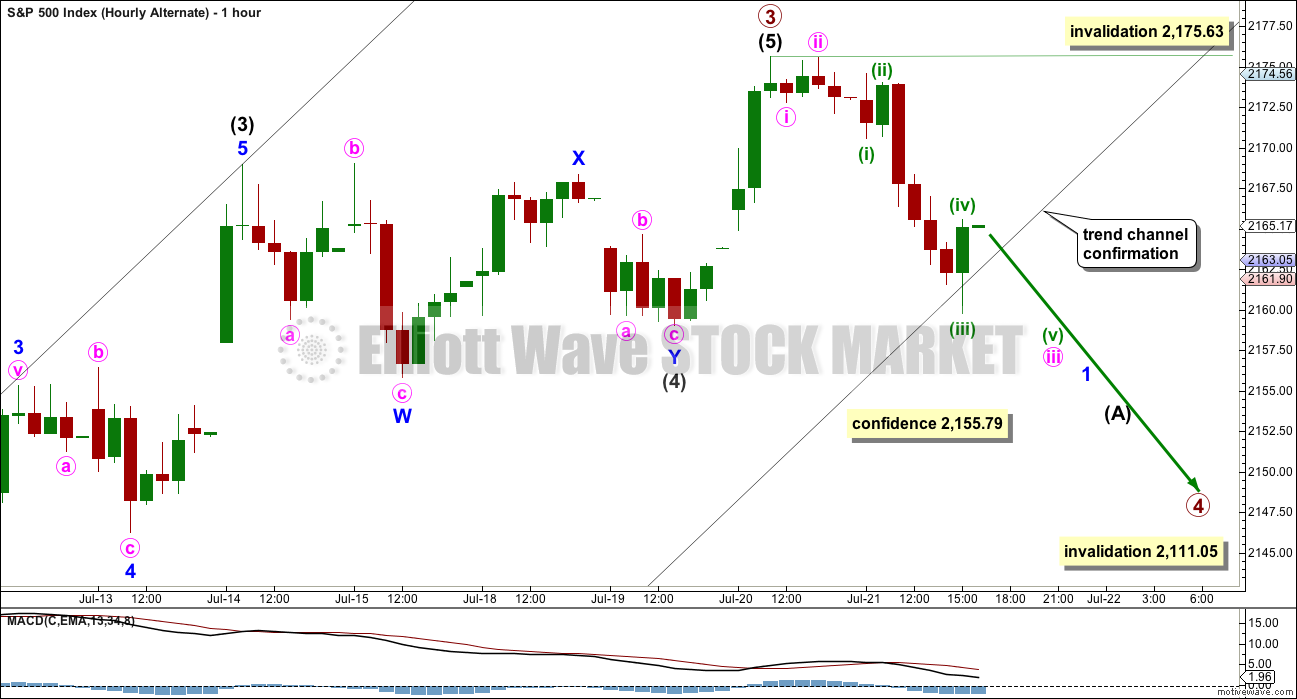
It is still also possible that the correction underway is one degree higher. It is possible that primary wave 3 was over at the last high and primary wave 4 begins there.
Primary wave 2 was a shallow 0.40 expanded flat correction. Given the guideline of alternation, primary wave 4 may be expected to most likely be a more shallow single or multiple zigzag. It must be more shallow in order to remain above primary wave 1 price territory at 2,111.05. The 0.236 Fibonacci ratio would be a reasonable target at 2,132. This would also see price find support about the last all time high at 2,135, which seems reasonable.
Within the first wave down at intermediate wave degree, a clear five should develop on the hourly chart for a wave at primary degree. So far that looks incomplete.
When a five down is complete, then the following correction, a three up, may not move beyond the start of the first five down above 2,175.63.
DAILY CHART II
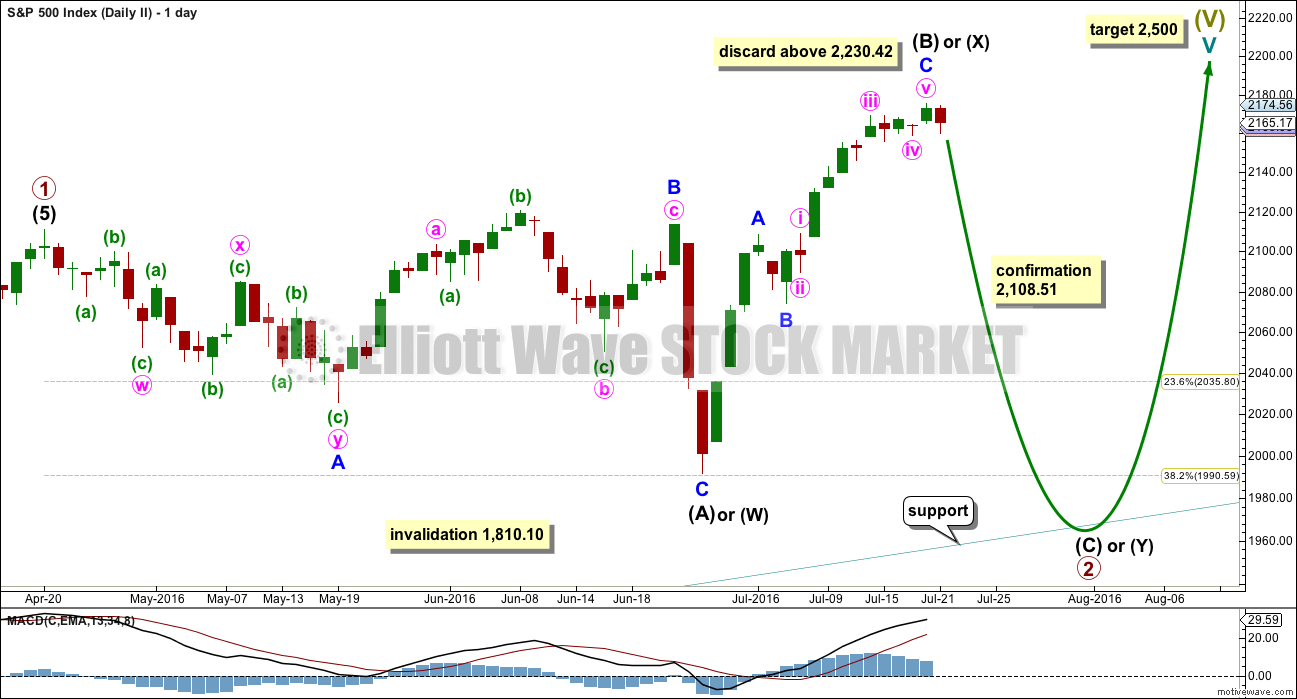
This wave count is possible but it requires some confirmation before confidence can be had in it.
The common length for intermediate wave (B) is from 1 to 1.38 the length of intermediate wave (A), giving a range from 2,111.05 to 2,156.41. Intermediate wave (B) is now 1.54 the length of intermediate wave (A), longer than the common range but not yet at the maximum convention of 2.
The idea of a flat correction should be discarded when intermediate wave (B) exceeds twice the length of intermediate wave (A) above 2,230.42.
When intermediate wave (B) is complete, then intermediate wave (C) downwards would most likely end at least slightly below the end of intermediate wave (A) at 1,991.68 to avoid a truncation and a very rare running flat. It may end when price comes down to touch the lower edge of the channel copied over from the monthly chart.
Primary wave 2 may also be relabelled as a combination. The first structure in a double combination may be a complete regular flat labelled intermediate wave (W). The double would be joined by an almost complete zigzag in the opposite direction labelled intermediate wave (X). The second structure in the double may be a flat (for a double flat) or a zigzag to complete a double combination. It would be expected to end about the same level as the first structure in the double at 1,991.68, so that the whole structure moves sideways.
An expanded flat for primary wave 2 is more likely than a double combination because these are more common structures for second waves.
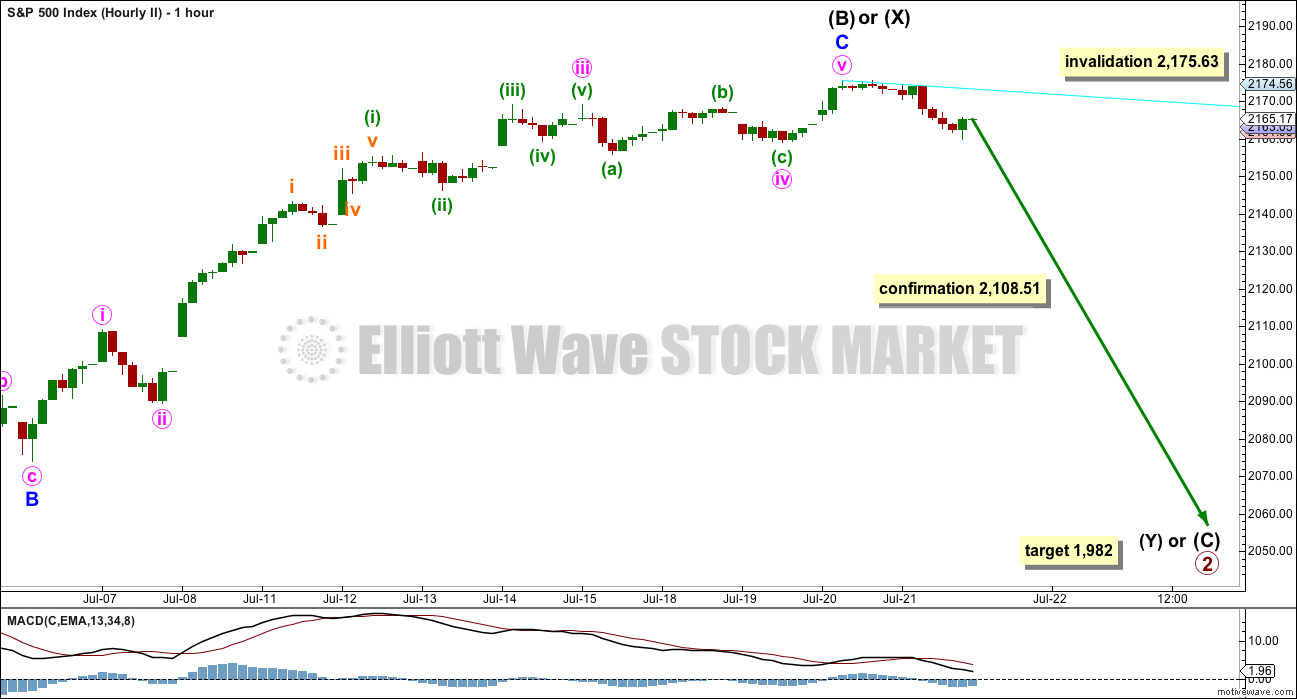
HOURLY CHART II
This wave count requires some confirmation from price with a new low below 2,108.51.
At 1,982 intermediate wave (C) would reach 1.618 the length of intermediate wave (A).
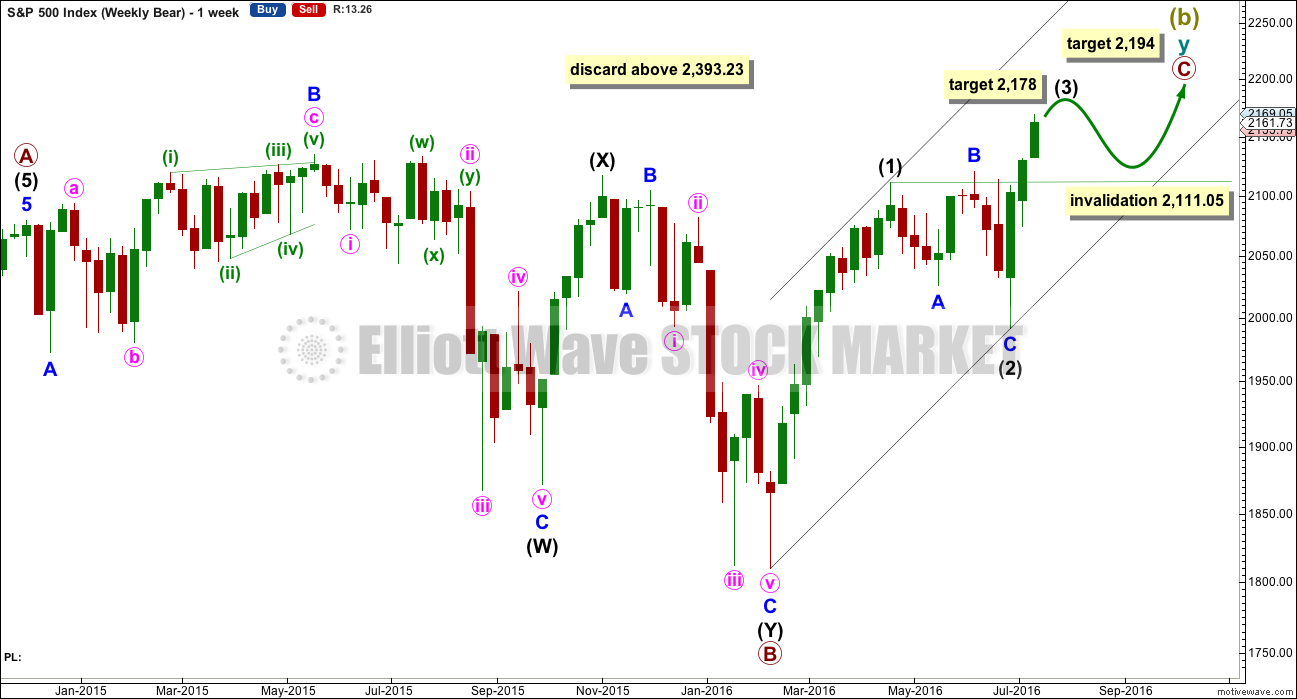
BEAR WAVE COUNT – WEEKLY CHART
It would still be possible that a Super Cycle trend change is close if Super Cycle wave (b) (or (x) ) is subdividing as a double zigzag.
However, the expected direction and structure is now the same short and mid term for this idea as it is for the main wave count.
Within the second zigzag of cycle wave y, primary wave C must complete as a five wave structure.
So far Super Cycle wave (b) is 1.72 the length of Super Cycle wave (a). This is comfortably longer than the normal range which is up to 1.38, but still within the allowable convention of up to 2 times the length of wave A.
Above 2,393.23 Super Cycle wave (b) would be more than twice the length of Super Cycle wave (a). Above this price point the convention states that the probability of a flat correction unfolding is too low for reasonable consideration. Above that point this bear wave count should be discarded. The same principle is applied to the idea of a double combination for Grand Super Cycle wave II
A five wave structure upwards would still need to complete for primary wave C. So far upwards movement is a very strong three wave looking structure. Trying to see this as either a complete or almost complete five would be trying to fit in what one may want to see to the waves, ignoring what is actually there.
At 2,178 intermediate wave (3) would reach 0.618 the length of intermediate wave (1).
Thereafter, intermediate wave (4) may move sideways for a few weeks as a very shallow correction. Thereafter, intermediate wave (5) would most likely make a new high. At 2,194 primary wave C would reach 0.382 the length of primary wave A. This final target is close to the round number of 2,200 and so offers a reasonable probability.
If price reaches 2,200 or close to it, then this idea would again be assessed, and an attempt made to determine its probability. The situation between now and then though may change.
The important conclusion is more upwards movement is extremely likely, as a five up is needed to complete.
TECHNICAL ANALYSIS
WEEKLY CHART
Click chart to enlarge. Chart courtesy of StockCharts.com.
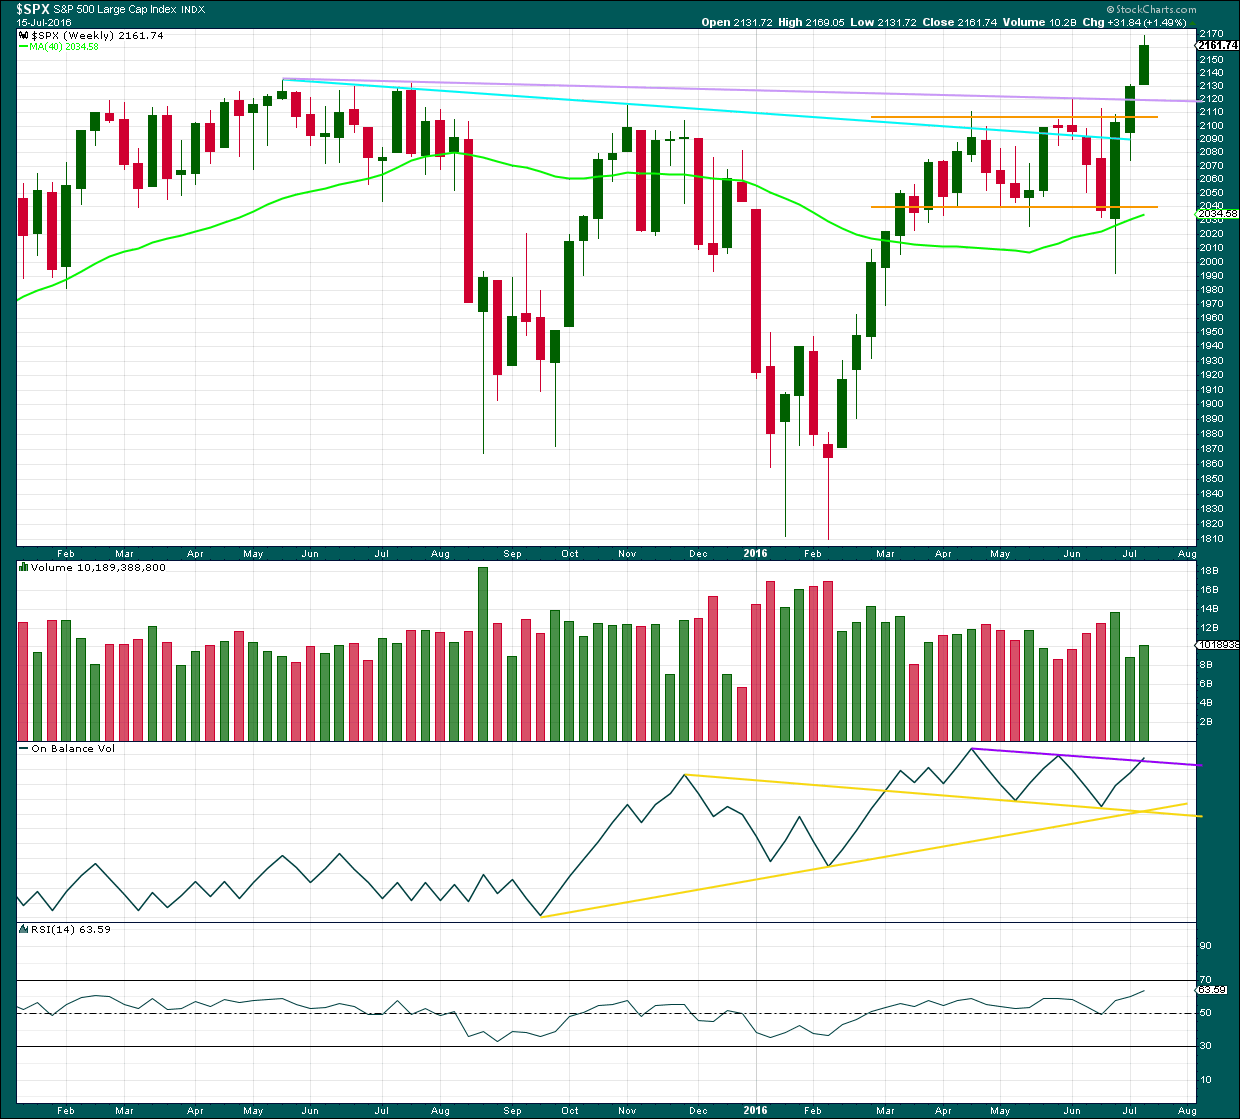
At the end of last week, price has very clearly broken out of the prior consolidation upwards. This applies not only to the small consolidation on the weekly chart shown by yellow support and resistance lines, but also to the larger multi month consolidation that was shown in prior weekly charts and which had the upper resistance line at the prior all time high of 2,134.
Volume last week is higher than the week prior. There is some support from volume for the rise in price although the first upwards week still has strongest volume.
From the last swing low, there is now a bullish engulfing candlestick pattern followed by three advancing white soldiers pattern. Both patterns are bullish.
DAILY CHART
Click chart to enlarge. Chart courtesy of StockCharts.com.
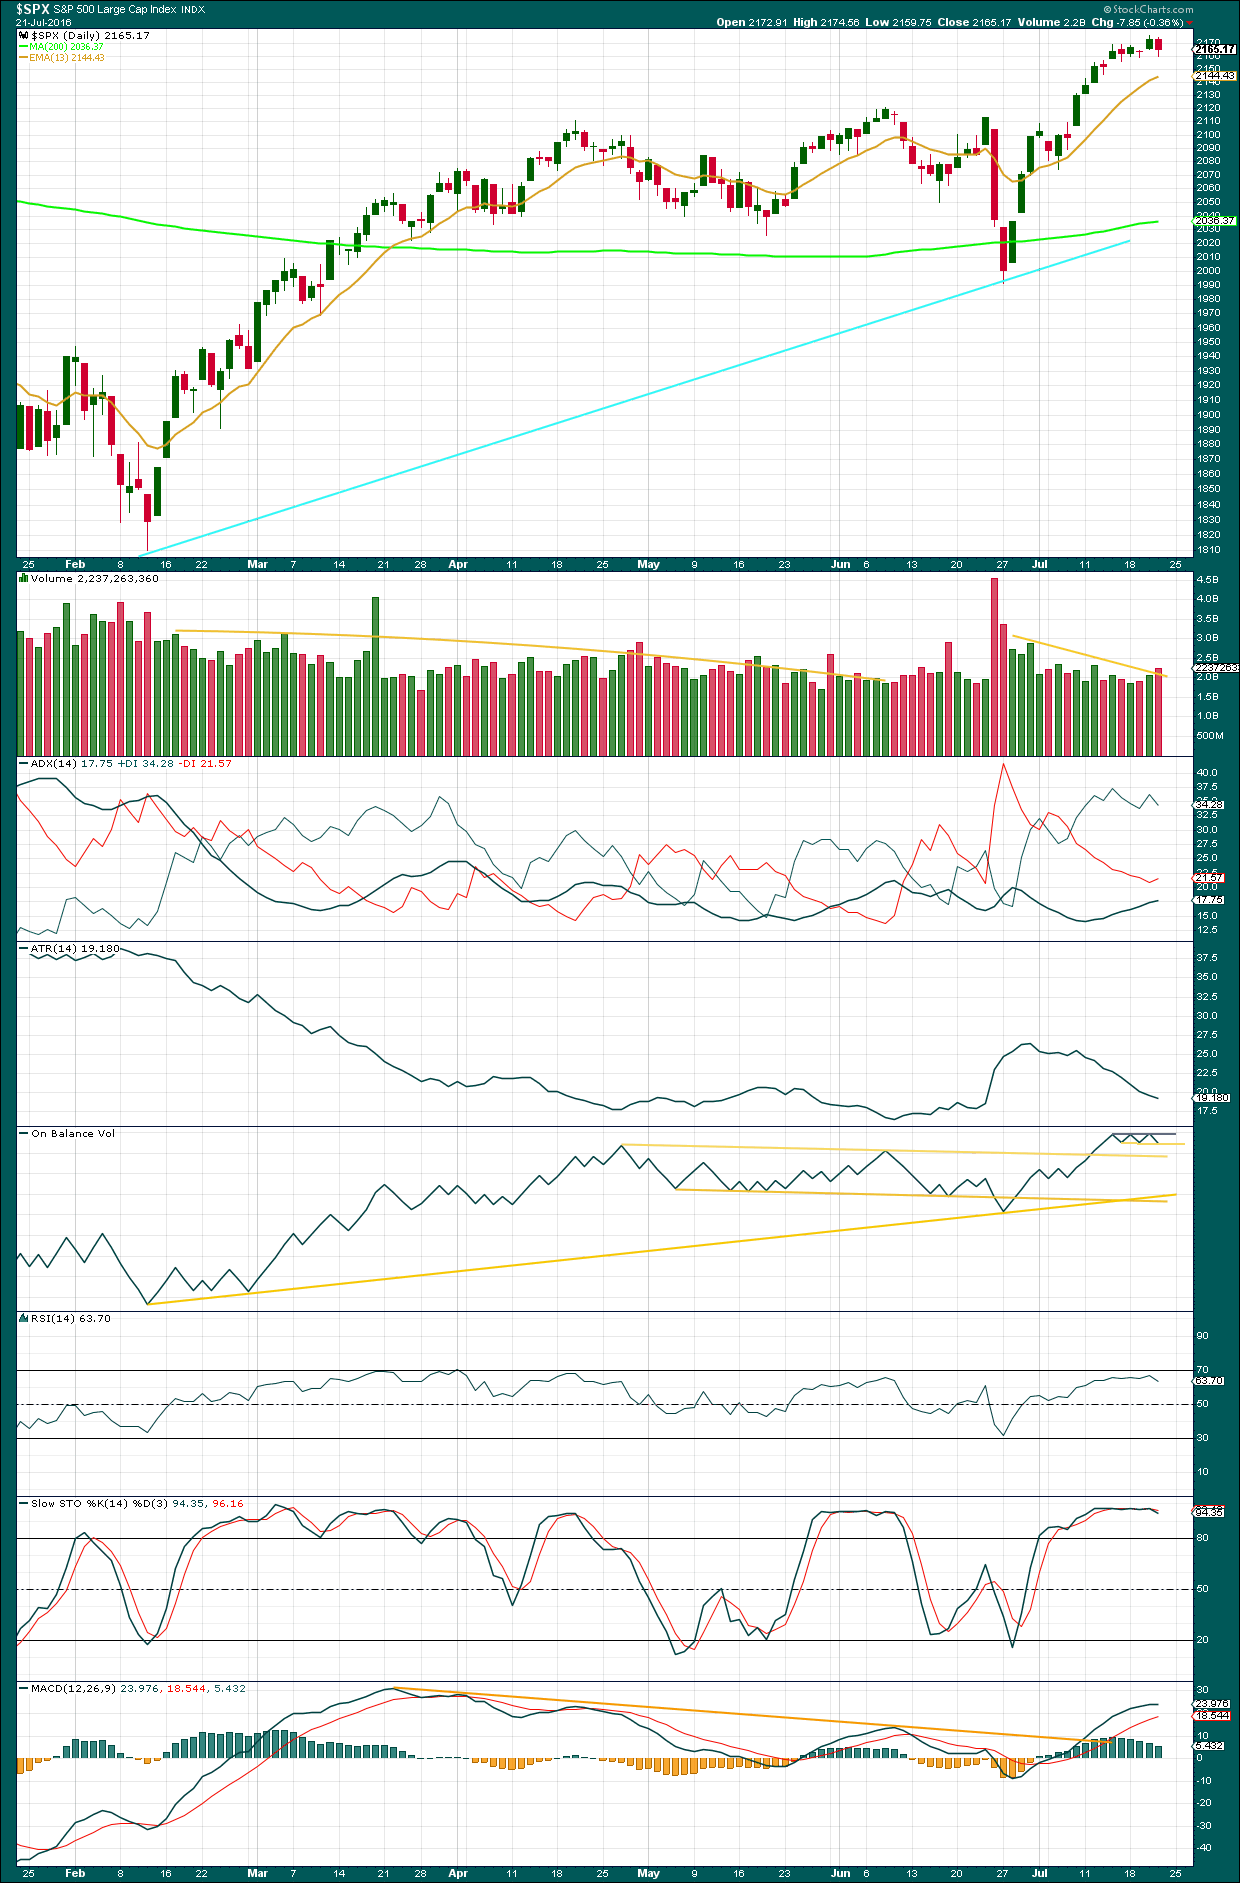
For the first time in several days, since the downwards day of 5th of July, a red daily candlestick is completed which shows some increase in volume. For the first time in a while, there was support for today’s downwards movement in price. This strongly suggests at least a little more downwards movement short term.
Today’s red candlestick completes a bearish engulfing candlestick pattern. The important point for a bearish engulfing pattern is the close of the second candlestick is beyond the open of the first; the bears were in charge today and pushed price to close lower than the open of the prior day. That they did it with increased volume is significant at this point.
ADX is still increasing, indicating an upwards trend is in place, but this is a lagging indicator. The upwards trend is still in its infancy as ADX is between 15 to 20.
ATR is still declining in disagreement with ADX. This upwards trend is weak; each day the bulls pushed price higher but each day the distance travelled was less and less. That is not normal for a healthy sustainable trend.
RSI has not reached overbought, so a bigger deeper pullback is not yet indicated.
Stochastics has reached overbought. Some smaller correction about here may resolve this.
MACD still exhibits longer term bearish divergence with price, but at this time divergence is particularly unreliable. MACD does indicate there was some reasonable momentum to the upwards trend.
On Balance Volume remains constrained within two short term trend lines, the upper line providing resistance and the lower yellow line providing support. If OBV breaks below the lower yellow line tomorrow, that would be a weak bearish signal. OBV needs to break below either of the longer yellow support lines for a deeper pullback in price to be indicated. A break above the upper line (grey, but StockCharts keeps changing it from purple) providing resistance would be a weak bullish signal from OBV and would substantially reduce the probability of a deeper pullback here.
VOLATILITY – INVERTED VIX MONTHLY CHART
Click chart to enlarge. Chart courtesy of StockCharts.com.
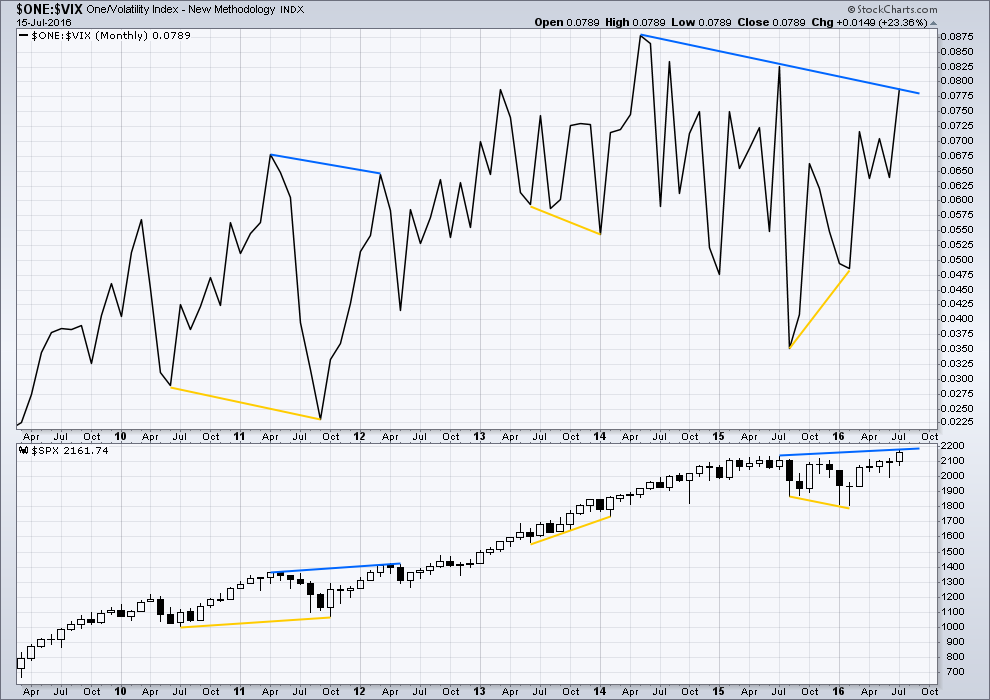
VIX from StockCharts is inverted. As price moves higher, inverted VIX should also move higher indicating a decline in volatility which is normal as price moves higher. As price moves lower, inverted VIX should also move lower indicating an increase in volatility which is normal with falling price.
There is still strong multi month divergence with price and VIX. While price has moved to new all time highs, this has not come with a corresponding decline in volatility below the prior all time high at 2,134. This strong multi month divergence between price and VIX indicates that this rise in price is weak and is highly likely to be more than fully retraced. However, this does not tell us when and where price must turn; it is a warning only and can often be a rather early warning.
At this time, although divergence with price and VIX at the daily chart level has been recently proven to be unreliable (and so at this time will no longer be considered), I will continue to assume that divergence with price and VIX at the monthly chart level over longer time periods remains reliable until proven otherwise.
This supports the idea that price may be in a fifth wave up. Divergence between the end of a cycle degree wave III and a cycle degree wave V would be reasonable to see. Fifth waves are weaker than third waves. This strong divergence indicates that price targets may be too high and time expectations may be too long. However, it remains to be seen if this divergence will be reliable.
DOW THEORY
Major lows within the prior bull market:
DJIA: 15,855.12 (15th October, 2014) – closed below on 25th August, 2015.
DJT: 7,700.49 (12th October, 2014) – closed below on 24th August, 2015.
S&P500: 1,821.61 (15th October, 2014) – has not closed below this point yet.
Nasdaq: 4,117.84 (15th October, 2014) – has not closed below this point yet.
Major highs within the new bear market:
DJIA: 17,977.85 (4th November, 2015) – closed above on 18th April, 2016.
DJT: 8,358.20 (20th November, 2015) – has not closed above this point yet.
S&P500: 2,116.48 (3rd Nobember, 2015) – has now closed above this point on 8th June, 2016.
Nasdaq: 5,176.77 (2nd December, 2015) – has not closed above this point yet.
Dow Theory Conclusion: Original Dow Theory still sees price in a bear market because the transportations have failed to confirm an end to that bear market. Modified Dow Theory (adding S&P and Nasdaq) has failed still to confirm an end to the old bull market, modified Dow Theory sees price still in a bull market.
This analysis is published @ 08:20 p.m. EST.

In Nov 2014, David Letterman made a joke on his Late Night show that the Stock Market was making records every day.
The Stock Market (DJIA) topped out in May. But seeing Lara’s count as Dec 2014 as the end of Cycle III, that joke pretty much called the top.
The last time I saw headlines about the Stock Market on the Drudge Report was the sheer drop in Aug 2015. The DJIA hasn’t been intraday lower since then.
In other words, when the New York Times, the Drudge Report and late night comedians tell me “The stock market is going through the roof,” then I will know the top is in.
Nothing ventured, nothing gained!
Having said that, there are just too many things going on now that militate against a top being in. The moves off the highs are clearly corrective moves and VIX is confirming. The fat candle yesterday was a head-fake in hindsight. It is noteworthy that we have not taken out yesterday’s low so far and this divergence could signal we are close to the end. I think we have at least one more push to the upside. I’m outta here…have a great weekend everyone!
It is Friday…options expiration…and anything can happen over the weekend. Wile e coyote will stay elevated until he looks down. Sooner or later this balloon will pop. Election years are sometimes difficult to trade though. I’ll have another Heineken in Amsterdam….cheers
Rolling over after hours, we’ll see where that goes…
Lara’s triangle idea is holding right now.
Actually makes a lot of sense to see a small zig zag down to complete intermediate wave 4 right before the Fed announcement and Japan next week.
Weakness into Mon/Tues might be an opportune time to pick up some weekly calls.
Yes, so far the main wave count looks right.
MACD is now just above zero and quite flat. This is now offering some support for a triangle.
If it completes as a triangle should then the breakout should be up.
Following price channel higher – for now.
I don’t like the current price action on the short term (5 min chart). Overbought situation is being resolved by going sideways. We should have sold off if we were topping here. Now it’s starting to look like a bull flag on the 5 minute. Good thing it’s a 2 point stop.
The market is clearly consolidating against an ultimate move higher. We should see new 52 week lows in volatility the next few days…should be a great entry point…
Verne..I’m not sold on the bull move higher here. At least not yet. I still think this area here offers some great risk/reward ration for those who can be nimble.
I still think there’s a good chance we sell off into the close. Dow really lagging today in comparison to the SP. We should know within the next 30 min…IMO.
You could be right. In my experience, there are always a few smart traders who can smell what’s coming and often an impending sell-off will be telegraphed by VIX moving higher with the market. It looks to me like today it is saying we are not quite there yet….
Of course things could change by the close so I agree staying nimble and flexible is the key.
I added an oil short today via USO….
well, looks like the bull is about to run over me? 🙁
just lowered my stop to 2168. Risking 1 point as of right now.
I lowered my stop because of the flag on the 5 minute. I don’t like trading against it, so let’s see if bulls or bears win this close.
I got short because this move was over bought and remembering the engulfing candle from yesterday….which is usually a reliable reversal signal. However, we have Yellen and company to contend with.
It is amazing how often people forget that VIX is a measure of “perception” and tells you absolutely nothing definitive about price, either presently or in the future. You heard me. As Yogi would say, 99% of folk get this wrong, and the other half are clueless! Right now we have the amazing situation of traders being willing to pay sixty times more, yep, SIXTY! for VIX 12.00 August standard expiration calls than they are willing to pay for the same strike puts. The bid on those puts is 0.05, on the calls 3.40.
The smart thing for me to have done would have been to sell those calls against my long VIX position rather than selling the shares outright. I may yet do so on the second half. That would lower my cost basis to well under 10.00 per share, so getting called away at 12.00 would still be a reasonably profitable trade. I’d just have to wait until expiration for full profit. The disparity in the put vs call options indicates that there is wide expectation that VIX will be trading much higher at expiration. That is one very fat premium indeed. Does that mean that VIX will actually be trading 3.40 points higher at expiration? No it does not!
BTW, I stumbled across this as I was looking to reload my VIX poistion via naked 10.00 sttrike puts. They are offering NADA!
Tagged yesterdays price spike, this would be a good place to run out of gas.
Finally punching through after 4 attempts, possible attempt to tag recent highs — however candles aren’t strong, still could roll over.
Any chance this is a 2 wave up? I’m not shorting this here…at least not yet, waiting for a signal of some sort, but possible 2 wave up.
IFF this move starts rolling over, I’m gonna hammer it on the short side.
However we take out yesterday’s highs….I’ll be looking to get long on first real pull back.
awe…what the heck. Shorting 1/2 position here 2167 in the ES, with a stop just above at 2169 (1/2 point above yesterday’s high). I like the risk /reward here.
If we only get a 3 wave down from this area on SP500 then this idea may be at play.
Selling half VIX position at 12.85. This move still looks corrective so VIX should offer a better re-entry price in a few days as final move up in markets unfold.
agree…if we don’t sell off soon.
Are VIX ETFs A Powder-keg Waiting To Explode?
“So basically money continues to flow into these products in spite of losses and shows no signs of abating.
So with the fund inflows continuing and approximately 40% of the VIX August futures held by UVXY I think there is a real possibility that the re-balancing needs of this ETF could accentuate any move higher in VIX – which would push stocks down.”
http://www.forbes.com/sites/petertchir/2016/07/21/are-vix-etfs-a-powder-keg-waiting-to-explode/#559864bf65ec
It is not clear to me why he concludes big positions in VIX instruments has anything directly to do with stock prices. I don’t think this author understands what the VIX represents and is making some obviously base-less assumptions, which is quite strange coming from Forbes. Smells like propaganda to me….
Looks like at 4H, SPX caught in a channel with the lower line with some history to it. Watching to see what it does next. Green/Red – SPX, Blue/Light /ES Futures.
https://www.tradingview.com/x/Fk630pEM/
Zoom out:
https://www.tradingview.com/x/YjmpcMcT/
whoah!!! A regression to the mean would just be a nice move!
1987
Im holding my breath….:)
Expecting Gold and Siver to move up strongly here.
That often (not always) goes with the indices moving lower.
COT data showing multi-year extremes so I was expecting the opposite. They are both definitely holding above some key support levels and I was wondering why silver had not yet taken out 19.21. I may need to trim my short position in the miners! Charts do look like it could be a fifth wave up still to come and in commodities those can be manic. It is hard to imagine COT data becoming any more extreme than it already is but that it certainly will if they go higher… 🙂
That COT data has been “wrong” for a while now. Commercials have been heavily short yet price hasn’t fallen much.
The trend is up. So I’m joining it.
Cesar bought a book “The Commitments of Traders Bible” by Stephen Briese. When I’ve digested that I’ll have more confidence in how to use COT data. For now, when I look at it next to a chart of price I cannot see how it’s working as an indicator. And my reading for CMT on COT was very brief. It doesn’t really cover it much.
So I need to keep learning.
It has indeed, and continues to become even more so. Unless we are in a new paradigm and that condition can continue indefinitely, some kind RTM event would be expected.
Thanks Lara, I’m also short gold and long term UST for various technical reasons. Will watch close and tighten up stops.