
In the very short term, sideways movement was expected for one or two sessions before the upwards trend resumed, but this did not happen.
Price has moved higher.
Summary: The trend is up and there is some small support today from volume. The target for a third wave to end is at 2,292. Although there is persistent weakness in upwards movement and little support from volume, price still keeps slowly drifting higher and may continue to do so while there is very little selling pressure. There is no resistance to stop this upwards drift.
Trading advice: Always use a stop loss. Never invest more than 3-5% of equity on any one trade. If you ignore this advice, then you must take full responsibility for the results of your trades.
Last monthly chart for the main wave count is here.
New updates to this analysis are in bold.
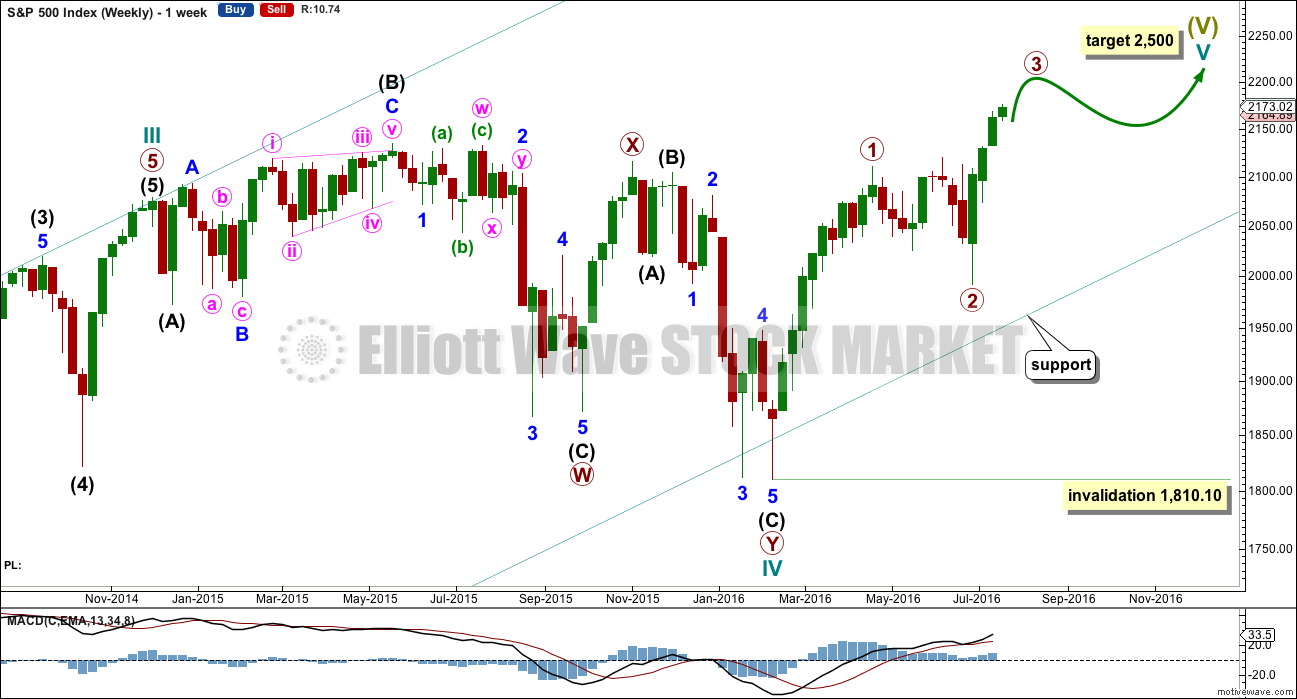
WEEKLY CHART
Click chart to enlarge.
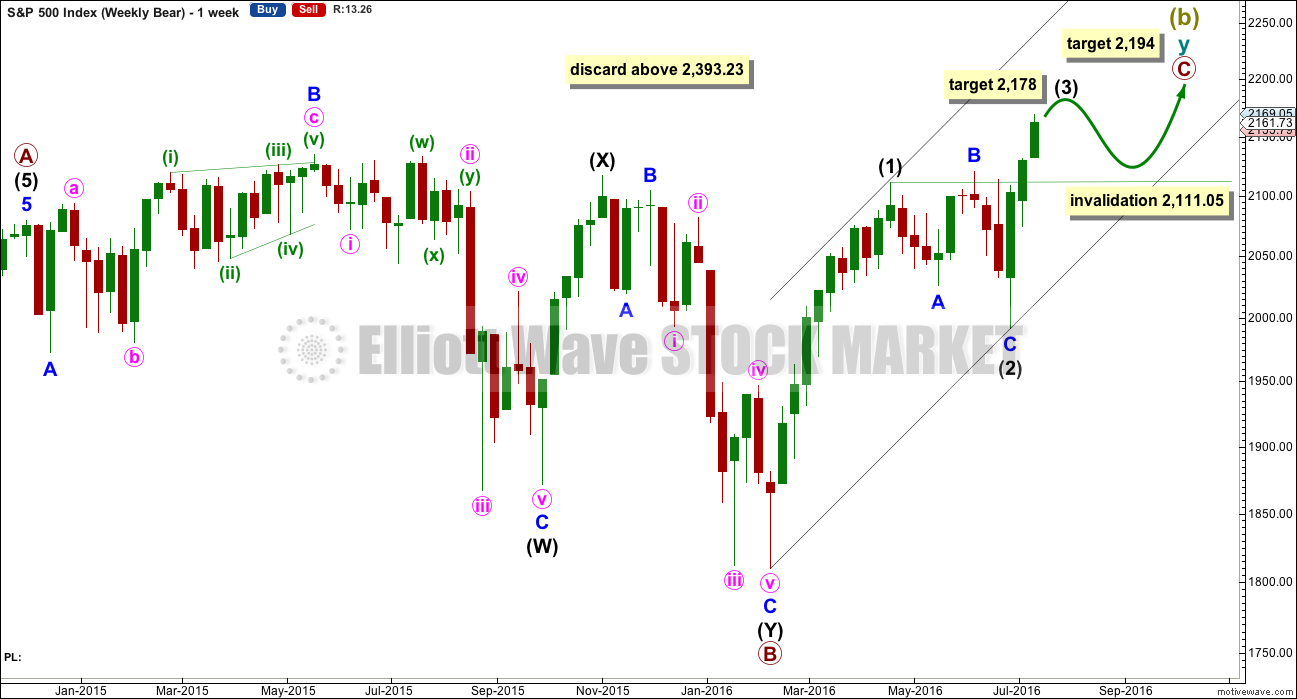
Cycle wave II was a shallow 0.41 zigzag lasting three months. Cycle wave IV is now seen as a more shallow 0.28 double combination lasting 14 months. With cycle wave IV nearly five times the duration of cycle wave II, it should be over there.
After some consideration I will place the final invalidation point for this bull wave count at 1,810.10. A new low below that point at this time would be a very strong indication of a trend change at Super Cycle degree, from bull to bear. This is because were cycle wave IV to continue further sideways it would be grossly disproportionate to cycle wave I and would end substantially outside of the wide teal channel copied over here from the monthly chart.
Cycle wave I lasted 28 months (not a Fibonacci number), cycle wave II lasted a Fibonacci 3 months, cycle wave III lasted 38 months (not a Fibonacci number), and cycle wave IV lasted 14 months (one more than a Fibonacci 13).
If the target for cycle wave V is for it to be equal in length with cycle wave I, then it may also be expected to be about equal in duration. So far cycle wave V is in its fifth month. After this month, a further 23 months to total 28 seems a reasonable expectation, or possibly a further 16 months to total a Fibonacci 21.
Wave count I should be preferred while price remains above 2,074.02. If price moves below 2,074.02, then wave count II would be confirmed.
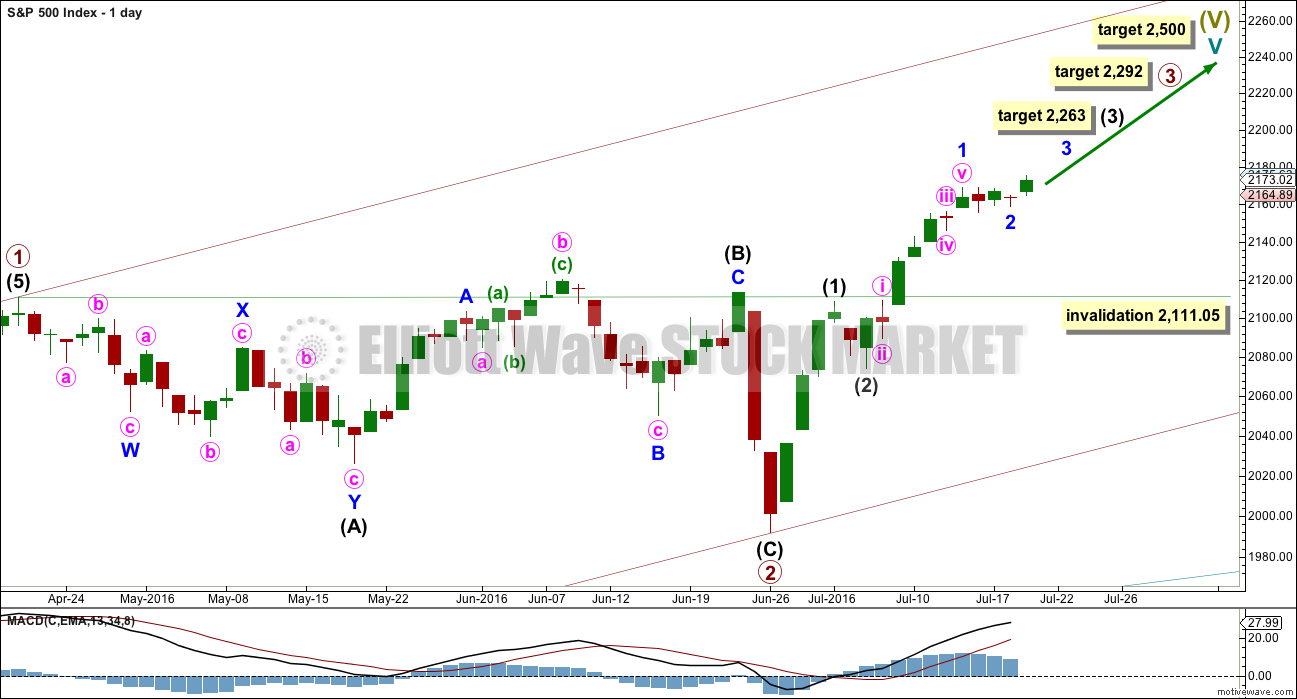
DAILY CHART I
Click chart to enlarge.
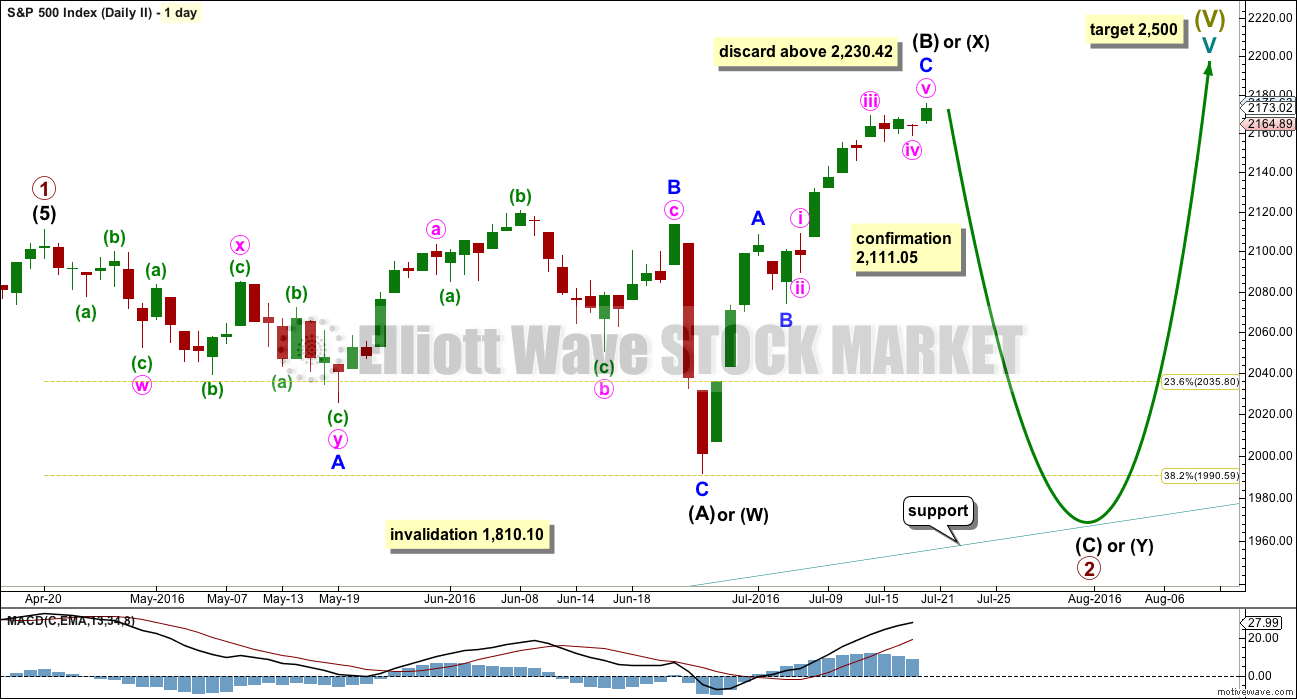
It is now most likely that primary wave 2 is already complete as a shallow regular flat correction. Primary wave 3 is most likely underway.
At 2,292 primary wave 3 would reach equality in length with primary wave 1. This is the ratio used for the target in this instance because primary wave 2 was relatively shallow and it fits neatly with the high probability target of 2,500 for cycle wave V to end.
Primary wave 3 may only subdivide as an impulse. So far within it intermediate waves (1) and (2) may be complete.
When primary wave 3 is complete, then the following correction for primary wave 4 may not move back down into primary wave 1 price territory below 2,111.05.
An impulse upwards looks complete but volume still does not indicate a deeper correction about to begin here. It may be that only minor wave 1 is complete. A small brief correction for minor wave 2 may have completed yesterday and the strongest part of intermediate wave (3) up may have begun today. The alternate hourly wave count below moves the degree of labelling within minor wave 1 all up one degree; it may also be that intermediate wave (3) ended and intermediate wave (5) upwards may be underway today.
When intermediate wave (3) is a complete impulse, then intermediate wave (4) may unfold for another short term pullback. The expectation would be for intermediate wave (4) to last only a few days; intermediate wave (2) may have been over in just two. Intermediate wave (4) may not move into intermediate wave (1) price territory below 2,108.71.
At 2,263 intermediate wave (3) would reach 1.618 the length of intermediate wave (1).
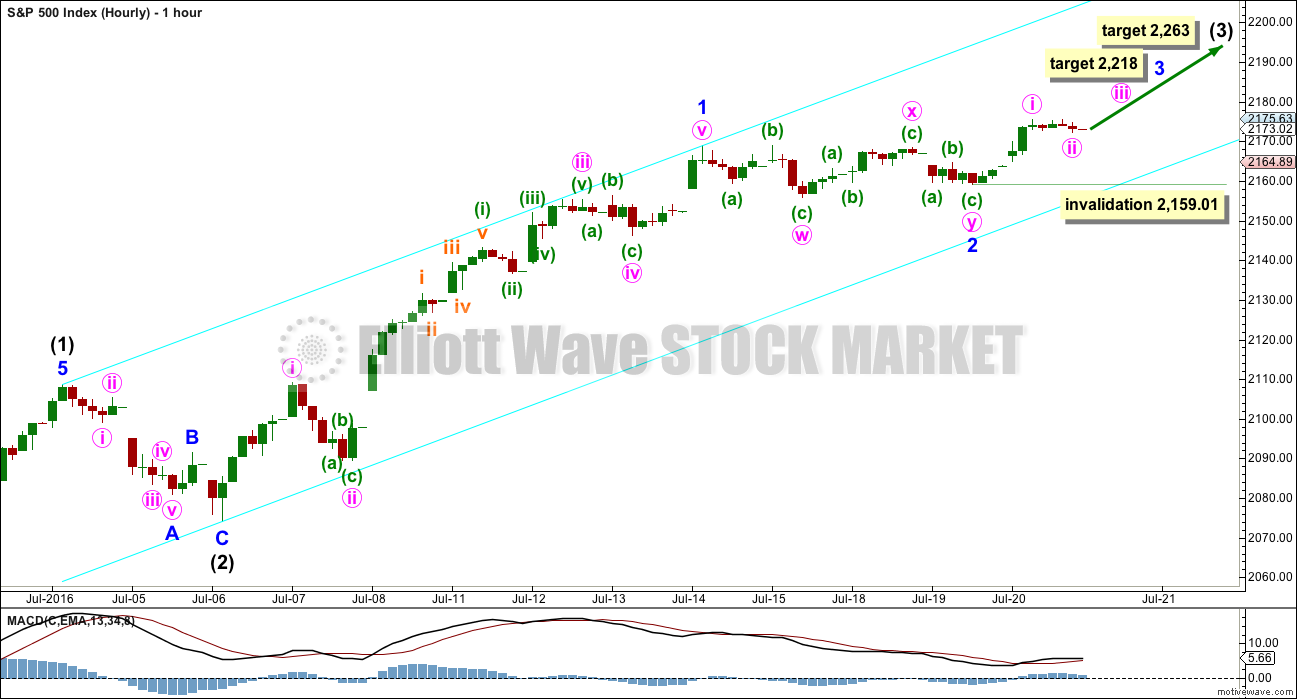
HOURLY CHART I
Click chart to enlarge.
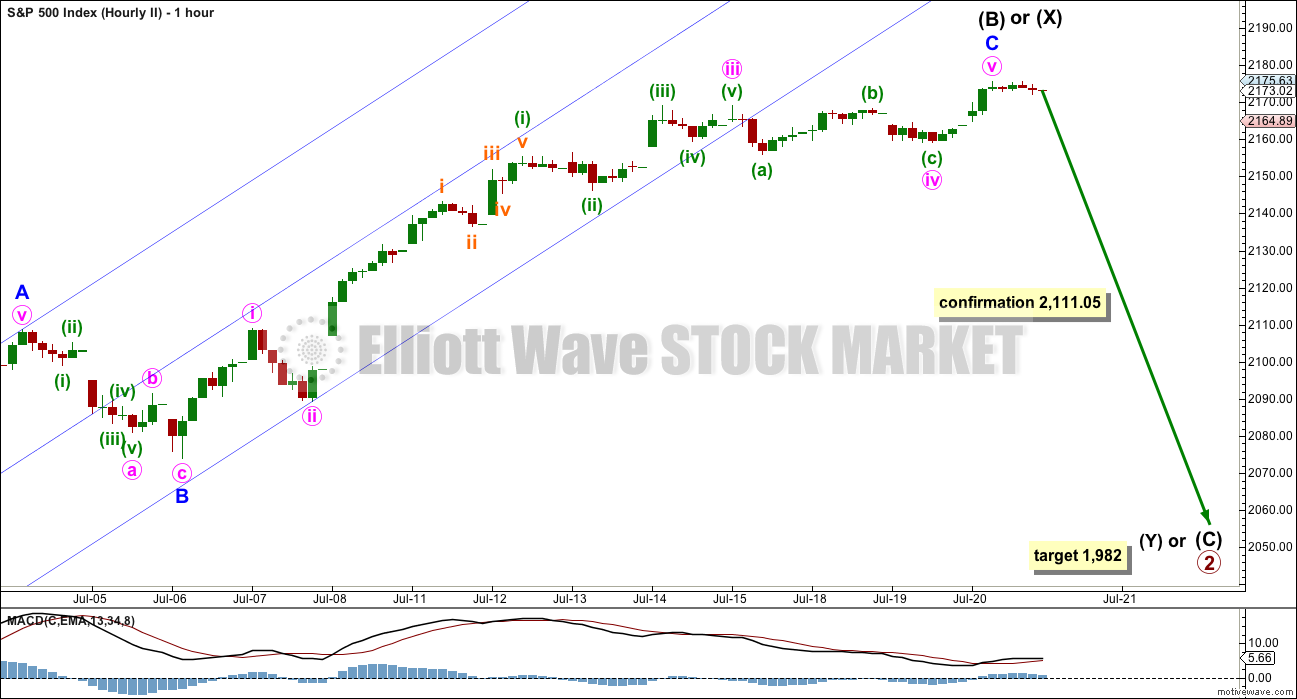
Because so far upwards movement within intermediate wave (3) has not passed equality in length with intermediate wave (1) (that price point would be at 2,191), it should be assumed that it is most likely that intermediate wave (3) is incomplete.
Within the impulse of intermediate wave (3), it may be now that minor wave 1 was complete as an impulse and minor wave 2 complete as a double combination. The double combination fits well on the five minute chart as a flat – X – zigzag which moves sideways and has a typical look for a combination.
Within minor wave 3, minute waves i and ii may have been complete during today’s session. If minute wave ii continues further, it may not move beyond the start of minute wave i below 2,159.01.
This wave count now has a series of three first and second waves complete. It expects some increase in upwards momentum and support from increased volume for upwards movement over the next few days.
At 2,263 intermediate wave (3) would reach 1.618 the length of intermediate wave (1).
Within the middle of intermediate wave (3), minor wave 3 would reach 0.618 the length of minor wave 1 at 2,218. This is the ratio used for the target in this instance because it fits with higher targets at higher degrees, and it makes a little more sense considering the weakness of upwards movement and the extreme bullish sentiment at this time. Minor wave 3 may not be able to be as long as minor wave 1; it may be shorter and it may be a little weaker. As long as it is not the shortest actionary wave within the impulse of intermediate wave (3), then the core rule will be met.
Draw a best fit channel about this upwards movement, shown here in cyan. Draw the first trend line from the end of intermediate wave (1) to the end of minor wave 1, then place a parallel copy on the end of intermediate wave (2). So far movement is contained within this channel. The lower edge may continue to provide support. The upper edge may provide resistance if price gets that high, which looks unlikely at this stage.
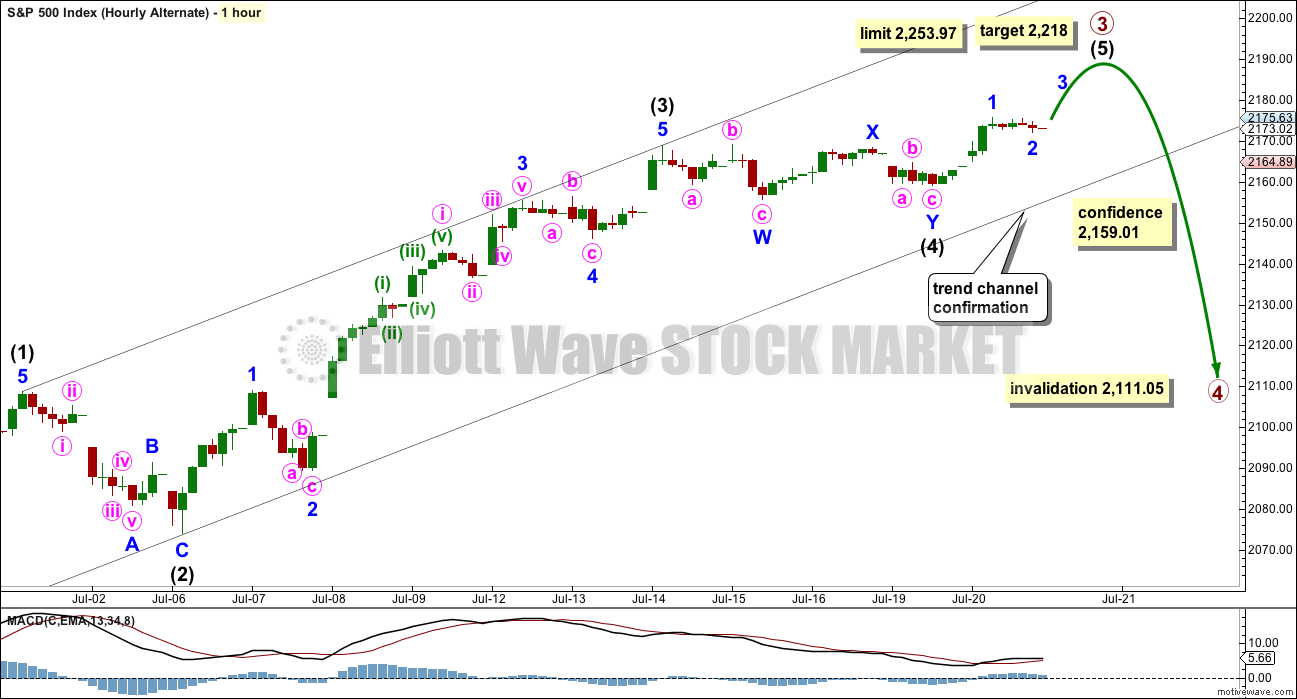
HOURLY CHART I – ALTERNATE
Click chart to enlarge.
This alternate wave count simply moves the impulse that is labelled minor wave 1 (hourly chart I) up one degree. This impulse movement may have been intermediate wave (3).
If this wave count is correct, then intermediate wave (3) was shorter than intermediate wave (1). This limits the fifth wave to no longer than equality in length with the third at 2,253.97, so that the core rule is met, because a third wave may never be the shortest actionary wave within an impulse.
At 2,218 intermediate wave (5) would reach 0.618 the length of intermediate wave (3).
It is possible that intermediate wave (5) was over at the high for today, but because there is some support today from volume for this upwards day it looks unlikely that a primary degree trend change will occur here.
A clear breach of the lower edge of the trend channel about this upwards movement would be an early indication that this wave count may be correct. At that stage, it would increase in probability.
A new low below 2,159.01 would add some confidence from price that a reasonable trend change may have occurred.
Primary wave 4 should unfold as a large time consuming sideways movement. Primary wave 2 lasted 47 days, so primary wave 4 may be most likely to last about a Fibonacci 21 or 34 days.
Primary wave 2 was an expanded flat. To exhibit alternation primary wave 4 may be a zigzag, multiple zigzag, or a triangle. If it is a zigzag, it may be relatively quick. If it is a triangle, it may be much more time consuming.
DAILY CHART II
Click chart to enlarge.
This wave count no longer has a reasonable probability. It has been difficult today to see how minor wave C could be a complete impulse on the hourly chart. At that level, this wave count today looks forced. With volume adding some support today to upwards movement, and volume one of the only indicators that is somewhat working at this time, that should be taken as a warning that this wave count is at this time less likely.
The common length for intermediate wave (B) is from 1 to 1.38 the length of intermediate wave (A), giving a range from 2,111.05 to 2,156.41. At today’s high intermediate wave (B) is now 1.54 the length of intermediate wave (A), longer than the common range but not yet at the maximum convention of 2.
The idea of a flat correction should be discarded when intermediate wave (B) exceeds twice the length of intermediate wave (A) above 2,230.42.
When intermediate wave (B) is complete, then a target may be calculated for intermediate wave (C) downwards. It would most likely end at least slightly below the end of intermediate wave (A) at 1,991.68 to avoid a truncation and a very rare running flat. It may end when price comes down to touch the lower edge of the channel copied over from the monthly chart.
Primary wave 2 may also be relabelled as a combination. The first structure in a double combination may be a complete regular flat labelled intermediate wave (W). The double would be joined by an almost complete zigzag in the opposite direction labelled intermediate wave (X). The second structure in the double may be a flat (for a double flat) or a zigzag to complete a double combination. It would be expected to end about the same level as the first structure in the double at 1,991.68, so that the whole structure moves sideways.
An expanded flat for primary wave 2 is more likely than a double combination because these are more common structures for second waves.
I like to consider all possibilities (within reason), that is the correct way to do Elliott wave analysis, and indeed any technical analysis. I am aware that several members are still holding short positions opened below 2,134 against my clear and repeated advice to always use stops for all trades. I am concerned that in publishing this wave count some of those members may take it more seriously than they should, in the hope of a bigger pullback to offer a good exit from losing positions.
Hope is not an investment strategy.
My concern is that publishing this idea may prevent members from exiting losing positions, no matter what I say about probability and volume. However, the refusal of some members to manage risk should not mean that my analysis is less thorough than I would like it to be. That would be detrimental to all other members who are able to manage risk.
HOURLY CHART II
Click chart to enlarge.
It is now difficult to see the upwards zigzag of intermediate wave (B) or (X) as over. This wave count at the hourly chart level today looks forced. This usually means that it is wrong and so the expected direction is wrong.
This wave count is published today to illustrate why it is my judgement that price will move up, not down. To see a wave count that has price moving down from here does not have the right look.
This wave count requires some confirmation from price with a new low below 2,111.05. At that point, it would be taken seriously.
At 1,982 intermediate wave (C) would reach 1.618 the length of intermediate wave (A).
BEAR WAVE COUNT – WEEKLY CHART
Click chart to enlarge.
It would still be possible that a Super Cycle trend change is close if Super Cycle wave (b) (or (x) ) is subdividing as a double zigzag.
However, the expected direction and structure is now the same short and mid term for this idea as it is for the main wave count.
Within the second zigzag of cycle wave y, primary wave C must complete as a five wave structure.
So far Super Cycle wave (b) is 1.72 the length of Super Cycle wave (a). This is comfortably longer than the normal range which is up to 1.38, but still within the allowable convention of up to 2 times the length of wave A.
Above 2,393.23 Super Cycle wave (b) would be more than twice the length of Super Cycle wave (a). Above this price point the convention states that the probability of a flat correction unfolding is too low for reasonable consideration. Above that point this bear wave count should be discarded. The same principle is applied to the idea of a double combination for Grand Super Cycle wave II
A five wave structure upwards would still need to complete for primary wave C. So far upwards movement is a very strong three wave looking structure. Trying to see this as either a complete or almost complete five would be trying to fit in what one may want to see to the waves, ignoring what is actually there.
At 2,178 intermediate wave (3) would reach 0.618 the length of intermediate wave (1).
Thereafter, intermediate wave (4) may move sideways for a few weeks as a very shallow correction. Thereafter, intermediate wave (5) would most likely make a new high. At 2,194 primary wave C would reach 0.382 the length of primary wave A. This final target is close to the round number of 2,200 and so offers a reasonable probability.
If price reaches 2,200 or close to it, then this idea would again be assessed, and an attempt made to determine its probability. The situation between now and then though may change.
The important conclusion is more upwards movement is extremely likely, as a five up is needed to complete.
TECHNICAL ANALYSIS
WEEKLY CHART
Click chart to enlarge. Chart courtesy of StockCharts.com.
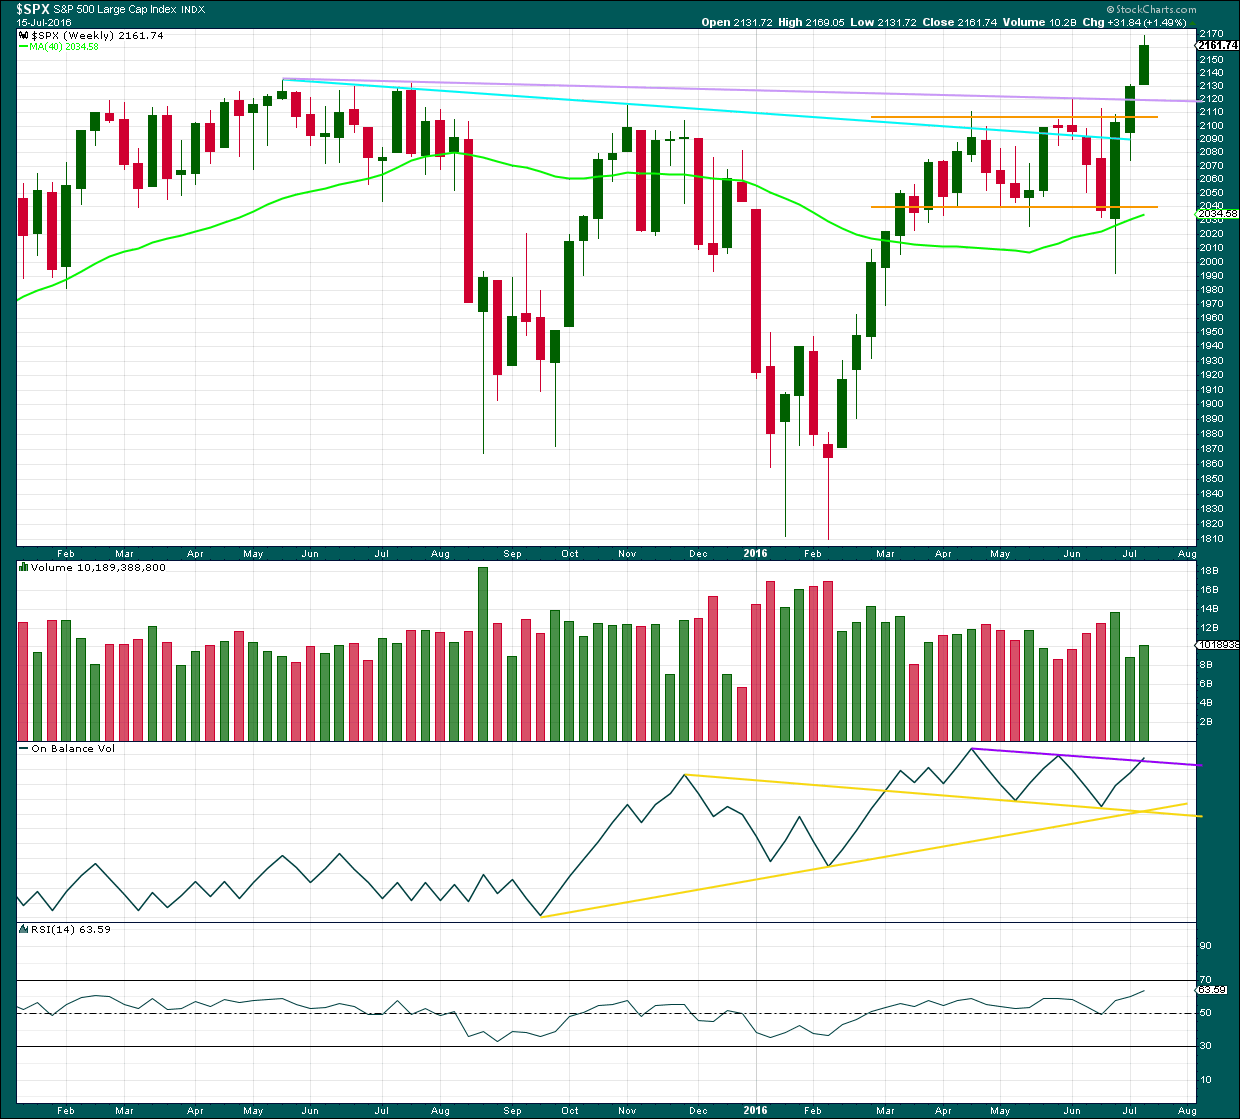
At the end of last week, price has very clearly broken out of the prior consolidation upwards. This applies not only to the small consolidation on the weekly chart shown by yellow support and resistance lines, but also to the larger multi month consolidation that was shown in prior weekly charts and which had the upper resistance line at the prior all time high of 2,134.
Volume last week is higher than the week prior. There is some support from volume for the rise in price although the first upwards week still has strongest volume.
From the last swing low, there is now a bullish engulfing candlestick pattern followed by three advancing white soldiers pattern. Both patterns are bullish.
DAILY CHART
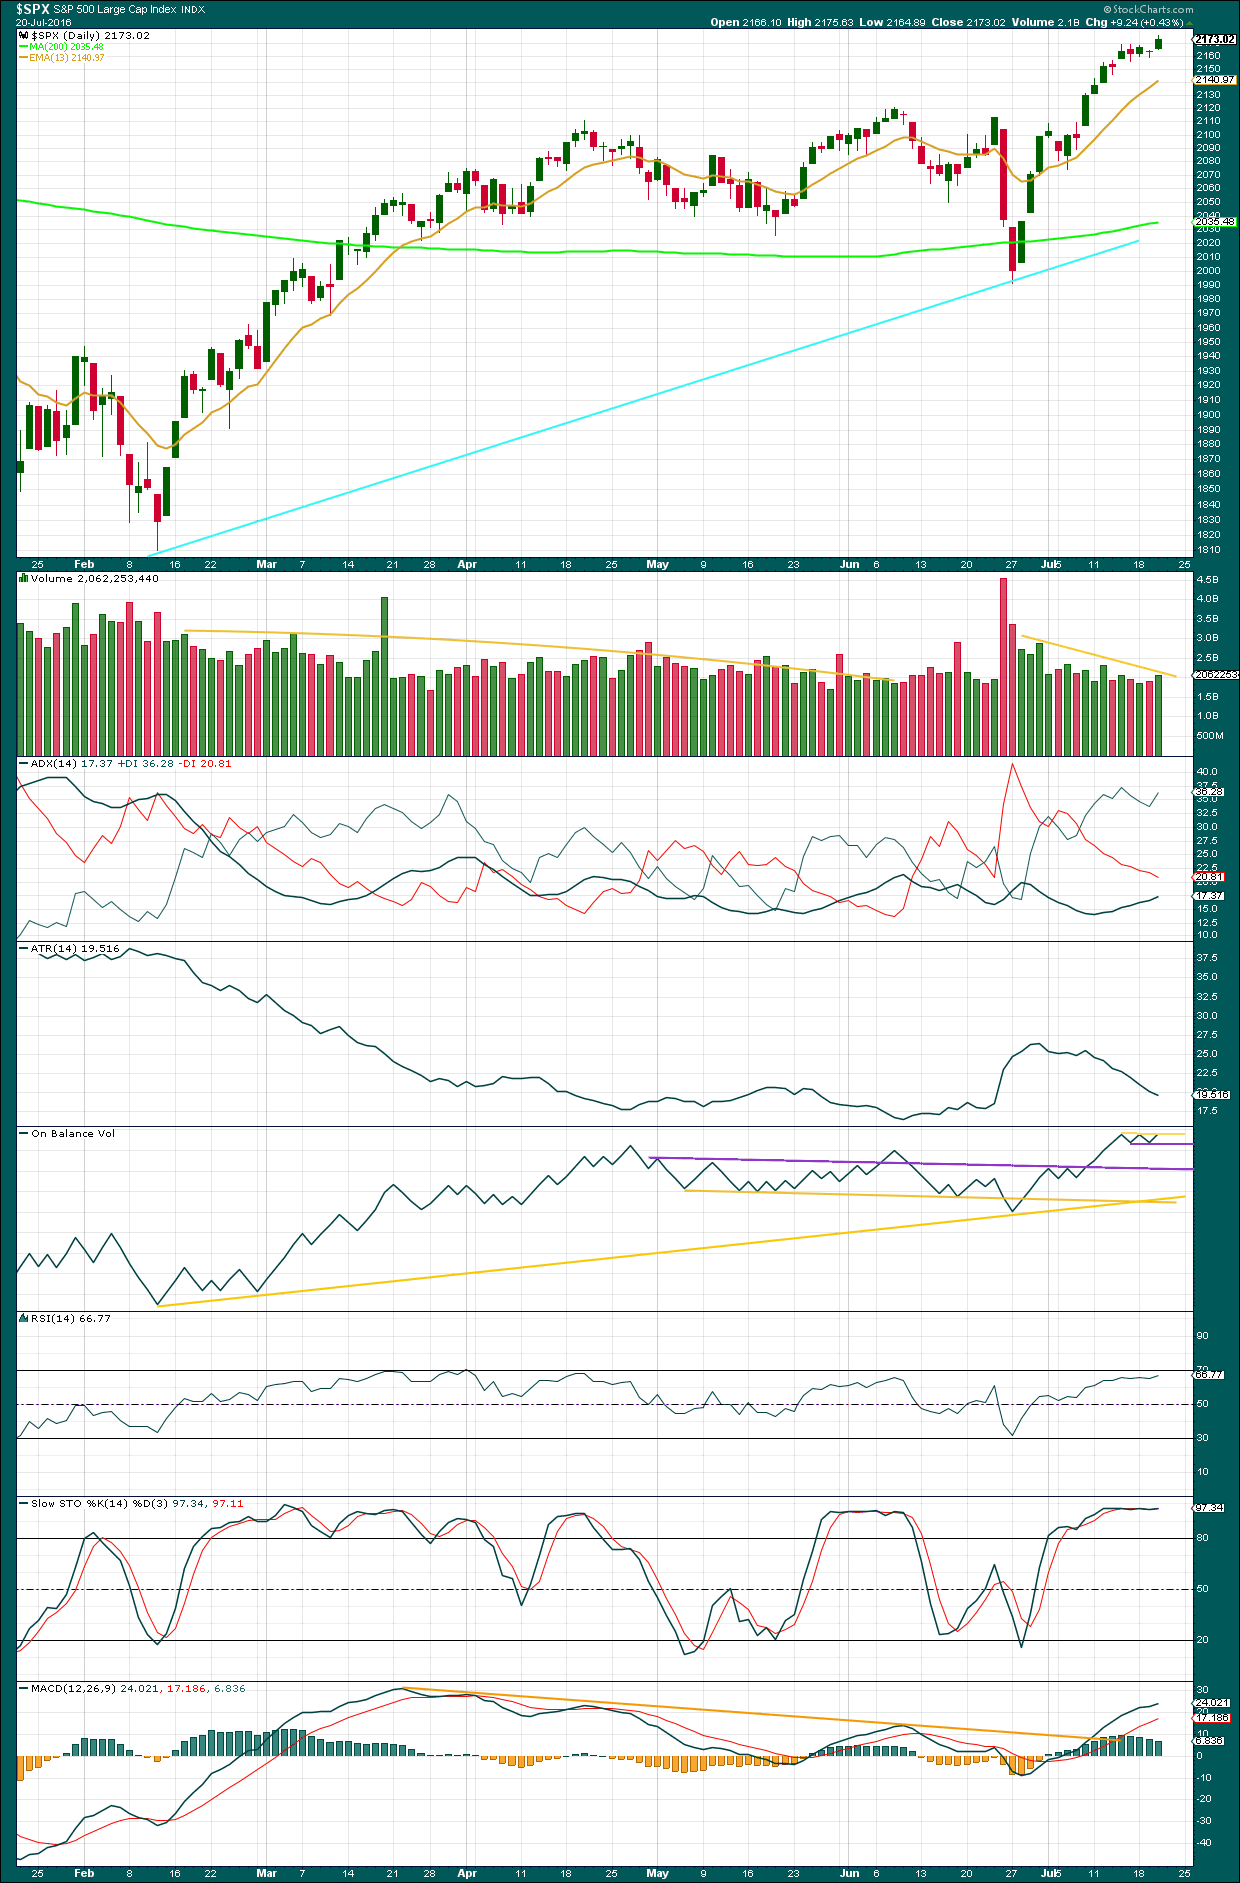
Click chart to enlarge. Chart courtesy of StockCharts.com.
Overall, volume is falling as price rises. The volume profile mid term is still bearish.
In the short term, today’s upwards day comes with an increase in volume over the last three sessions. There is support today for the rise in price. This supports both the first two hourly Elliott wave counts but cannot tell us which one of those two is correct.
There may not be enough selling pressure for the second wave count, which expects a bigger drop. When price is falling it is not falling with strong volume (with the exception of Brexit). Some greater support from sellers may be required for a deeper pullback here. At this stage, no evidence of selling pressure is seen.
ADX is increasing and above 15 indicating a new upwards trend is in place. ATR is still very clearly declining. This is not normal for a trending market and indicates some weakness.
On Balance Volume today moved upwards with price. Two new very short term lines are added to OBV. A break below the short purple line would be bearish. A break above the short yellow line would be bullish. These lines offer weak signals only. But if a break by OBV precedes a breakout from price, then it should indicate the direction for a breakout by price.
The divergence previously noted between price and RSI has today disappeared. At this time, divergence is proving consistently unreliable: it turns up, deepens, then disappears as price keeps rising. RSI today indicates there is some strength to this upwards movement.
There is still negative bearish divergence between price and MACD. This new upwards trend is lacking in momentum.
There is again something wrong with this trend, so it should be expected eventually to be more than fully retraced. Each day the bulls are able to push price up by a smaller and smaller amount. This trend is tired and weak.
However, looking back at the larger picture price was able to rise in light and declining volume for many months up to the last all time high. Weakness indicates the movement is likely to be more than fully retraced, but weakness can persist for reasonable periods of time before the market changes from bull to bear. This persistent weakness indicates some caution, targets may be too high and optimistic.
VOLATILITY – INVERTED VIX MONTHLY CHART
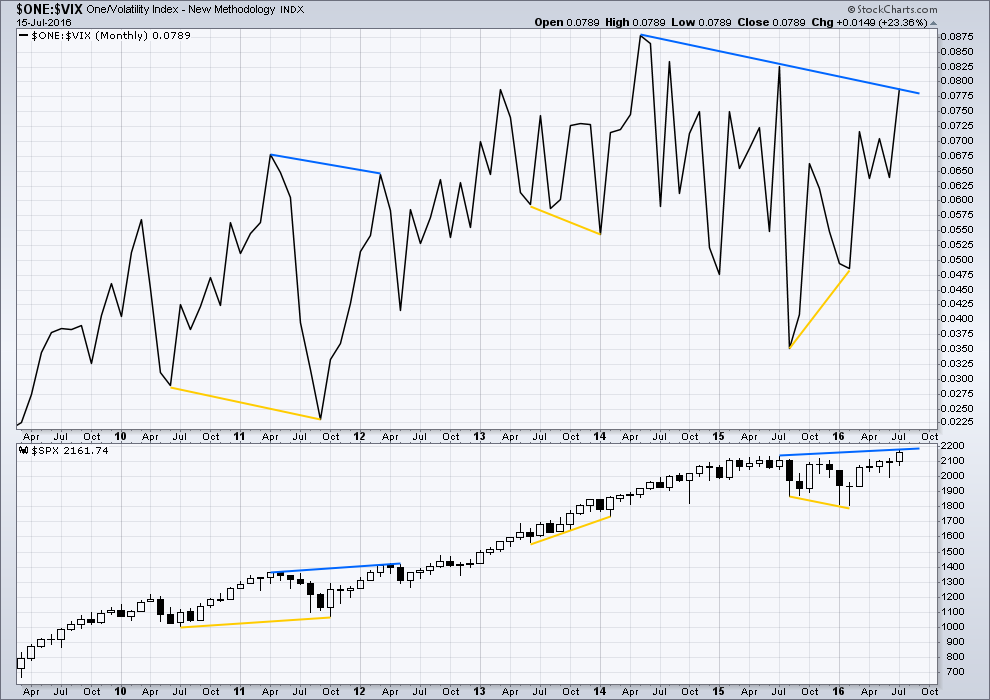
Click chart to enlarge. Chart courtesy of StockCharts.com.
VIX from StockCharts is inverted. As price moves higher, inverted VIX should also move higher indicating a decline in volatility which is normal as price moves higher. As price moves lower, inverted VIX should also move lower indicating an increase in volatility which is normal with falling price.
There is still strong multi month divergence with price and VIX. While price has moved to new all time highs, this has not come with a corresponding decline in volatility below the prior all time high at 2,134. This strong multi month divergence between price and VIX indicates that this rise in price is weak and is highly likely to be more than fully retraced. However, this does not tell us when and where price must turn; it is a warning only and can often be a rather early warning.
At this time, although divergence with price and VIX at the daily chart level has been recently proven to be unreliable (and so at this time will no longer be considered), I will continue to assume that divergence with price and VIX at the monthly chart level over longer time periods remains reliable until proven otherwise.
This supports the idea that price may be in a fifth wave up. Divergence between the end of a cycle degree wave III and a cycle degree wave V would be reasonable to see. Fifth waves are weaker than third waves. This strong divergence indicates that price targets may be too high and time expectations may be too long. However, it remains to be seen if this divergence will be reliable.
DOW THEORY
Major lows within the prior bull market:
DJIA: 15,855.12 (15th October, 2014) – closed below on 25th August, 2015.
DJT: 7,700.49 (12th October, 2014) – closed below on 24th August, 2015.
S&P500: 1,821.61 (15th October, 2014) – has not closed below this point yet.
Nasdaq: 4,117.84 (15th October, 2014) – has not closed below this point yet.
Major highs within the new bear market:
DJIA: 17,977.85 (4th November, 2015) – closed above on 18th April, 2016.
DJT: 8,358.20 (20th November, 2015) – has not closed above this point yet.
S&P500: 2,116.48 (3rd Nobember, 2015) – has now closed above this point on 8th June, 2016.
Nasdaq: 5,176.77 (2nd December, 2015) – has not closed above this point yet.
Dow Theory Conclusion: Original Dow Theory still sees price in a bear market because the transportations have failed to confirm an end to that bear market. Modified Dow Theory (adding S&P and Nasdaq) has failed still to confirm an end to the old bull market, modified Dow Theory sees price still in a bull market.
This analysis is published @ 10:48 p.m. EST.
If we only get a Three down from here that stops above the June low, then this idea maybe in play.
Yes, an excellent idea. And yes, it would explain a lot.
I’ll have to start publishing this idea soon too.
So many alternates!
“Are Stocks Cheap Or Expensive” – Here Are 20 Answers
“Is the S&P 500 cheap or expensive” – that is the question every trader has to answer every day.
Vague enough yet? If not, then here is the full answer, or rather 20 answers, because BofA does the proper thing and instead of giving one blanket statement to the most fundamental question, it looks at the 20 most important valuation measures, and finds that the market is overvalued, in some cases dramatically, according to a majority of the most popular metrics.
http://www.zerohedge.com/news/2016-07-21/are-stocks-cheap-or-expensive-here-are-20-answers
For the first time since 6th July we have a downwards day which is relatively strong and has an increase in volume.
If there is going to be a larger pullback, and I say IF only, then this may be the start.
It still needs some trend channel confirmation and price confirmation.
I must say today’s action presents quite a conundrum. This red candle is really too big to be coming in the middle of a third wave to the upside. The level of complacency does indeed suggest some kind of significant top, but frankly, as manic as the price action has been the last few weeks, it just did not seem to rise to the level of a primary third wave to the upside – neither in terms of intensity, nor of duration. I am completely bewildered as to what is happening. It makes absolutely no sense whatsoever. Is this the way super cycle tops conclude…?! (with really what would have to be considered a whimper if it is indeed over here.)
Could it possibly still be minor two of intermediate five on primary three up?
That would be very much in keeping with my idea of a move down to dislodge a few bulls prior to a strong move to the upside.
Problem is VIX is saying “no cigar” to that idea…totally befuddled as to how to trade this chimera…will probably liquidate half of VIX holdings tomorrow unless we pick up speed to the downside out the gate…
The hourly alternate may be right. This could be the start of primary wave 4 down. Price is finding support right now at the lower edge of that channel.
For any confidence in that wave count the channel needs to be breached. Prior to that the first hourly chart is also entirely viable.
ok! thanks Lara. Looks like 2159 is holding.
Here are the PC numbers for IWM and SPY.
PC average is trending upward for IWM….for SPY, not really yet.
I have removed an unhelpful negative comment from a member.
If any members do not have confidence in my analysis then you may cancel your membership. Coming in here and making unhelpful negative comments will see the person removed from this membership and blacklisted immediately.
Keep it polite and respectful. You can have your private opinion of me, but keep it polite.
This market is certainly fraying a few nerves is it not? I never quite understand the need to become personal and peevish. Of course, every one knows I only loose my cool when I think folk are unduly giving Lara grief… luckily for someone I missed that comment whatever it was; had to leave for a few hours…. 🙂
I loose my cool when people don’t mind their business…
That goes for you too Jack. Say what you will about me but If you are ever disrespectful to her you WILL be hammered. 🙂
(Then again she would probably save us all the trouble and take care of the problem herself!)
Mind your business…I find it funny how people seating behind their PCs could talk so much trash…Come bully me down in Georgia…
I’ve just noticed this small exchange….
I will assume the best of you both, and assume it is friendly banter.
If not then either of you may let me know via email, but you know what my answer will be.
Play nice!
One of my favourite maxims, “good manners are free”.
There is not enough of it in the internet these days. I want this space to be exceptionally polite and positive.
Yes, it does seem like that! 🙂
You know you’ve timed a trade right when it goes from underwater to massively in the green in mere hours! It is amazing how effective lowering cost average can be on a conviction trade. VIX was a screaming buy…. 🙂
Two years ago I here, soon stops a subscription, I learned a lot. Thank you everyone and especially to Lara.
You’re welcome, and you’re also welcome back if you so choose in the future.
Thank you for your participation.
Well Barry, I think Lara’s the best analyst I have ever come across. This market is one of the toughest markets I’ve ever traded. It’s tough when you have someone (e.g. banksters) behind the scenes rigging the tape with unlimited funds at their disposal. How does one decipher all this? It’s not a job I would want or am I capable of doing well. Lara is hands down my all time favorite technical analyst.
Amen to that!
Yes, agree!
This is difficult and stressful work, and Lara does it with serious dedication.
You just gotta love the least probably wave counts! Looks like 2159 is going to fall…
I remain cautious as I was expecting a deep enough correction to shake out weak bullish hands and maybe trap a few bears.
I can’t stand it anymore…covering my short. Too much money to leave on the table here.
Plan on reshorting the next rally on the 30 minute chart….as there’s ALWAYS a counter trend move!
I’ve just exited all my shorts… of course this probably means it is the best time to go short.
Don’t look now, but we could have an engulfing candlestick on the daily ES chart….depending on the close. That would add some real comfort to those who are short.
Final wave down underway. Looking for a hammer or long lower wick to signal time to get the hell out of Dodge on the short side…2159 holding so far…
If we take out 2159 today I will be reloading a few SPY 215 puts expiring this week…trade will be intra-day as it looks like we already have fourth wave. If that is the case impulse down will probably complete today or early tomorrow as has been the case recently…
so you think we are in wave4 and wave5 up is coming???? or we completed wave up 5 and just had first impulse down?
Looks to me like a continuing wave four with one more leg down to come to complete impulse down…I am a lousy wave counter so take anything I say with a big fat grain of salt! 🙂
We have not yet eliminated the possibility of a continuing minute two so it would probably be wise to keep very close tabs on what happens into the close…
The VIX candle is looking quite healthy, the kind of girth and height you want to see at the start of a run towards the upper BB. Another nice fat one tomorrow along with a gap up open would augur well for the immediate bearish case imho…
Man I hate leaving money on the table! 🙂
Nice pop in volatility though…let’s see how the banksters respond…
Nice to be above water in my VIX position with a 12.25 cost basis..
In 2007 Market broke out to new high before dropping 53%
So…do you think we are about to see a repeat? and if so, what other similarities are you seeing to 2007? 🙂
1987
everything is possible considering how high we have gone since the last crash. If you look at the chart from Jun-Oct 2007. (sorry I am outside with no access to charts).
Here’s my thought Verne.. there’s no one left to buy. Who on earth would buy this market after a 180+ run straight up? People either shorted it or for the one’s smart enough to catch this move up…. well they are looking to sell. A few points down IMHO isn’t nearly enough to relieve this over bought condition.
..additionally, the spike in volume we saw yesterday (on the daily chart)…well, if you take a closer look at the price action, it was because sellers started showing up finally. That’s what made me enter my short position yesterday pm. So I would look at yesterday as a possible climax.
Of course..all this just my opinion and we could move up from here. So PLEASE always trade with money management policy firmly in place.
My original plan was to add to my short position if SPY failed to close above 218 but I instead opted to take the scalp. still would like to see a more definitive reversal signal before calling a top. If we close at the lows of the day, and see a VIX gap tomorrow that would definitely suggest a deeper correction underway. Tomorrow is the last day for UVXY trading before the split so it would be nice to get some idea of what Mr. Market has in mind.
I hear ya. What the banksters are going to do is now ramp it up higher on extremely low volume. I suspect they are starting to to get very desperate.You are absolutely right- there are very few buyers left. The global macro-economic situation makes these evaluations of US equities markets total insanity, pure and simple. As soon as the crowd figures this out, they start to bail. While we probably still have more upside, I suspect we are eventually going to get a universal Eureka! moment and the reversal is going to be historic- not like the timid downside action we are seeing today…
pressing my short here with another 1/4… bringing position to 3/4 full. Will wait for a rally on the 30 minute chart to add final 1/4.
Selling second half at 0.85. I suspect move down will complete intra-day as has been typical. A green print means a good risk/reward upside trade.
Selling half 215 SPY puts for quick 25% @0.80. Move down should relieve a bit of oversold condition. I think it should go a bit lower to rattle a few more of the bullish cohort before the uptrend resumes…
Sorry…I meant “over-bought”…
Bull bear battle. Market is getting to a point where day trading is now becoming too difficult. Look at the size of these 5 min candles…back and forth. Still short my swing trading position, I have now lowered my stop to break even.
According to my ew count, this move up is done.
Don’t think so. This move looks corrective. I think we have one final move up…
Leading diagonal off the highs for wave 1, this move is corrective, cuz it’s a small 2.
ES not SP, futures hours.
…little ole 3 wave. 🙂
Looks like the bulls won that battle this am…at least so far.
Unlike manic rallies in indices which can be induced by central banks, sentiment cannot be fabricated. Volatility readings are now at levels not seen since last August. Speaking of rallies, a cursory look beneath the hood of the current one is quite revealing so far as how many of the various index components are actually displaying bullish charts. While we could be entering another period of extended low volatility readings such as we saw in 2013, it is also possible that the remarkable level of complacency we are seeing in the markets right now could be presaging something far more sinister. This pump parade of the central banks notwithstanding, the fact is that the US economy is in recession. Oh yes! I know the FED and all the talking heads will do their best to apply lots of lipstick to the pig to try and keep the masses clue-less until at least after the election but that changes nothing of the reality. Companies will continue to report “better than estimates” earnings even when their revenue goes to zero or less. The total amount of negative yielding government bonds globally now stands at around 13T, but don’t worry, everything’s fine, dive right in everybody! And yes, the VIX is below 12. Nothing to fear here. Someone has pointed out that markets never top in the Summer, and that may yet hold true. Nonetheless, with VIX at these levels, I continue to be a buyer. Interest rates are starting to whisper that this party is closer to its end than its beginning. It would in my view be wise to pay attention to that quiet warning.
Long TBT.
Short TLT.
The long end of the yield curve is where every trader can engage the banksters on a fairly level playing field and that is where I am staying! 🙂
Vern,
Agree but until FED and Central Bankers loose public trust, we need to stay nimble in our trades. I expect drop in markets will again bring the bears out in full force only to be slammed hard by the banksters…
When was the last time you saw the bears out “in full force”? They have lost every single round number pivot battle the last several months and
frankly I have not seen anything of that sort for many a moons. Impulses down are completing swiftly in a day or two with manic retracements and this has been the pattern for months. There are simply no bears to slam I’m afraid and there haven’t been any for quite some time. VIX is telling us there are even fewer these days. The market does not need sellers to fall and when it begins stair stepping down in the absence of serious selling will be the first clue the banksters are pushing on a string. I agree until such time scalping in really the only game in town. As long as the market remains above 2100 the immediate bearish case is in my view tenuous at best. The worse possible outcome is another several months of sideways, range-bound action. One trader I like expects an IHS target of 2200 to complete the current move, which I continue to think entirely bogus. Still accumulating volatility.
This game of being first has probably run its course. No one had claimed the position in the last one hour.
I will take it then,,,
You’re the One and Only…Which is a great gauge that the sentiment is so bullish that all bears have been driven into their caves. Time to start inching into some short positions with the VIX below 12. I’ll leave you with this quote from Warren Buffett,” Be Fearful When Others Are Greedy and Greedy When Others Are Fearful”. Happy Trading.
With the greed meter at CNN at 90% then I guess we should be fearful.
Yep….puts still rare….stochastic are overbought and the macd is starting to lose upwards momentum….usually when macd goes flat and the stochastic a are at overbought you have a trade able sell off. While spx does not have any overhead resistance, qqq and trannies do. Qqq’s are hitting it now. See what happens
Not necessarily BULL but could be A Bear that is scared and on sidelines…I tend not to over assume things based on what CNN or other media outlets. Give me on outlet that has come out and stated the fishy nature of market reactions and true state of economy with respect to jobs…