A short term pullback was expected. Another small inside day completes a small red doji.
Summary: In the very short term, sideways movement may continue for another session or so. Thereafter, the upwards trend should resume.
Last monthly chart for the main wave count is here.
New updates to this analysis are in bold.
WEEKLY CHART
Cycle wave II was a shallow 0.41 zigzag lasting three months. Cycle wave IV is now seen as a more shallow 0.28 double combination lasting 14 months. With cycle wave IV nearly five times the duration of cycle wave II, it should be over there.
After some consideration I will place the final invalidation point for this bull wave count at 1,810.10. A new low below that point at this time would be a very strong indication of a trend change at Super Cycle degree, from bull to bear. This is because were cycle wave IV to continue further sideways it would be grossly disproportionate to cycle wave I and would end substantially outside of the wide teal channel copied over here from the monthly chart.
Cycle wave I lasted 28 months (not a Fibonacci number), cycle wave II lasted a Fibonacci 3 months, cycle wave III lasted 38 months (not a Fibonacci number), and cycle wave IV lasted 14 months (one more than a Fibonacci 13).
If the target for cycle wave V is for it to be equal in length with cycle wave I, then it may also be expected to be about equal in duration. So far cycle wave V is in its fifth month. After this month, a further 23 months to total 28 seems a reasonable expectation, or possibly a further 16 months to total a Fibonacci 21.
Wave count I should be preferred while price remains above 2,074.02. If price moves below 2,074.02, then wave count II would be confirmed.
DAILY CHART I
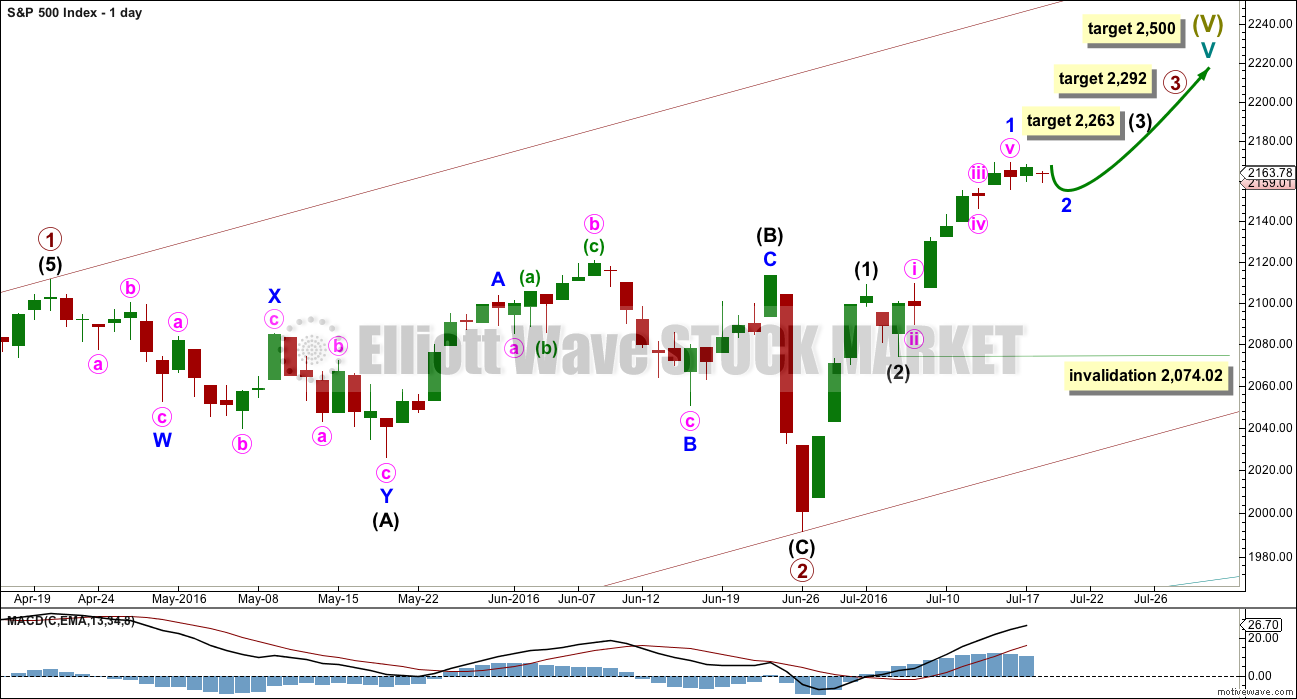
It is possible that primary wave 2 is already complete as a shallow regular flat correction. Primary wave 3 may have begun.
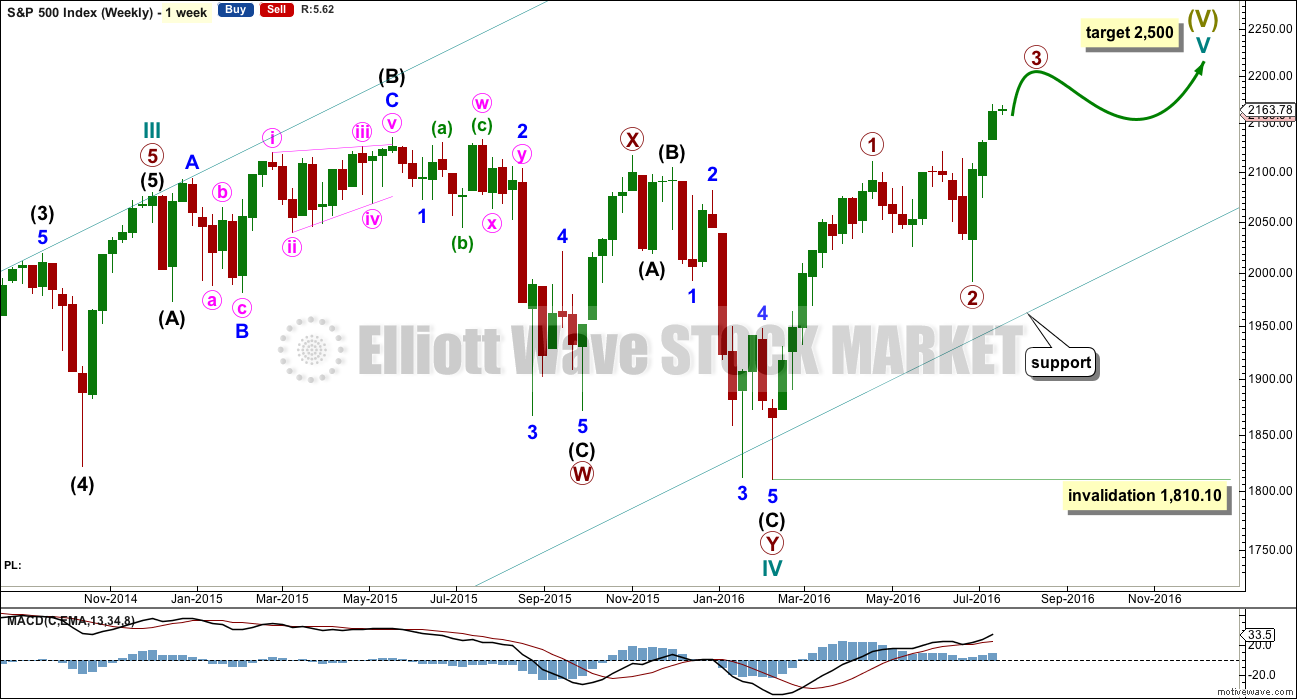
At 2,292 primary wave 3 would reach equality in length with primary wave 1. This is the ratio used for the target in this instance because primary wave 2 was relatively shallow and it fits neatly with the high probability target of 2,500 for cycle wave V to end.
Primary wave 3 may only subdivide as an impulse. So far within it intermediate waves (1) and (2) may be complete.
Within intermediate wave (3), no second wave correction may move beyond its start below 2,074.02.
An impulse upwards looks complete but volume still does not indicate a deeper correction about to begin here. It may be that only minor wave 1 is complete. A small brief correction for minor wave 2 may complete before the strongest part of intermediate wave (3) up unfolds. The alternate hourly wave count below moves the degree of labelling within minor wave 1 all up one degree; it may also be that intermediate wave (3) ended short of the target, at the last high. The current sideways movement may be intermediate wave (4), not minor wave 2.
When intermediate wave (3) is a complete impulse, then intermediate wave (4) may unfold for another short term pullback. The expectation would be for intermediate wave (4) to last only a few days; intermediate wave (2) may have been over in just two. Intermediate wave (4) may not move into intermediate wave (1) price territory below 2,108.71.
At 2,263 intermediate wave (3) would reach 1.618 the length of intermediate wave (1).
A reasonable pullback may not be seen until primary wave 3 is over. When it is complete, then the following correction for primary wave 4 would be most likely a zigzag and must remain above primary wave 1 price territory at 2,111.05.
HOURLY CHART I
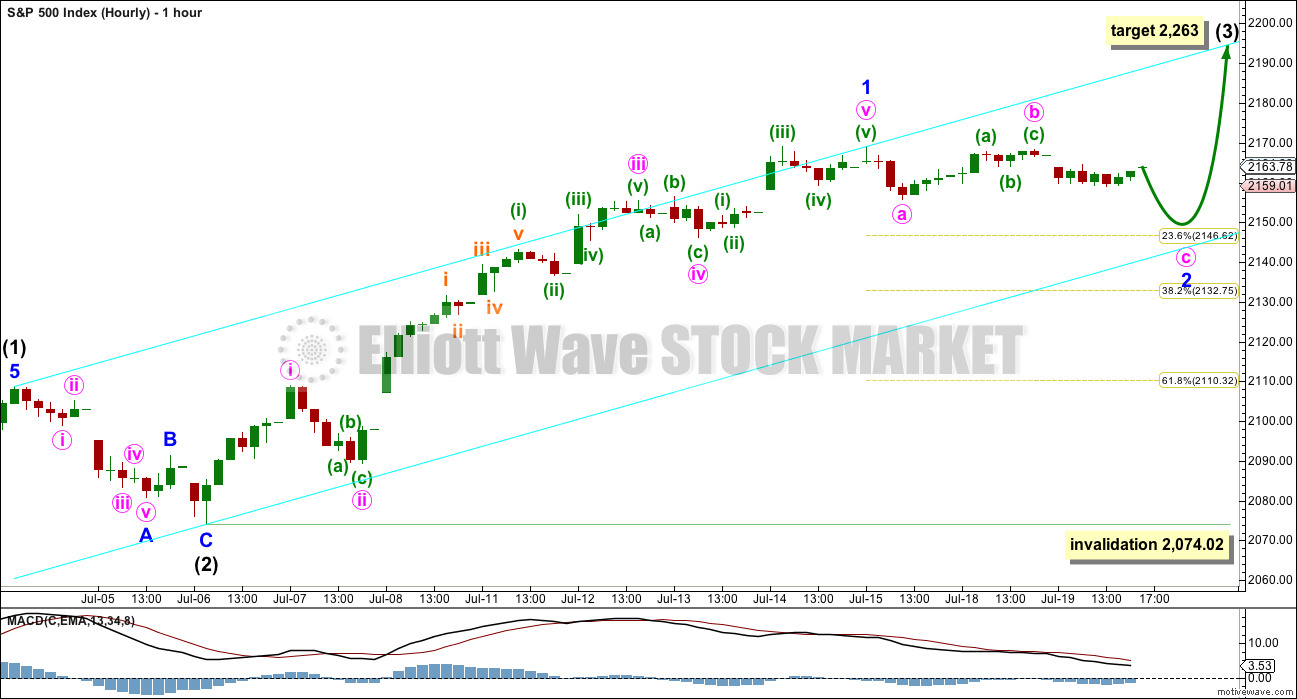
Because so far upwards movement within intermediate wave (3) has not passed equality in length with intermediate wave (1) (that price point would be at 2,191), it should be assumed that it is most likely that intermediate wave (3) is incomplete.
Only minor wave 1 within the impulse of intermediate wave (3) may be complete. Minor wave 2 may end about either the 0.236 or 0.382 Fibonacci ratios of minor wave 1 most likely. This should be the expectation because primary wave 2 and intermediate wave (2) where both relatively shallow, so the pattern may continue.
Minor wave 2 should be brief, over in just two or three days most likely. So far it would be counted as just two daily candlesticks.
At this stage, it looks like a triangle may be unfolding sideways. If this is correct, then it cannot be minor wave 2 in its entirety because a triangle may not be the sole corrective structure for a second wave correction. This reduces the probability of this first hourly wave count and increases the probability of the alternate below today.
When minor wave 2 is complete, then upwards movement should continue with increased momentum and increased volume for the middle of a third wave.
HOURLY CHART I – ALTERNATE
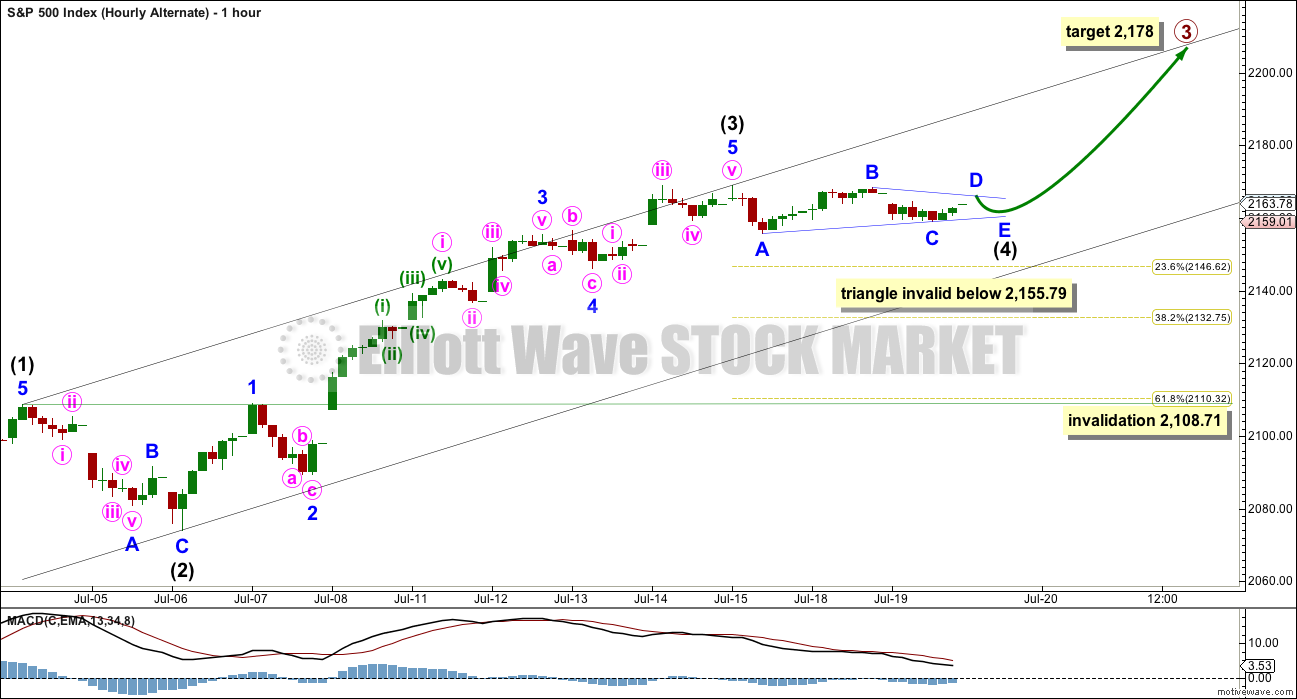
It is possible but slightly less likely that intermediate wave (3) is over. Intermediate wave (4) may have begun on Friday with Friday’s red daily candlestick.
Intermediate wave (4) may be expected to last about two to five days in total, so that it is reasonably in proportion to intermediate wave (2) which lasted two days. Intermediate wave (4) would likely exhibit alternation in structure with the zigzag of intermediate wave (2), so it would most likely be a flat, combination or triangle. All these structures may include a new high above its start. It would most likely be choppy and overlapping.
Intermediate wave (4) may not move into intermediate wave (1) price territory below 2,108.71.
Draw a channel about this upwards movement using Elliott’s technique as shown: the first trend line from the ends of intermediate waves (1) to (3), then a parallel copy on the end of intermediate wave (2). The lower edge may show where price finds some support. This channel is the same on the first two hourly charts today.
It looks like today a triangle is unfolding sideways for intermediate wave (4). So far the triangle may be a regular contracting triangle, the most common type. Minor wave A would be over. Minor wave B would very likely be over. Minor wave C may or may not be over. If it continues lower, it may not move below the end of minor wave A below 2,155.79. The triangle will remain valid as long as price does not move below 2,155.79.
Minor wave D of the triangle may not move above the end of minor wave B at 2,168.35. Finally, minor wave E may not move below the end of minor wave C, which at this stage may be at 2,159.01. Minor wave E would most likely fall short of the A-C trend line. If it does not end there, then the next likely point would be for it to overshoot the A-C trend line.
If price continues sideways in a narrow range, and the triangle remains valid, then the breakout should be upwards. This wave count would then be preferred over the first hourly wave count.
This wave count sees intermediate wave (3) at 95.03 points in length shorter than intermediate wave (1) which was 117.03 points in length. This limits the length of the fifth wave to no longer than equality in length with the third because a third wave may never be the shortest, so that the rule is met. The target on the daily chart for primary wave 3 would be too high.
A more likely target for primary wave 3 for this alternate hourly wave count would be at 2,178 where it would reach 0.618 the length of primary wave 1. This would see primary wave 3 also shorter than primary wave 1, so it Limits the length of primary wave 5. The final target at 2,500 would also be too high.
If this alternate wave count unfolds as expected and this triangle remains valid, then the implications are very important. It could see the bull market over more quickly than initially expected and targets too high with price falling well short of 2,500.
DAILY CHART II
This wave count still has a reasonable probability.
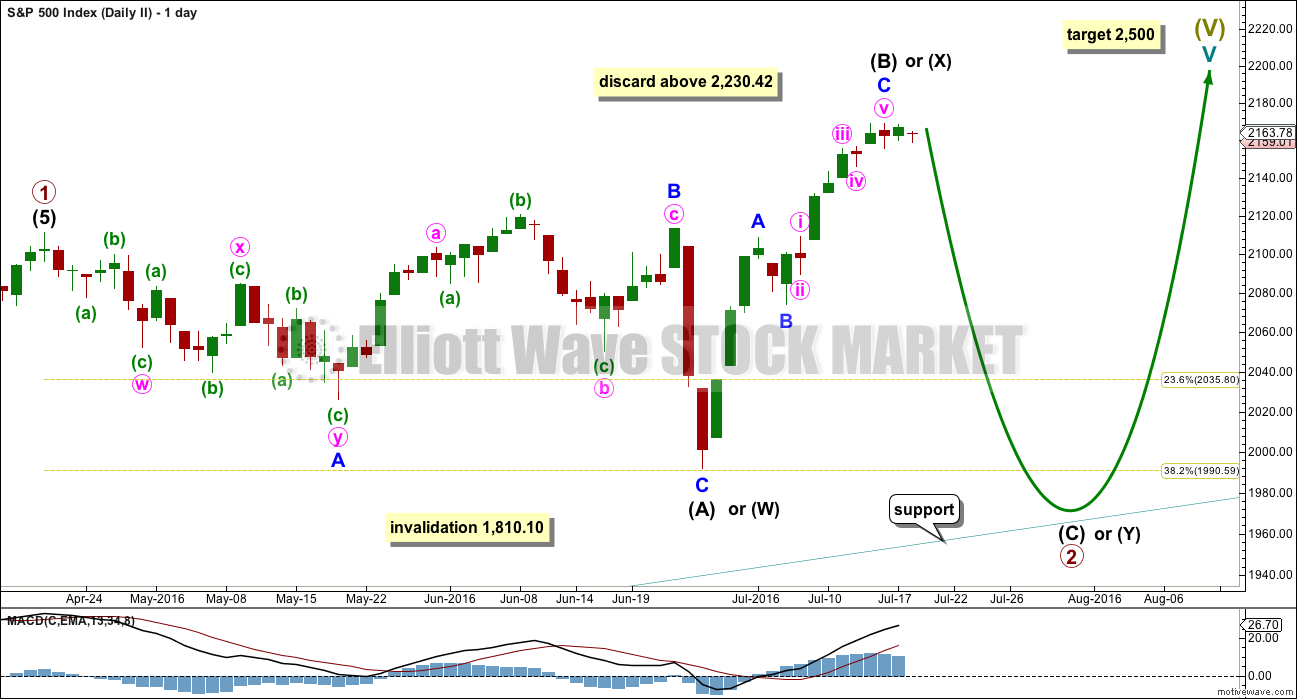
The common length for intermediate wave (B) is from 1 to 1.38 the length of intermediate wave (A), giving a range from 2,111.05 to 2,156.41. At the last high intermediate wave (B) is now 1.49 the length of intermediate wave (A), longer than the common range but not yet at the maximum convention of 2.
The idea of a flat correction should be discarded when intermediate wave (B) exceeds twice the length of intermediate wave (A) above 2,230.42.
When intermediate wave (B) is complete, then a target may be calculated for intermediate wave (C) downwards. It would most likely end at least slightly below the end of intermediate wave (A) at 1,991.68 to avoid a truncation and a very rare running flat. It may end when price comes down to touch the lower edge of the channel copied over from the monthly chart.
Primary wave 2 may also be relabelled as a combination. The first structure in a double combination may be a complete regular flat labelled intermediate wave (W). The double would be joined by an almost complete zigzag in the opposite direction labelled intermediate wave (X). The second structure in the double may be a flat (for a double flat) or a zigzag to complete a double combination. It would be expected to end about the same level as the first structure in the double at 1,991.68, so that the whole structure moves sideways.
An expanded flat for primary wave 2 is more likely than a double combination because these are more common structures for second waves.
HOURLY CHART II
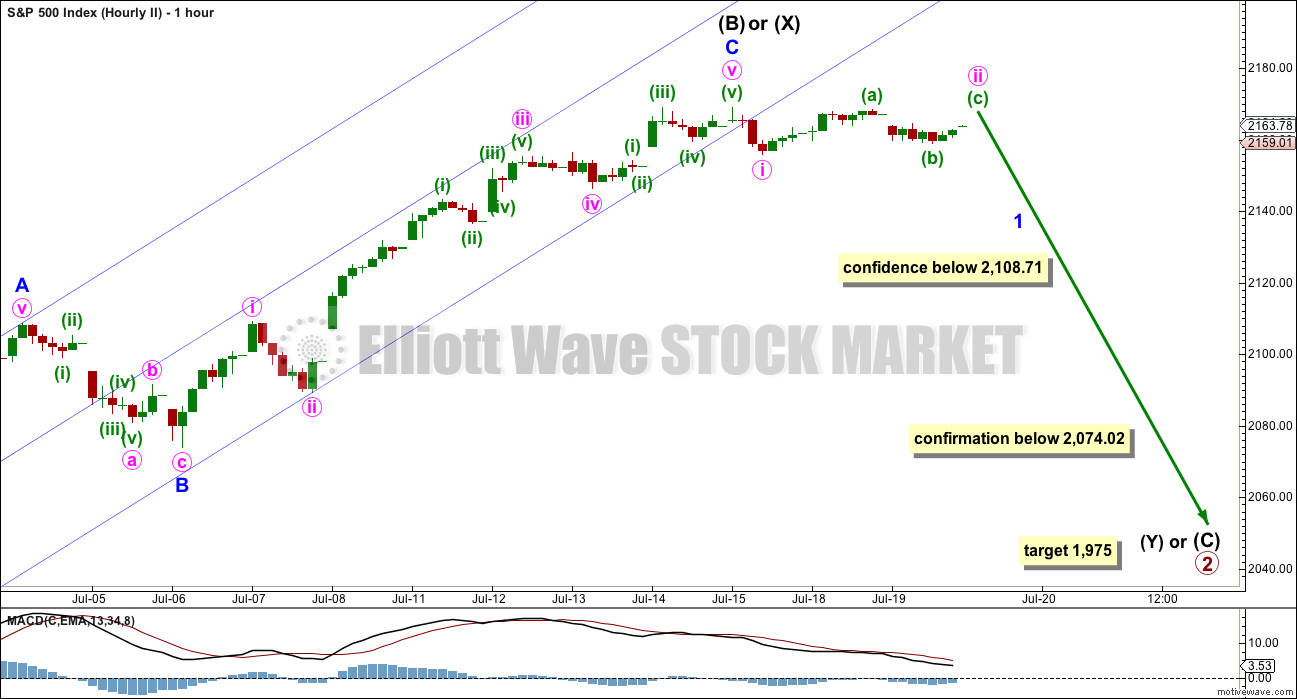
The upwards zigzag of intermediate wave (B) or (X) may again be over.
At 1,975 intermediate wave (C) would reach 1.618 the length of intermediate wave (A). This is the most common ratio for a C wave of an expanded flat, so it has a reasonable probability.
At this stage, no upper invalidation point is added to the hourly chart. It is possible still that minute wave iv within minor wave C of intermediate wave (B) or (X) is moving sideways. Only if price reaches above 2,230.42 may this idea be discarded.
If price does move higher short term, then the probability of this idea would again reduce.
BEAR WAVE COUNT – WEEKLY CHART
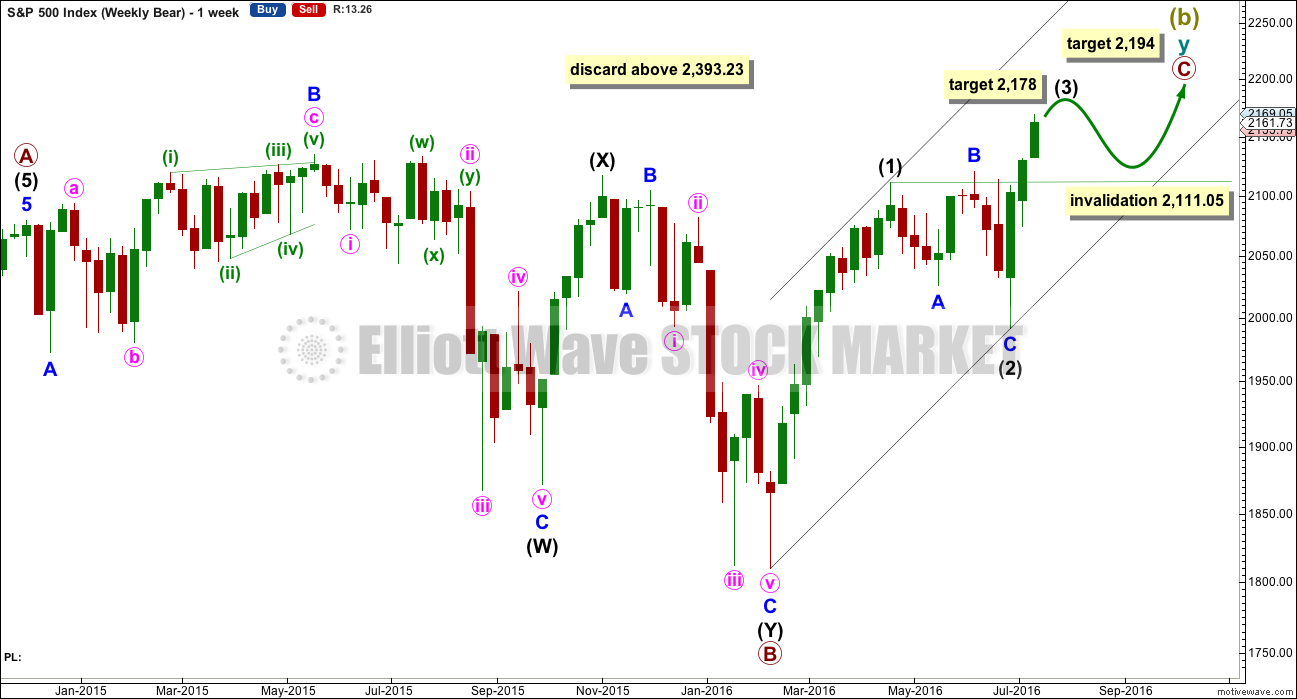
It would still be possible that a Super Cycle trend change is close if Super Cycle wave (b) (or (x) ) is subdividing as a double zigzag.
However, the expected direction and structure is now the same short and mid term for this idea as it is for the main wave count.
Within the second zigzag of cycle wave y, primary wave C must complete as a five wave structure.
So far Super Cycle wave (b) is 1.72 the length of Super Cycle wave (a). This is comfortably longer than the normal range which is up to 1.38, but still within the allowable convention of up to 2 times the length of wave A.
Above 2,393.23 Super Cycle wave (b) would be more than twice the length of Super Cycle wave (a). Above this price point the convention states that the probability of a flat correction unfolding is too low for reasonable consideration. Above that point this bear wave count should be discarded. The same principle is applied to the idea of a double combination for Grand Super Cycle wave II
A five wave structure upwards would still need to complete for primary wave C. So far upwards movement is a very strong three wave looking structure. Trying to see this as either a complete or almost complete five would be trying to fit in what one may want to see to the waves, ignoring what is actually there.
At 2,178 intermediate wave (3) would reach 0.618 the length of intermediate wave (1).
Thereafter, intermediate wave (4) may move sideways for a few weeks as a very shallow correction. Thereafter, intermediate wave (5) would most likely make a new high. At 2,194 primary wave C would reach 0.382 the length of primary wave A. This final target is close to the round number of 2,200 and so offers a reasonable probability.
If price reaches 2,200 or close to it, then this idea would again be assessed, and an attempt made to determine its probability. The situation between now and then though may change.
The important conclusion is more upwards movement is extremely likely, as a five up is needed to complete.
TECHNICAL ANALYSIS
WEEKLY CHART
Click chart to enlarge. Chart courtesy of StockCharts.com.
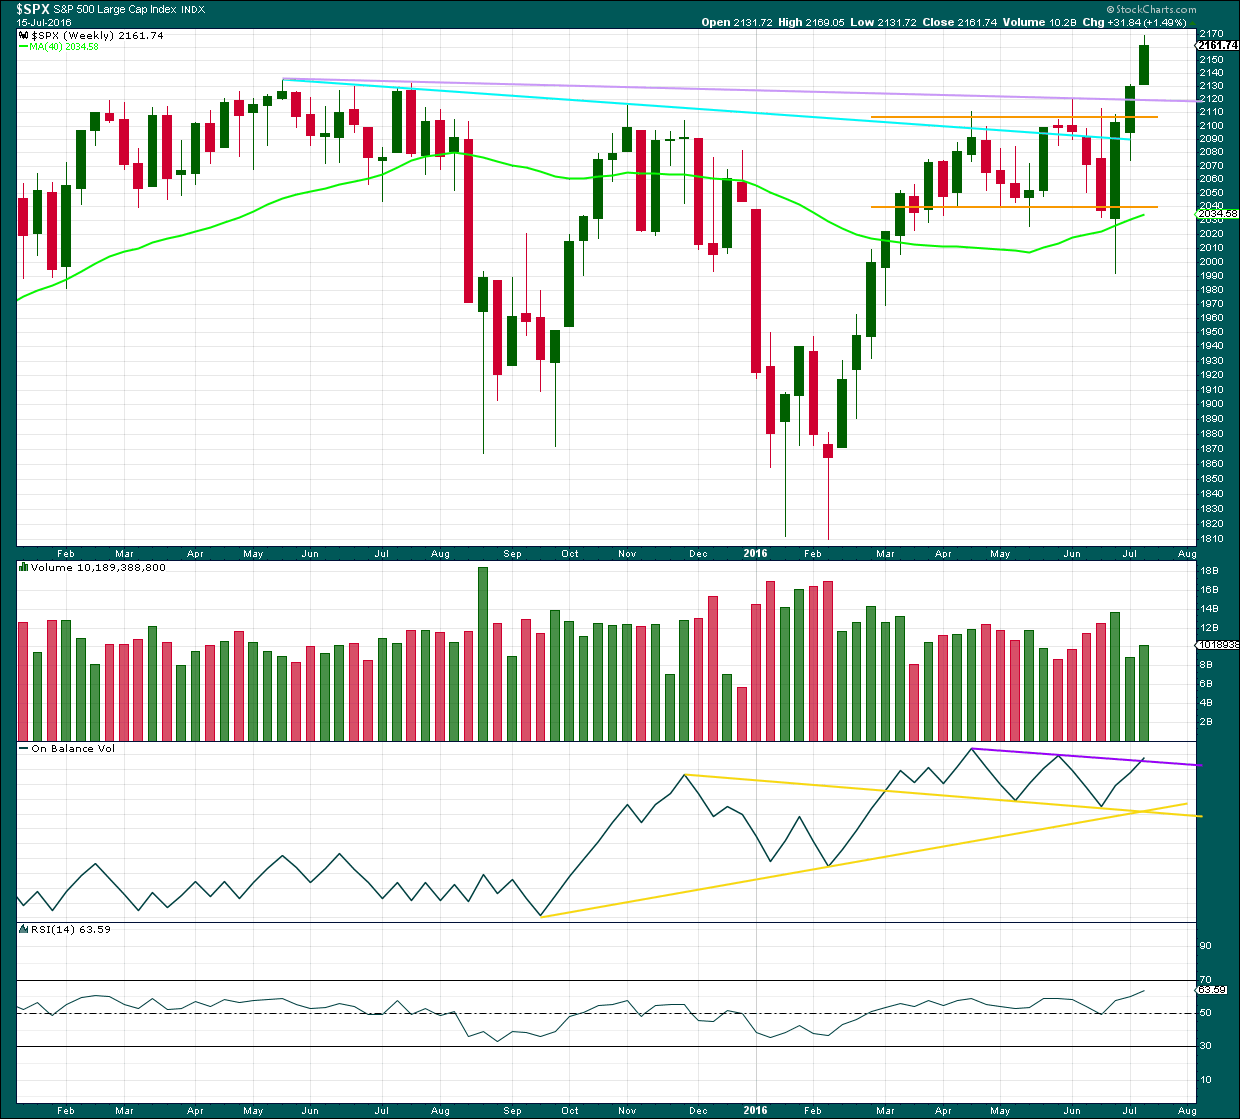
At the end of last week, price has very clearly broken out of the prior consolidation upwards. This applies not only to the small consolidation on the weekly chart shown by yellow support and resistance lines, but also to the larger multi month consolidation that was shown in prior weekly charts and which had the upper resistance line at the prior all time high of 2,134.
Volume last week is higher than the week prior. There is some support from volume for the rise in price although the first upwards week still has strongest volume.
From the last swing low, there is now a bullish engulfing candlestick pattern followed by three advancing white soldiers pattern. Both patterns are bullish.
DAILY CHART
Click chart to enlarge. Chart courtesy of StockCharts.com.
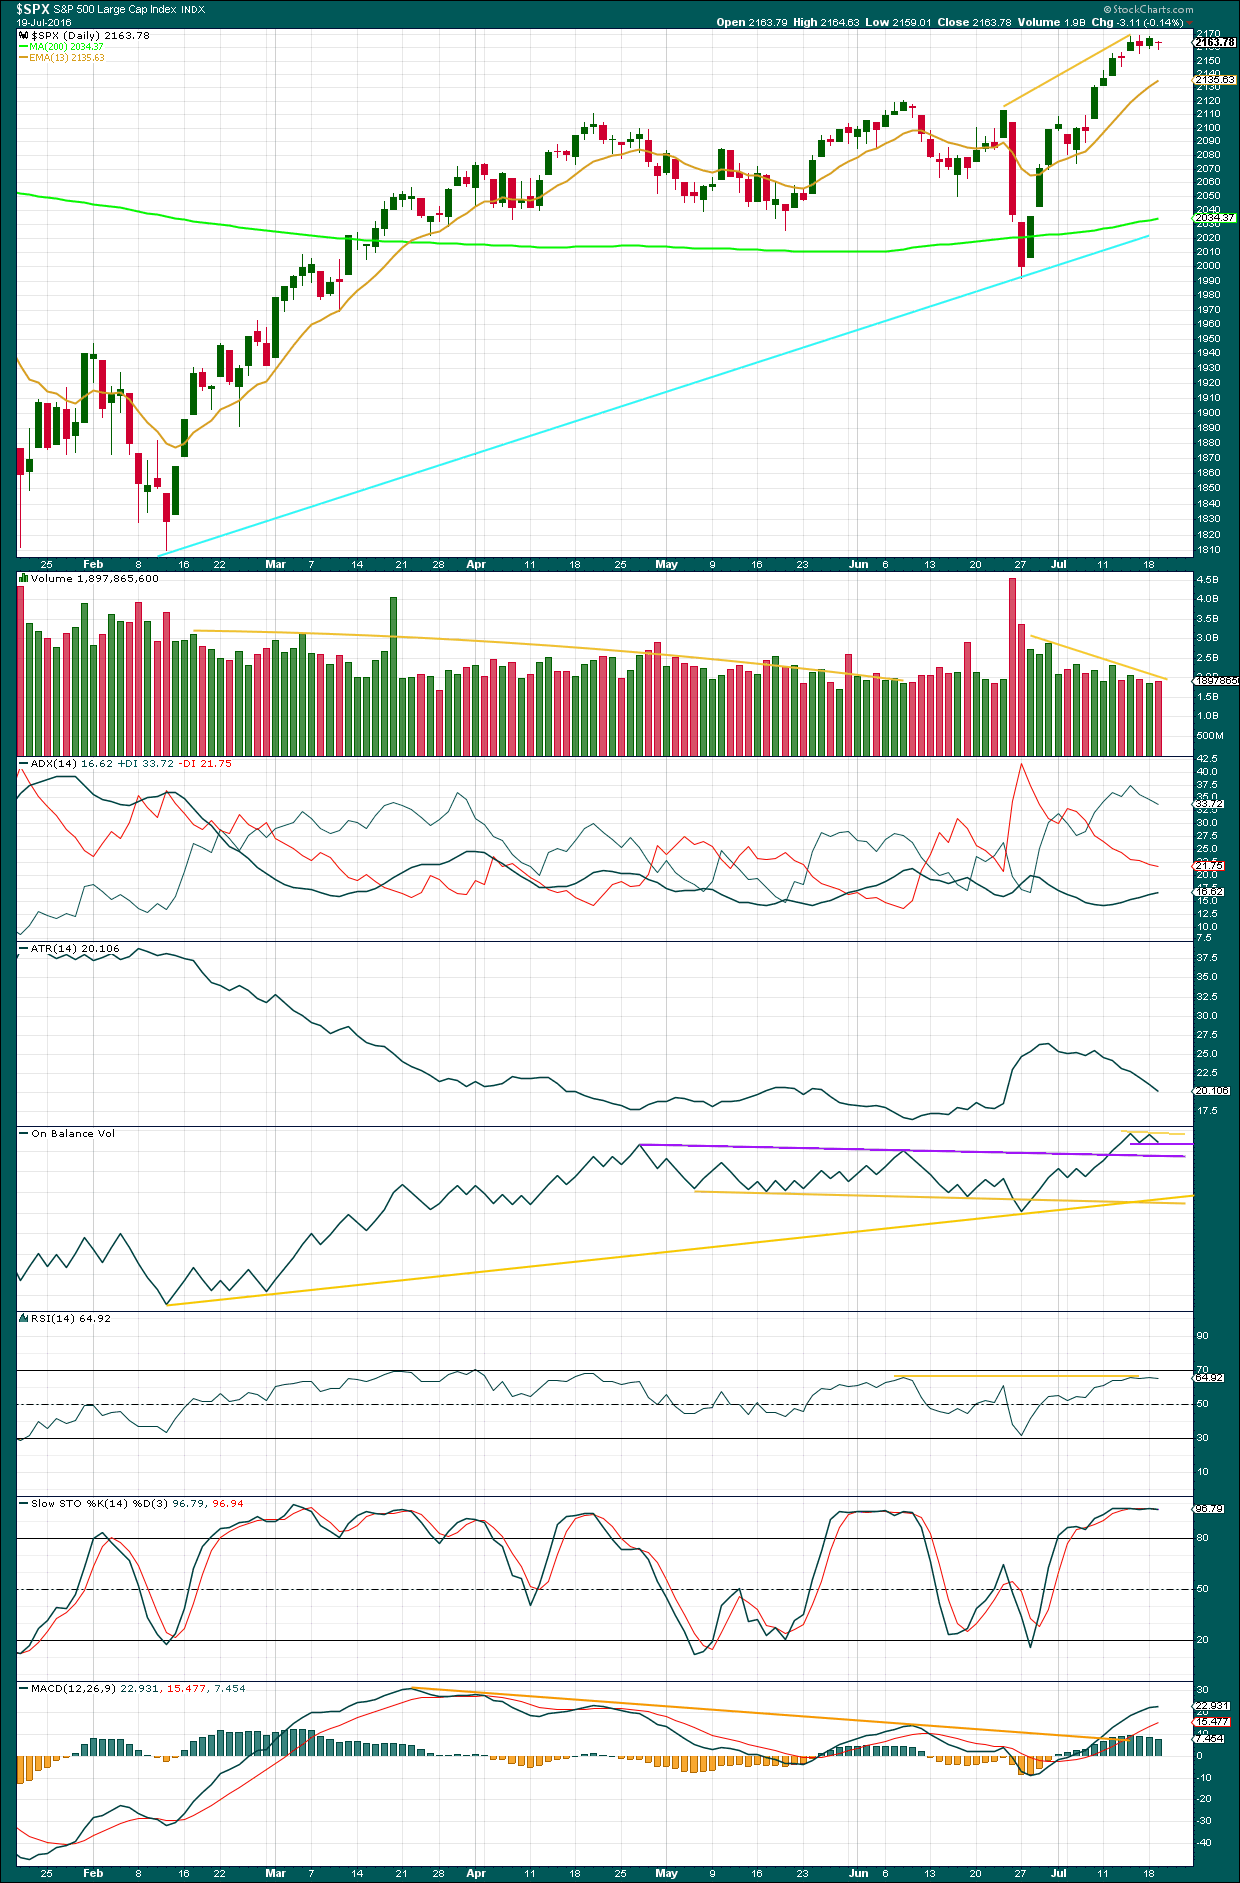
Overall, volume is falling as price rises. The volume profile mid term is still bearish.
In the short term, the small upwards day for Monday comes with lighter volume than the prior downwards day. This short term volume profile is now bearish. The rise in price for Monday had little support from volume, so price may fall a little of its own weight here. Now Tuesday prints a small red doji with volume slightly higher than Monday’s green candlestick. However, volume is still very light and falling. Volume for Tuesday is the second lightest day since this upwards wave began back on 28th of June.
The short term volume profile may be considered bearish, but only very slightly. This is not enough to support the second wave count over the first. The first wave count is still preferred.
There may not be enough selling pressure for the second wave count, which expects a bigger drop. When price is falling it is not falling with strong volume (with the exception of Brexit). Some greater support from sellers may be required for a deeper pullback here. At this stage, no evidence of selling pressure is seen.
ADX is increasing and above 15 indicating a new upwards trend is in place. ATR is still very clearly declining. This is not normal for a trending market and indicates some weakness.
On Balance Volume today moved downwards with price. There is a little room for OBV to move lower before it finds support. If OBV comes down to touch the lower purple trend line, that may show when price stops downwards movement as the purple line offers support.
Two new very short term lines are added to OBV today. A break below the short purple line would be bearish. A break above the short yellow line would be bullish. These lines offer weak signals only. But if a break by OBV precedes a breakout from price, then it should indicate the direction for a breakout by price.
There is still negative bearish divergence between price and RSI. This new upwards trend is lacking in strength.
There is still negative bearish divergence between price and MACD. This new upwards trend is lacking in momentum.
There is again something wrong with this trend, so it should be expected eventually to be more than fully retraced. Each day the bulls are able to push price up by a smaller and smaller amount. This trend is tired and weak.
However, looking back at the larger picture price was able to rise in light and declining volume for many months up to the last all time high. Weakness indicates the movement is likely to be more than fully retraced, but weakness can persist for reasonable periods of time before the market changes from bull to bear. This persistent weakness indicates some caution, targets may be too high and optimistic.
VOLATILITY – INVERTED VIX MONTHLY CHART
Click chart to enlarge. Chart courtesy of StockCharts.com.
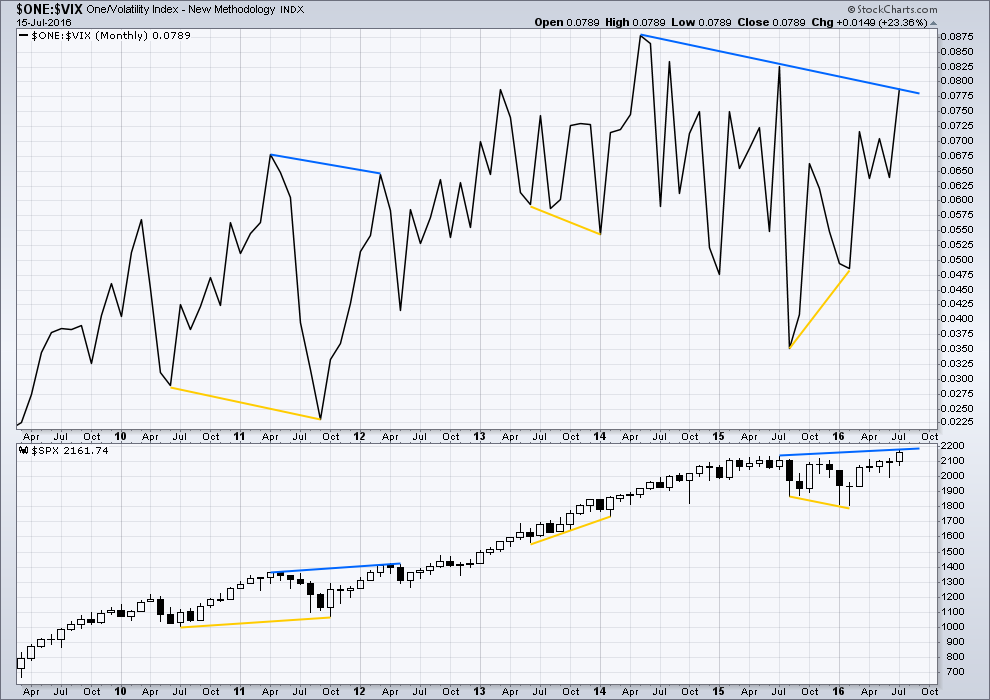
VIX from StockCharts is inverted. As price moves higher, inverted VIX should also move higher indicating a decline in volatility which is normal as price moves higher. As price moves lower, inverted VIX should also move lower indicating an increase in volatility which is normal with falling price.
There is still strong multi month divergence with price and VIX. While price has moved to new all time highs, this has not come with a corresponding decline in volatility below the prior all time high at 2,134. This strong multi month divergence between price and VIX indicates that this rise in price is weak and is highly likely to be more than fully retraced. However, this does not tell us when and where price must turn; it is a warning only and can often be a rather early warning.
At this time, although divergence with price and VIX at the daily chart level has been recently proven to be unreliable (and so at this time will no longer be considered), I will continue to assume that divergence with price and VIX at the monthly chart level over longer time periods remains reliable until proven otherwise.
This supports the idea that price may be in a fifth wave up. Divergence between the end of a cycle degree wave III and a cycle degree wave V would be reasonable to see. Fifth waves are weaker than third waves. This strong divergence indicates that price targets may be too high and time expectations may be too long. However, it remains to be seen if this divergence will be reliable.
DOW THEORY
Major lows within the prior bull market:
DJIA: 15,855.12 (15th October, 2014) – closed below on 25th August, 2015.
DJT: 7,700.49 (12th October, 2014) – closed below on 24th August, 2015.
S&P500: 1,821.61 (15th October, 2014) – has not closed below this point yet.
Nasdaq: 4,117.84 (15th October, 2014) – has not closed below this point yet.
Major highs within the new bear market:
DJIA: 17,977.85 (4th November, 2015) – closed above on 18th April, 2016.
DJT: 8,358.20 (20th November, 2015) – has not closed above this point yet.
S&P500: 2,116.48 (3rd Nobember, 2015) – has now closed above this point on 8th June, 2016.
Nasdaq: 5,176.77 (2nd December, 2015) – has not closed above this point yet.
Dow Theory Conclusion: Original Dow Theory still sees price in a bear market because the transportations have failed to confirm an end to that bear market. Modified Dow Theory (adding S&P and Nasdaq) has failed still to confirm an end to the old bull market, modified Dow Theory sees price still in a bull market.
This analysis is published @ 06:06 p.m. EST.

Lara …..my portfolio is net long equity but the equity is pretty haven in defensive yield plays. I do have some FB, GE, LMT, MMM and other cyclicality but most of it is telecom utilities tobacco etc…….I also have a ton of long municipals and TLTand some Gold …..the yielders and bonds have done great but I have big positions in SH and PSQ……they are huge drags on the account and I have reduced them after we broke out but I’m scared to remove the protection. The one scenRio that kills me is all times as go to the crapper and growth mid cap tech etc go parabolic where most of my equity goes down bonds go down and hedges down (like today). My question is your thoughts on removing the hedges temporarily and putting them in higher. I feel like the second I do the market makes me it’s b —-ch I know you have aggressive words for people who have shorts but I’m not net short overall (just certain days depending on the action I am). What’s my question? Lol what’s the probability that 2178 area is 5 of 3 and the 2200 area is the end of this?? Just curious as to your current thoughts and also what would begin to invalidate the top being around the 2200 level. Some other people I follow are looking at 3 around today’s high and for V to complete not to much higher than today (with a small pullback between the 3 and 5).
Thanks
John, I will give your question some more careful thought before I reply. That may be later today.
Could you please email me? admin@elliottwavestockmarket.com
I’ll reply later today (my time).
Thank you.
According to Stock Traders Almanac, today should have been the high close of the month. I was just about to try and find a top and go short when it suddenly hit me, ” Hey, Stupid! Don’t be Stupid, Stupid”. I’m not fast enough nor experienced enough to go short in the middle of a likely 3rd wave up.
Very wise words.
P/C in IWM is very high…highly in favor of bears. It has been in neutral for the last couple days. I will post the Open Interest change shortly
sorry got distracted with kiddo….
Here is the SPY PC numbers….very very neutral territory
I just got short the es at 2168.50 with a very…very tight stop. looking for a sell off into the close as this bull(sh*t) move is long over due for a good correction.
Thank goodness you’re using a stop.
I would not recommend going short here though. We have zero evidence of a trend change.
Yes, this market is overcooked. Yes, it is internally very weak. But to date it has proven that it can remain extreme and overbought and very weak while it continues to drift ever higher.
You are trying to pick a high, and that often does not end well.
Now, as long as you’re managing risk then it can’t end too badly.
And to date Quang Vo you seem to have a fair idea of what you’re doing, so this comment is mostly aimed at less experienced members.
Do not follow this trade and go short here. We have zero evidence of a trend change, price may still drift higher before it turns.
There will be a pullback, but at this stage there is no evidence it has begun now. Volume is higher for a fairly good upwards day today.
The trend is currently up. Don’t trade against the trend.
Thnaks Lara. Im personally waiting for the earnings to pass before entering this market (on either side). I just don’t know when the shoe will drop and wake up with a nasty down day. I will wait wait wait for that pullback b4 contemplating a long/short.
Me too. I don’t trust it.
If I hadn’t been shell shocked when it made a new ATH then I should have entered long there. But I didn’t. I’m out, on the sidelines.
When I see a decent pullback then I’ll enter long. But I don’t think it’s on it’s way any time soon.
We have another upwards day with increased volume. Short term, volume is still bullish.
But I know that because this upwards move is so very weak we could see a huge downwards day at any stage. Which is why I’m not happy to enter long right now.
I always trade with a stop. Money management is the most important thing in trading. It’s the only thing you can control in trading…how much you risk.
I need help im in short since lara enter us to short i wait for correction to close them
but the correction not arive and each day i think that it will begin the s&p go high more and more when is the time to close??? the news that the centarl bank buy confuse me
this chart s&p 4 h
please somone help me??????????????????
I’d be out right now
I still have a short position too . I exited some . But still have a good portion of the short position . It was just too much of a loss, too quick . ….. I did and still have a hedge on my short . My short is actually short shares of the SPY in my account . I have hedged with a long in the money SPY call options . All I can do is hope to get some timing correct to exit . I see the 5 touches on the expanding triangle – and would love to see a move down also . Investor sentiment just so lopsided . All the hedge funds and shorts now covering on every dip .
I have always advised very strongly to trade with stops ALWAYS.
To never invest more than 3-5% of equity in any one trade.
The final place for a stop for shorts should have been the last ATH at 2,134. I pointed this out to you a very few days after that was breached. No one should have been short after that point.
I cannot help you if you do not take my most often repeated and basic advice to manage risk and use stops.
2134 – is where I balanced the short position with a long position . So instead of stopped out of short . I have both a short and long in the account . basically neutral . Not sure about izak .
I have encountered folks with this problem before, and in my experience to date it never ends well. I did it myself some years ago and lost all the money in my trading account.
A position is entered based on your own or someone else’s analysis. No stop is set. No thinking is given to “what would the market have to do to prove me wrong, where should I close my position”.
The market moves against the position, but the position is held. Now underwater, and getting worse each day.
Panic sets in. Fear overwhelms.
I have learned this lesson the hard way and paid thousands of dollars to learn it.
ALWAYS USE A STOP LOSS.
I have given this advice over and over and over again.
If any members are holding short positions now which were opened prior to 2,134, prior to full and final invalidation of the bear wave count, then you are holding those positions against my clear and repeated advice.
I cannot make the market pull back to give you a good exit point.
Be very clear Izak: you are holding a short position today AGAINST my very clear advice. If you had followed my advice you would have taken a much smaller loss, only up to 5% of your equity. You would now either be long or out.
Whatever happens with the short positions that members are holding against my advice, be very clear, the responsibility of your huge losses simply cannot be laid at my door. Do not do that.
Finally, do not come onto this forum again Izak and cry for help. Your first message asking for help was 12th July. My reply to you on that date was no one should be holding shorts. Clearly you ignored that advice too, you’re still holding your short six trading days later.
You are not listening nor taking my advice. I simply cannot help you.
Now, this comment may be seen as harsh. But I also know that it will not be as harsh as the loss on your account which has no limit because you refuse to close a losing position.
I am considering very seriously removing those from this membership who have disregarded this most basic advice. I do not think it will end well at all 🙁
Anyone know why the VIX jumped?
VIX
Contract Rolled
I do not see that spike on any of my data feeds.
Interesting, mine was from Finviz Futures…
Even bankster pumped markets must retrace. Buying July 29 SPY 215 strike puts at 0.62 per contract. Even a mild pullback should see a quick double in these contracts. Hard stop-loss with any SPY close above 218.00
Markets putting top as expected closer to 22 July so ext couple of days will be interesting
Edit: Next couple of days not ext couple of days. 2,177 is the target and will evaluate how market react at that level
guys, it hard to think this market will top before the FANG (facebook, apple, netflix and google) earnings are out. I would wait till mid of next week before shorting anything IMHO
FANG is broken as Netflix is reaching a plateau with current offerings. Google has been stagnating in this zone for a while AMZN is scary and can drop 100 points unable no of the eye.
Vern,
I am sitting at 216.50 with a small position to test the waters nothing significant.
Wave up not done yet. I am expecting to add to my position if we see an intra-day reversal and close back under SPY 218.00 tomorrow. Have a great evening all!
Ferocious non stop bidding. You normally see this kind of buying after a market has been a prolonged selling phase…..NOT after a 175 point run in the SP!
D*MN Banksters, why won’t you give us a decent pull back? What are you so afraid of?
Lara, I was looking through the archives and I saw that after the 2015 high’s, the bullish wave count was the preferred count. Do you remember what happened that made the Bear count the perferred count?
I remember two items – RSI swing failure. Close of 3% below long term bull market trend line, not necessarily in that order…
Thank you Verne.
What he said Rudy.
“the trend remains the same, until proven otherwise”
I used the bull market trend line. When it was breached, I assumed it proved a trend change.
What I got wrong was the bear market was a huge year long sideways mess, not a strong sustained downwards move.
Now a bear market trend line has been breached to the upside, indicating a trend change.
These lines I’m using from Magee, “Technical Analysis of Stock Trends”
I am Finished… Toast… Done… Out!!!!
See ya all!
What happened?
If UUP closes above 25 today, take a look at August 1 25 strike calls (up to 0.25 per contract) to recover some of your losses….should be at least a double….
Price action the last several days confirming what we all suspected; and that is this strong move up due almost entirely to aggressive central bank buying. Without it, the market goes nowhere, and sentiment suggests that all the bulls are already on board with sideways action looking a lot like a fourth wave. Cashed in a few upside calls yesterday. Last remaining hedge is a bullish SPY 210/207 put spread and will hold contracts for a reversal. Scaling back into short positions. I think we have one more wave up.
I lean towards the alternate count.
Just curious if you have any data for the banks buying or is it more a hunch. ?
The Japanese Central Bank has actually admitted it. None of the others have.
https://realinvestmentadvice.com/3-things-cbs-all-in-japan-bond-bull/
Really good article.
“A pullback to 2135, the previous all-time high, that holds that level will allow for an increase in equity allocations to the new targets.
A pullback that breaks 2135 will keep equity allocation increases on “HOLD” until support has been tested.
A pullback that breaks 2080 will trigger “stop losses” in portfolios and confirm the recent breakout was a short-term “head fake.””
http://www.zerohedge.com/news/2016-07-19/elevator-down-looms-market-reaches-3-standard-deviation-extreme
Thanks Jim….good article…quick and to the point
IMHO, the 2135 area of the ATH is not the important price point to watch. It is 2100.
If a top is in, there will be no bounce in that area- the market will slice right through it….any hesitation there and the bulls remain in charge…
1st 2 days in a row!!