Analysis yesterday again expected more upwards movement. While that is how the session began in the first hour, thereafter price fell to complete a small red daily candlestick.
Summary: In the very short term, a small pullback to about 2,147 or 2,133 is expected. If this expectation is wrong, it will be in that these targets are too low. The short pullback should also be brief; it may be over during Monday’s session as the earliest expectation, and a very few days at most. Thereafter, the upwards trend should resume.
Last monthly chart for the main wave count is here.
New updates to this analysis are in bold.
WEEKLY CHART
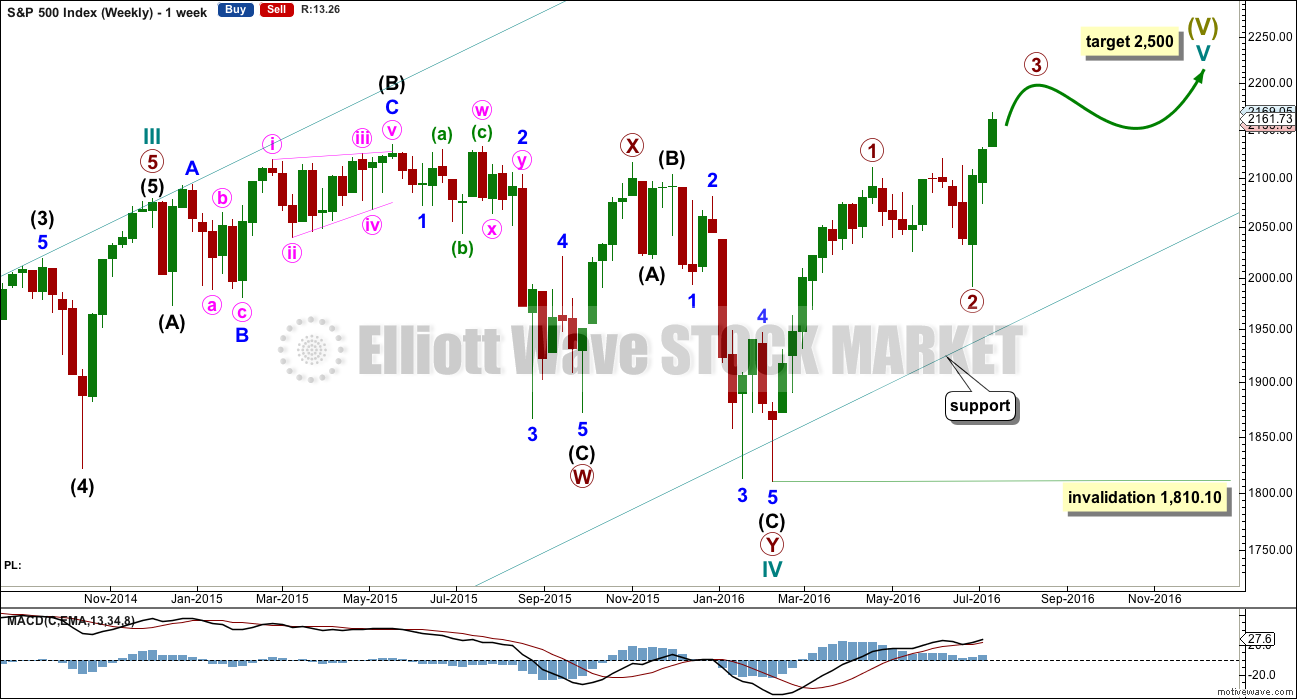
Cycle wave II was a shallow 0.41 zigzag lasting three months. Cycle wave IV is now seen as a more shallow 0.28 double combination lasting 14 months. With cycle wave IV nearly five times the duration of cycle wave II, it should be over there.
After some consideration I will place the final invalidation point for this bull wave count at 1,810.10. A new low below that point at this time would be a very strong indication of a trend change at Super Cycle degree, from bull to bear. This is because were cycle wave IV to continue further sideways it would be grossly disproportionate to cycle wave I and would end substantially outside of the wide teal channel copied over here from the monthly chart.
Cycle wave I lasted 28 months (not a Fibonacci number), cycle wave II lasted a Fibonacci 3 months, cycle wave III lasted 38 months (not a Fibonacci number), and cycle wave IV lasted 14 months (one more than a Fibonacci 13).
If the target for cycle wave V is for it to be equal in length with cycle wave I, then it may also be expected to be about equal in duration. So far cycle wave V is in its fifth month. After this month, a further 23 months to total 28 seems a reasonable expectation, or possibly a further 16 months to total a Fibonacci 21.
Wave count I should be preferred while price remains above 2,074.02. If price moves below 2,074.02, then wave count II would be confirmed.
DAILY CHART I
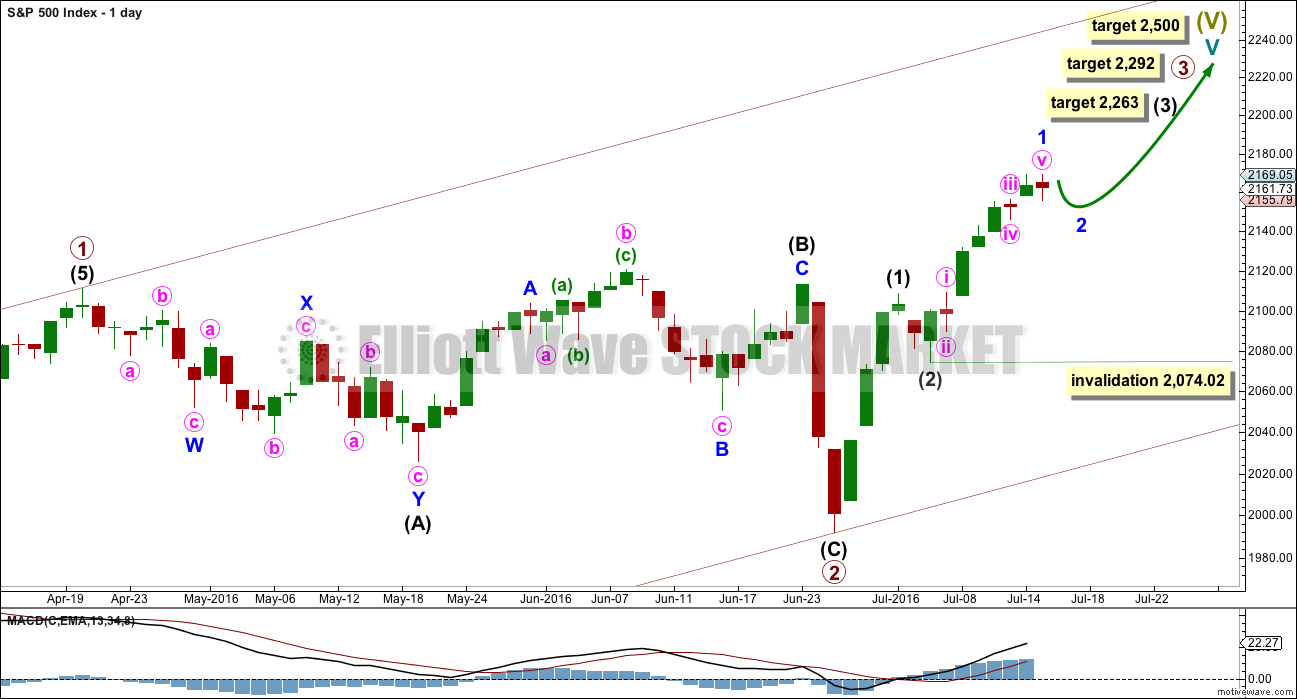
It is possible that primary wave 2 is already complete as a shallow regular flat correction. Primary wave 3 may have begun.
At 2,292 primary wave 3 would reach equality in length with primary wave 1. This is the ratio used for the target in this instance because primary wave 2 was relatively shallow and it fits neatly with the high probability target of 2,500 for cycle wave V to end.
Primary wave 3 may only subdivide as an impulse. So far within it intermediate waves (1) and (2) may be complete.
Within intermediate wave (3), no second wave correction may move beyond its start below 2,074.02.
At the end of this week, the degree of labelling within intermediate wave (3) is moved down one degree. An impulse upwards looks complete but volume does not indicate a deeper correction about to begin here. It may be that only minor wave 1 is complete. A small brief correction for minor wave 2 may complete before the strongest part of intermediate wave (3) up unfolds.
When intermediate wave (3) is a complete impulse, then intermediate wave (4) may unfold for another short term pullback. The expectation would be for intermediate wave (4) to last only a few days; intermediate wave (2) may have been over in just two. Intermediate wave (4) may not move into intermediate wave (1) price territory below 2,108.71.
At 2,263 intermediate wave (3) would reach 1.618 the length of intermediate wave (1).
A reasonable pullback may not be seen until primary wave 3 is over. When it is complete, then the following correction for primary wave 4 would be most likely a zigzag and must remain above primary wave 1 price territory at 2,111.05.
HOURLY CHART I
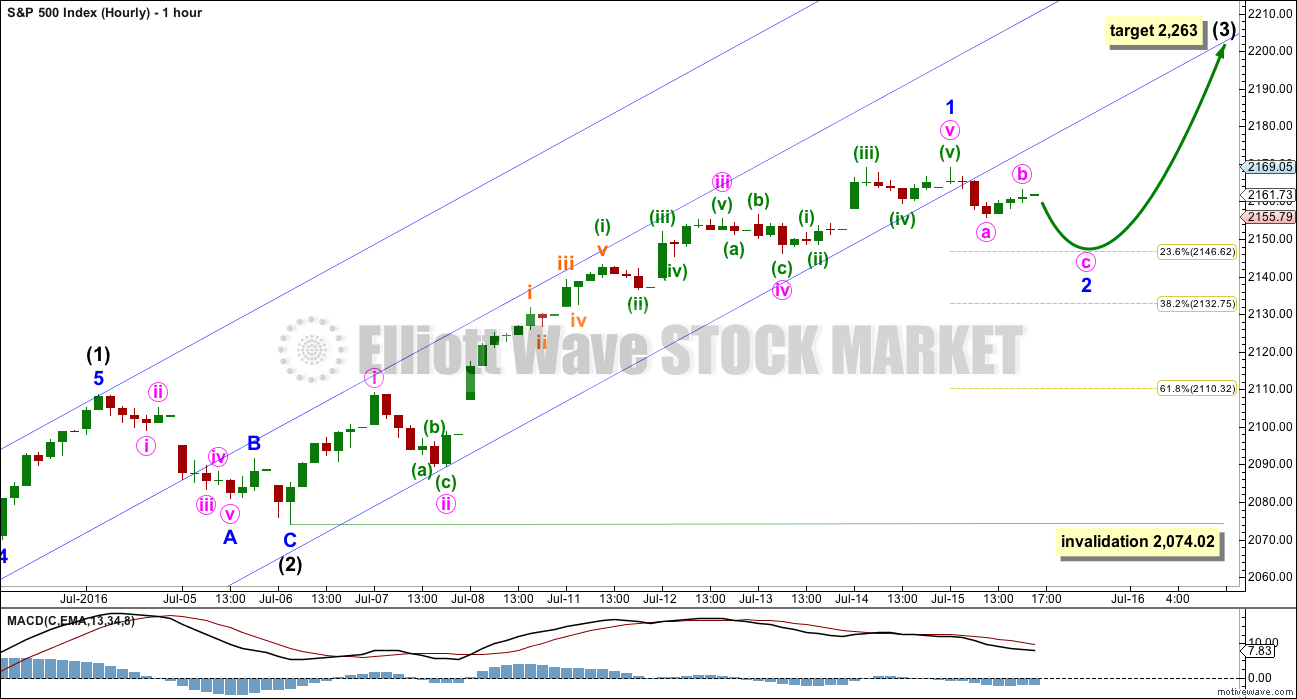
Volume at the end of this week does not yet indicate intermediate wave (3) is over.
Because so far upwards movement within intermediate wave (3) has not passed equality in length with intermediate wave (1) (that price point would be at 2,191), it should be assumed that it is most likely that intermediate wave (3) is incomplete.
Only minor wave 1 within the impulse of intermediate wave (3) may be complete. Minor wave 2 may end about either the 0.236 or 0.382 Fibonacci ratios of minor wave 1 most likely. This should be the expectation because primary wave 2 and intermediate wave (2) where both relatively shallow, so the pattern may continue.
Minor wave 2 should be brief, over in just two or three days most likely.
When minor wave 2 is complete, then upwards movement should continue with increased momentum and increased volume for the middle of a third wave.
HOURLY CHART I – ALTERNATE
It is possible but slightly less likely that intermediate wave (3) is over. Intermediate wave (4) may have begun on Friday with Friday’s red daily candlestick.
Intermediate wave (4) may be expected to last about two to five days in total, so that it is reasonably in proportion to intermediate wave (2) which lasted two days. Intermediate wave (4) would likely exhibit alternation in structure with the zigzag of intermediate wave (2), so it would most likely be a flat, combination or triangle. All these structures may include a new high above its start. It would most likely be choppy and overlapping.
Intermediate wave (4) may not move into intermediate wave (1) price territory below 2,108.71.
DAILY CHART II
This wave count still has a reasonable probability.
The common length for intermediate wave (B) is from 1 to 1.38 the length of intermediate wave (A), giving a range from 2,111.05 to 2,156.41. At today’s high intermediate wave (B) is now 1.48 the length of intermediate wave (A), longer than the common range but not yet at the maximum convention of 2.
The idea of a flat correction should be discarded when intermediate wave (B) exceeds twice the length of intermediate wave (A) above 2,230.42.
When intermediate wave (B) is complete, then a target may be calculated for intermediate wave (C) downwards. It would most likely end at least slightly below the end of intermediate wave (A) at 1,991.68 to avoid a truncation and a very rare running flat. It may end when price comes down to touch the lower edge of the channel copied over from the monthly chart.
Primary wave 2 may also be relabelled as a combination. The first structure in a double combination may be a complete regular flat labelled intermediate wave (W). The double would be joined by an almost complete zigzag in the opposite direction labelled intermediate wave (X). The second structure in the double may be a flat (for a double flat) or a zigzag to complete a double combination. It would be expected to end about the same level as the first structure in the double at 1,991.68, so that the whole structure moves sideways.
An expanded flat for primary wave 2 is more likely than a double combination because these are more common structures for second waves.
HOURLY CHART II
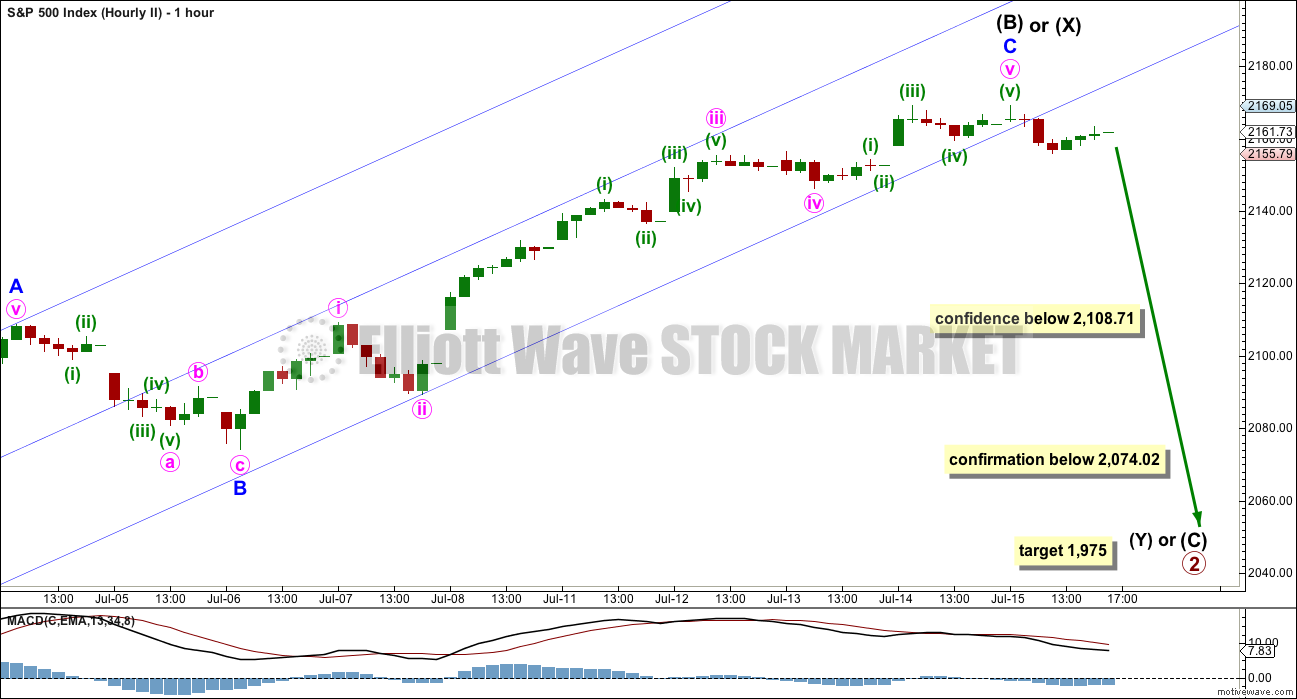
The upwards zigzag of intermediate wave (B) or (X) may again be over.
With a red daily candlestick now printed for Friday’s session, this second wave count has slightly increased in probability but is still not supported by volume. If this wave count is correct, then another red daily candlestick should be printed for Monday that has higher volume.
If this wave count is indicated as more likely on Monday, then intermediate wave (4) may be expected to be a time consuming flat, combination or triangle most likely. It may last another one to four days to total a Fibonacci two or five at the most.
At 1,975 intermediate wave (C) would reach 1.618 the length of intermediate wave (A). This is the most common ratio for a C wave of an expanded flat, so it has a reasonable probability.
BEAR WAVE COUNT – WEEKLY CHART
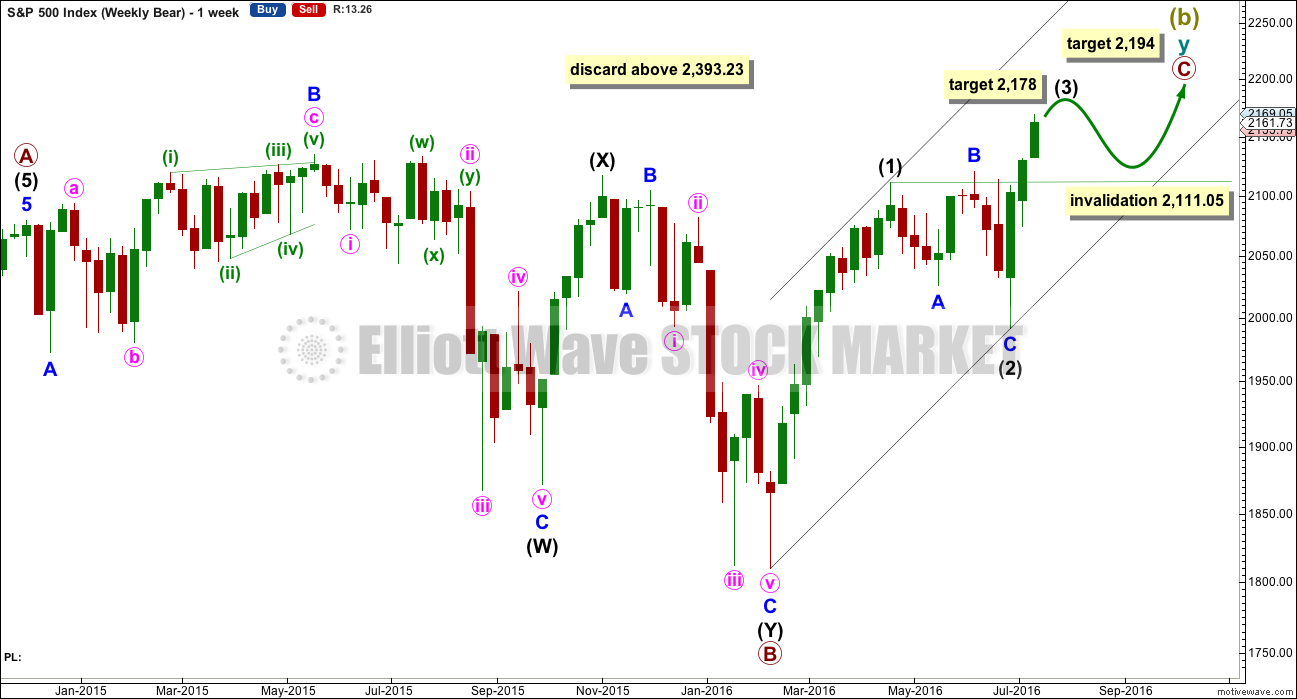
It would still be possible that a Super Cycle trend change is close if Super Cycle wave (b) (or (x) ) is subdividing as a double zigzag.
However, the expected direction and structure is now the same short and mid term for this idea as it is for the main wave count.
Within the second zigzag of cycle wave y, primary wave C must complete as a five wave structure.
So far Super Cycle wave (b) is 1.72 the length of Super Cycle wave (a). This is comfortably longer than the normal range which is up to 1.38, but still within the allowable convention of up to 2 times the length of wave A.
Above 2,393.23 Super Cycle wave (b) would be more than twice the length of Super Cycle wave (a). Above this price point the convention states that the probability of a flat correction unfolding is too low for reasonable consideration. Above that point this bear wave count should be discarded. The same principle is applied to the idea of a double combination for Grand Super Cycle wave II
A five wave structure upwards would still need to complete for primary wave C. So far upwards movement is a very strong three wave looking structure. Trying to see this as either a complete or almost complete five would be trying to fit in what one may want to see to the waves, ignoring what is actually there.
At 2,178 intermediate wave (3) would reach 0.618 the length of intermediate wave (1).
Thereafter, intermediate wave (4) may move sideways for a few weeks as a very shallow correction. Thereafter, intermediate wave (5) would most likely make a new high. At 2,194 primary wave C would reach 0.382 the length of primary wave A. This final target is close to the round number of 2,200 and so offers a reasonable probability.
If price reaches 2,200 or close to it, then this idea would again be assessed, and an attempt made to determine its probability. The situation between now and then though may change.
The important conclusion is more upwards movement is extremely likely, as a five up is needed to complete.
TECHNICAL ANALYSIS
WEEKLY CHART
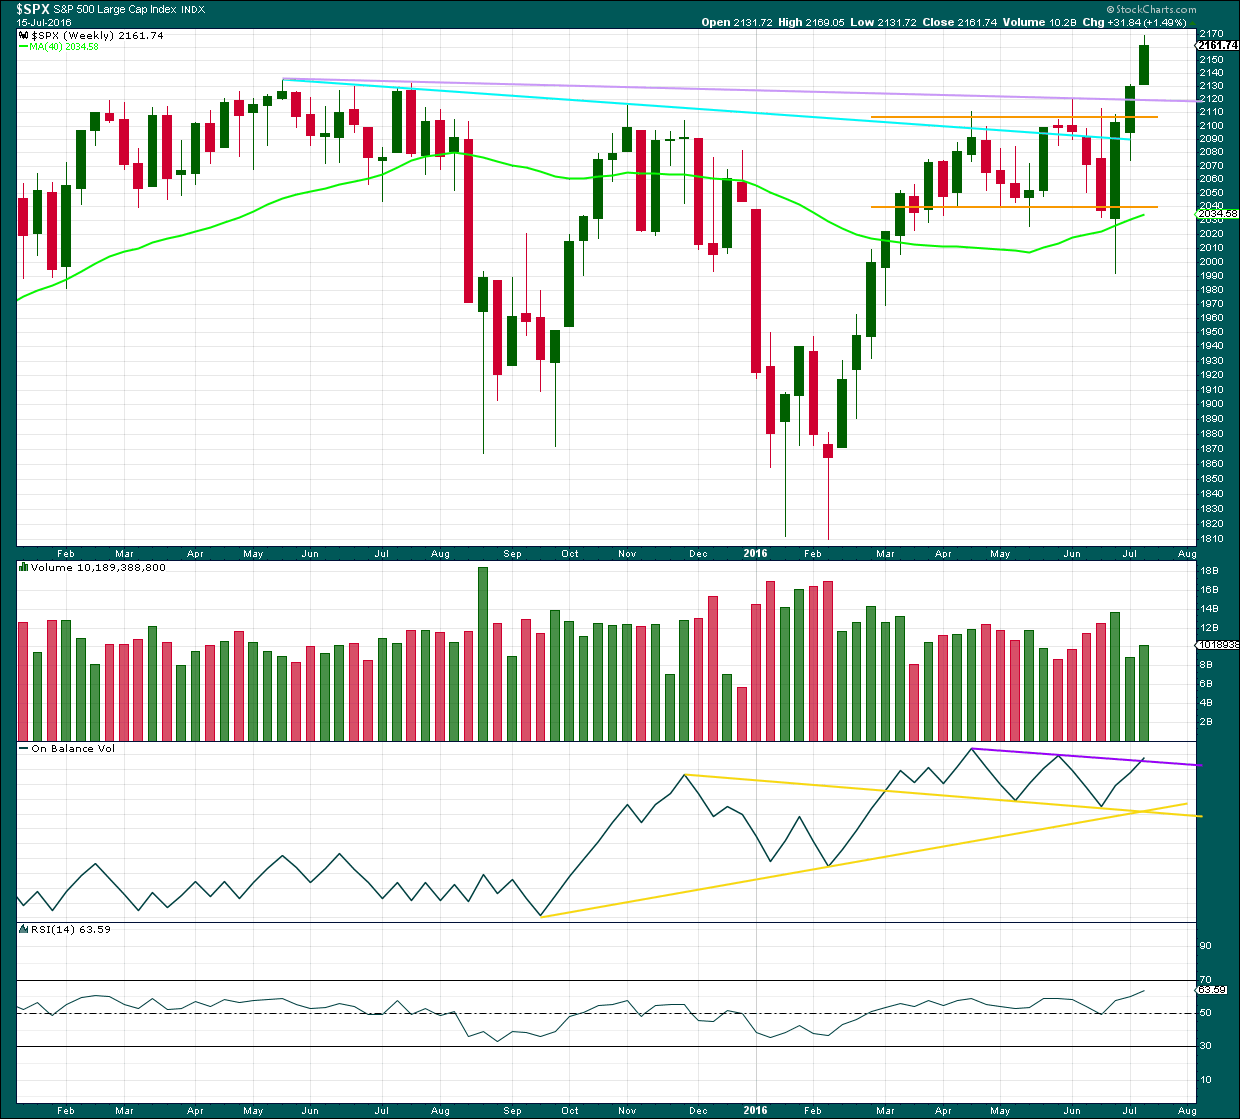
Click chart to enlarge. Chart courtesy of StockCharts.com.
At the end of this week, price has very clearly broken out of the prior consolidation upwards. This applies not only to the small consolidation on the weekly chart shown by yellow support and resistance lines, but also to the larger multi month consolidation that was shown in prior weekly charts and which had the upper resistance line at the prior all time high of 2,134.
Volume this week is higher than last week. There is some support from volume for the rise in price although the first upwards week still has strongest volume.
From the last swing low, there is now a bullish engulfing candlestick pattern followed by three advancing white soldiers pattern. Both patterns are bullish.
DAILY CHART
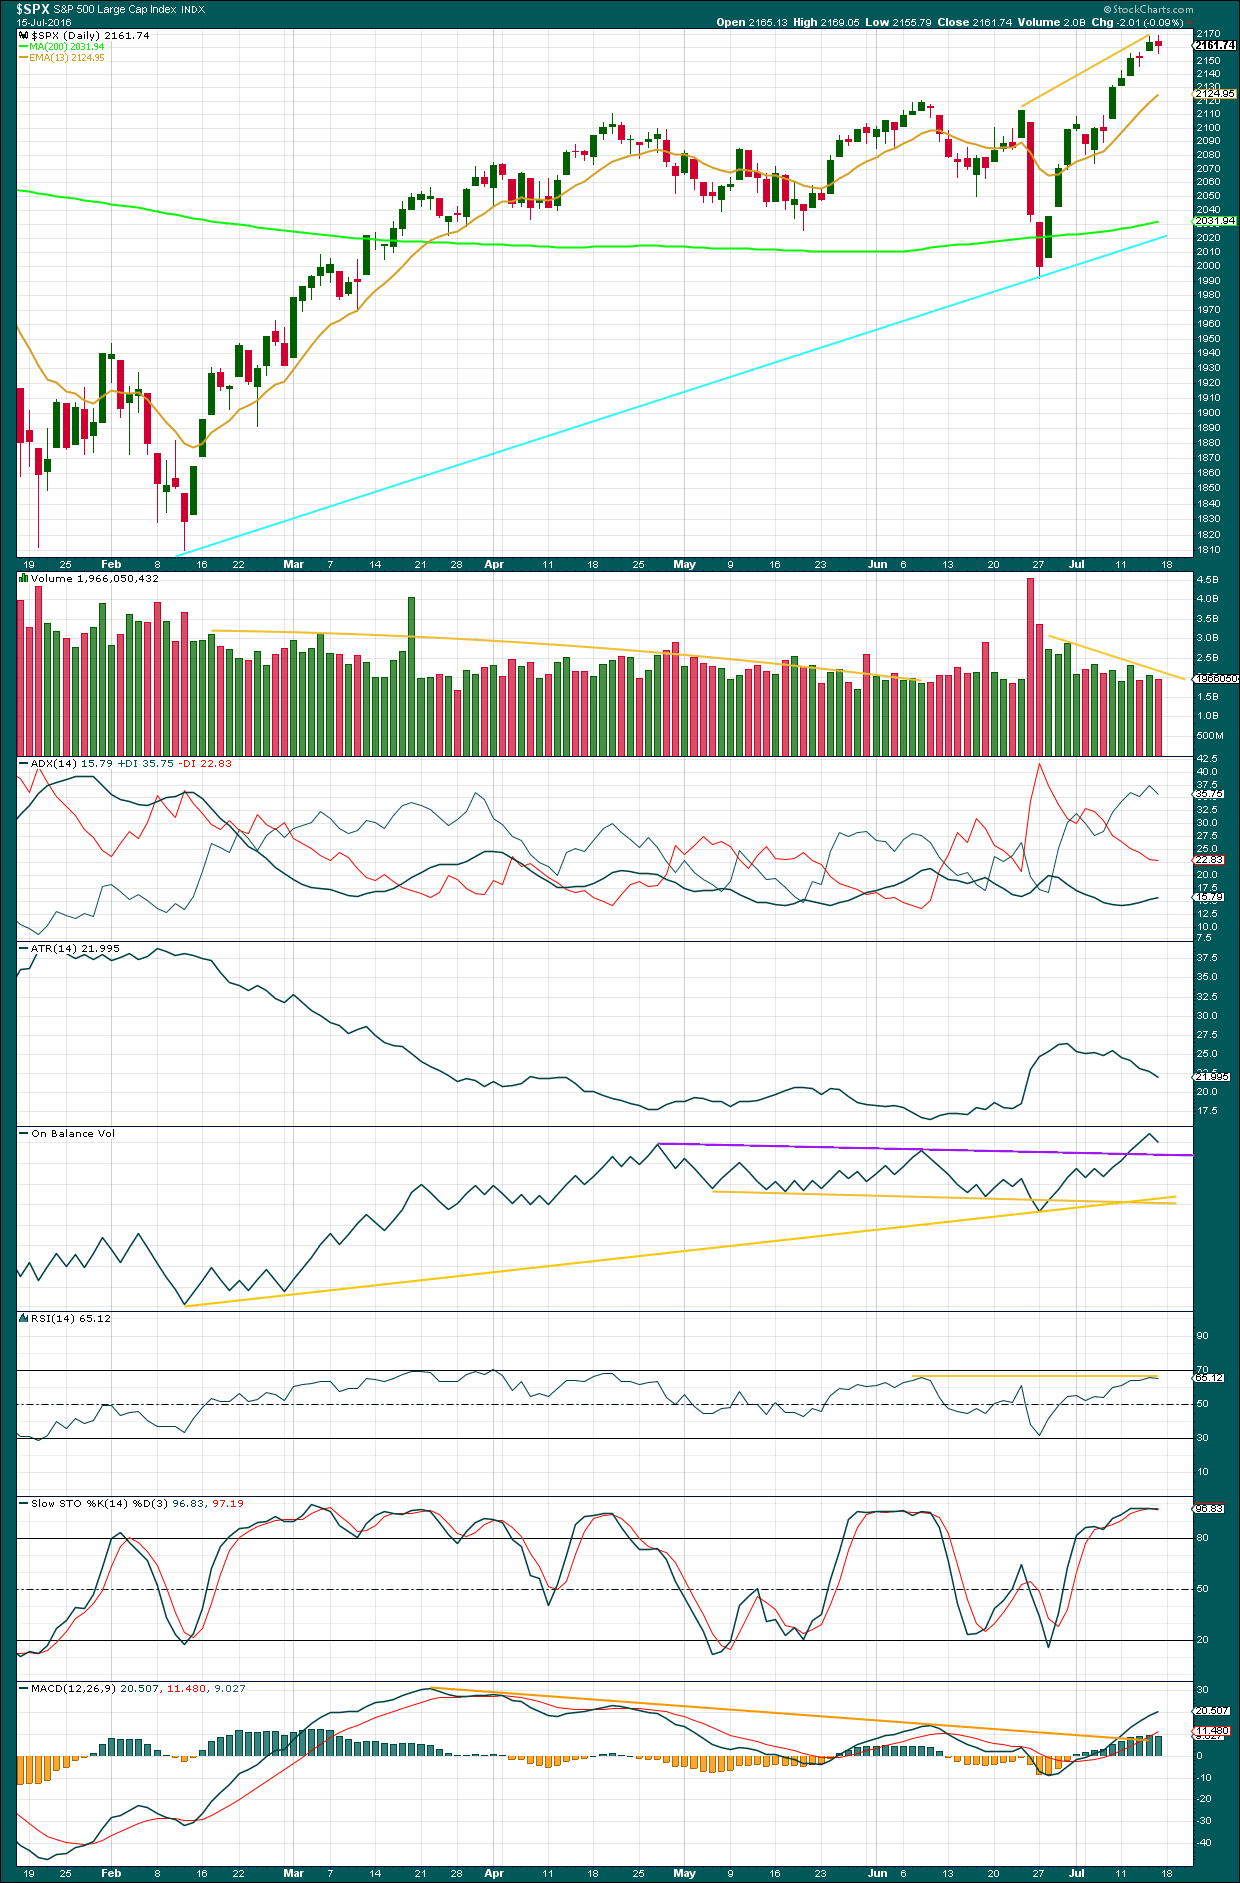
Click chart to enlarge. Chart courtesy of StockCharts.com.
Overall, volume is falling as price rises. The volume profile mid term is still bearish.
In the short term, Friday’s red daily candlestick comes with lighter volume than the prior upwards day. There is currently more support for price rises than falls; short term, it should be expected to see price continue to rise. The short term volume profile is still bullish. A larger pullback is not yet indicated. This supports wave count I over wave count II still.
ADX is increasing and above 15 indicating a new upwards trend is in place. At the end of this week, ATR is still very clearly declining. This is not normal for a trending market and indicates some weakness.
On Balance Volume at the end of the week is turning downwards. There is a little room for OBV to move lower before it finds support. If OBV comes down to touch the purple trend line, that may show when price stops downwards movement as the purple line offers support.
At the end of the week, there is still negative bearish divergence between price and RSI. This new upwards trend is lacking in strength.
At the end of this week, there is still negative bearish divergence between price and MACD. This new upwards trend is lacking in momentum.
There is again something wrong with this trend, so it should be expected eventually to be more than fully retraced. Each day the bulls are able to push price up by a smaller and smaller amount. This trend is tired and weak.
However, looking back at the larger picture price was able to rise in light and declining volume for many months up to the last all time high. Weakness indicates the movement is likely to be more than fully retraced, but weakness can persist for reasonable periods of time before the market changes from bull to bear. This persistent weakness indicates some caution, targets may be too high and optimistic.
VOLATILITY – INVERTED VIX MONTHLY CHART
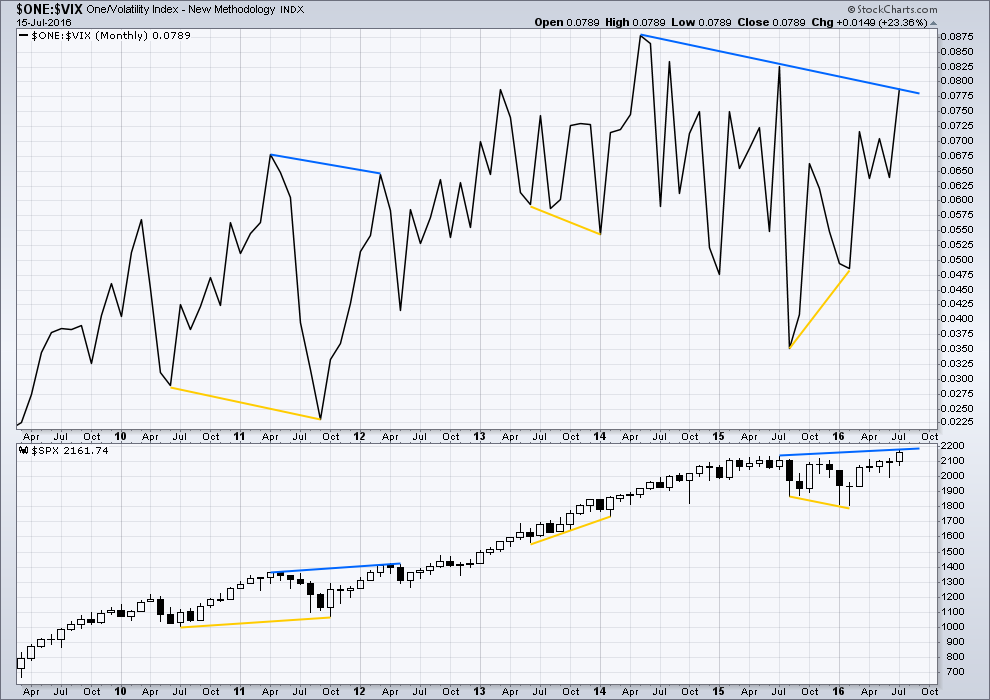
Click chart to enlarge. Chart courtesy of StockCharts.com.
VIX from StockCharts is inverted. As price moves higher, inverted VIX should also move higher indicating a decline in volatility which is normal as price moves higher. As price moves lower, inverted VIX should also move lower indicating an increase in volatility which is normal with falling price.
There is still strong multi month divergence with price and VIX. While price has moved to new all time highs, this has not come with a corresponding decline in volatility below the prior all time high at 2,134. This strong multi month divergence between price and VIX indicates that this rise in price is weak and is highly likely to be more than fully retraced. However, this does not tell us when and where price must turn; it is a warning only and can often be a rather early warning.
At this time, although divergence with price and VIX at the daily chart level has been recently proven to be unreliable (and so at this time will no longer be considered), I will continue to assume that divergence with price and VIX at the monthly chart level over longer time periods remains reliable until proven otherwise.
This supports the idea that price may be in a fifth wave up. Divergence between the end of a cycle degree wave III and a cycle degree wave V would be reasonable to see. Fifth waves are weaker than third waves. This strong divergence indicates that price targets may be too high and time expectations may be too long. However, it remains to be seen if this divergence will be reliable.
DOW THEORY
Major lows within the prior bull market:
DJIA: 15,855.12 (15th October, 2014) – closed below on 25th August, 2015.
DJT: 7,700.49 (12th October, 2014) – closed below on 24th August, 2015.
S&P500: 1,821.61 (15th October, 2014) – has not closed below this point yet.
Nasdaq: 4,117.84 (15th October, 2014) – has not closed below this point yet.
Major highs within the new bear market:
DJIA: 17,977.85 (4th November, 2015) – closed above on 18th April, 2016.
DJT: 8,358.20 (20th November, 2015) – has not closed above this point yet.
S&P500: 2,116.48 (3rd Nobember, 2015) – has now closed above this point on 8th June, 2016.
Nasdaq: 5,176.77 (2nd December, 2015) – has not closed above this point yet.
Dow Theory Conclusion: Original Dow Theory still sees price in a bear market because the transportations have failed to confirm an end to that bear market. Modified Dow Theory (adding S&P and Nasdaq) has failed still to confirm an end to the old bull market, modified Dow Theory sees price still in a bull market.
This analysis is published @ 03:23 a.m. EST on 16th July, 2016..



Nothing much to see in the market today really.
Todays analysis will be hardly changed from this one.
If todays candlestick closes green and has any support from volume then the outlook for more upwards movement overall will be supported. If volume is lighter though it won’t.
SPX Volume:
474.627 Million Today 167.345 Million Less than Friday and one of the TWO lowest in 6 months.
637.972 Million Friday
Only 41 comments today? thats a new low. 🙂
Covered my 9 Sept ES short position for a small gain of $450 (2159 short, 2158 close).
The RUT and NDX look like they are going to head for their respective highs, and it looks like this will drag S&P higher. Would be willing to go short again if market closes at LOD.
Also, put on a small GC PUT position as it looks like if market holds the highs, gold could get smacked to 1300, and possibly under the lows pre-Brexit of 1250.
F it. Back to Short 10 Sept ES @ 2160. Closed GC put for small gain.
Nice summary of expected earnings report. On balance, mixed to improving consensus.
http://247wallst.com/investing/2016/07/14/how-djia-earnings-could-make-or-break-this-rally/
Every one of these will be DOWN BIG Year over Year!
Better than Expected… is all BS and part of the BIG CON JOB!
This is the Real Picture and does NOT Support New All Time Highs!
1. The S&P 500’s Shiller price-to-earnings ratio was 26.92 at Thursday’s close of the market. That’s well above its 16.68 long term average.
2. The Buffett indicator – market capitalization to gross national product – ended Thursday at 122.9 percent. This is considered “significantly overvalued.”
Bank Index. Series of lower highs. Watching trend line.
EPS
https://www.factset.com/websitefiles/PDFs/earningsinsight/earningsinsight_7.15.16
To those who say the Bear market is dead, I say beware of the Zombie Bear! This is a chart I created that I am watching. Let’s see what happens next!
https://www.tradingview.com/x/mShCblUz/
From my perspective, it seems as if the movement in equities markets has become hopelessly untethered from any kind of fundamental or technical analysis. While I am not saying that EW is no longer valid, the fact is that in hindsight you can go back and always assign a new wave count to the market when it does not behave in the way expected. The events of the last several months is a sobering reminder that EW is not, strictly speaking, a predictive tool, but primarily an analytical one. It may very well give clues to where the market may be headed, but that is all they are- clues, and they only suggest what might, happen. If you find yourself deeply frustrated and/or even angry over what the market has done in contravention of an EW count, you are placing, in my own humble opinion, far too much stock in the methodology, and may also be putting too much capital at risk when you do. Let’s face it folks. this market is not now behaving “normally” and has not done so for years. DJI ran up 1500 points in a few short days. Who is to say it cannot run up another 1500 points in the next six months?
The point is we can only trade what we see, rather than wasting precious time and emotion trying to understand and explain why the market has not, or is not doing what we think it should. The trend is now clearly up. Maintaining short positions, especially short and medium term ones under the circumstances is very risky in my opinion. Every trader should have a number that says he was wrong. Frankly, I expect every trade I enter to tell me if I am right or wrong in a matter of hours, not days, to say nothing of weeks.
I recently entered the biggest trade I have made in quite some time on a monster UVXY bullish put credit spread based on the EW wave count. It initially behaved as expected and I increased the position substantially. The EW count notwithstanding, the trade stopped behaving the way a successful trade should (based on other things I like to keep an eye on), and although the EW bearish count was at the time still the preferred count, the way price was behaving was telling a somewhat different story. I exited the trade for a small loss.
Having said that. I still do not trust this rally. I don’t care what the market does on Monday. If it bolts higher, I will take profits on some positions. If it bolts lower, I will do the same.
I suspect this market will continue to behave is such a way as to to hurt the most folk. Under the present circumstances, that suggests a sharp and deep pullback sometime in the very near future. It will be sharp and deep enough dislodge quite a few comfortable and complacent bulls, and simulteneously promote renewed confidence in persistent and perennial bears. Once the current extreme level of bullishness has been tempered, I expect to see the most manic phase of this long-in-the-tooth bull market unleash. I will be day-trading it every step of the way. Once the top is in, I expect the reversal to be immediate, brutal, and relentless. There will no longer be interminable debates about whether the bear has or has not arrived. This is what I would expect from a Grand Super Cycle top. Cheers!
I’m going to print your post Verne… and read it once a week!
You the man…
Ditto that!
Thanks for the musings Verne. In regards to validity of TA and EW I too have been thinking on this…. I’ll reply when I get home and have let my thoughts settle on it.
In regards to a Grand Super Cycle top… I completely agree. When it arrives it should be clear. A big huge five down. And NOT a leading diagonal. No overlapping.
For now I have finally after two plus weeks of no surf finally found some… now to sleep and surf as much as possible tomorrow while it lasts. I need some zen…. more zen back…. It clears my mind, soothes the soul and calms me.
Vern,
Well said, what most folks trading these markets don’t understand that they are not the only one with access the EW or similar methodology. Larger pockets can make these methodologies work to the play they have scripted…
I would even take that a step farther Ris, and argue that if you have deep enough pockets, you can actually trade against traders using EW once you know what they are looking for. I have had a theory now that this is exactly what CBs are doing at critical moments in the market and that this behaviour results in either more complex or extended waves. When you look at the personality and structure of extended flats for example, they are absolutely reflecting an ingenious strategy for frustrating both bull and bear in the medium to short term, depending on the size of the wave. These kinds of moves are not random. They reflect savvy and purposeful traders taking advantage of the uninitiated.
Olga,
What did your monkey and that dart board come up with for Monday?
The One Key Indicator Pointing To A Bear Market:
http://www.zerohedge.com/news/2016-07-16/one-key-indicator-pointing-bear-market
Great article! Considering how roles were reversed in 2007 with DJT being the index to go on to new highs while DJI failed to do so, the real power of DOW theory could be that it is telling us that the banksters can screw with all of the indices some of the time, and they can screw with some of the indices all of the time, but they CANNOT screw with ALL of the indices ALL of the time! DJT bears watching closely, pun intended! 🙂
It is also interesting that the author of the article notes that these kinds of divergences seem to be associated with bubble economies, namely, banksterism run amuck…! 🙂
Link to technical analysis supporting the Bear Case… A Bull Trap… Large Triangle topping pattern… Distribution Volume off of recent highs
(My comment [Joe’s]: this distribution volume fits my observation that all the big moves up occur in the overnight futures and then when cash market opens shares are in distribution mode through out the day. I also believe these facts severely distort the on-balance volume data to hide the bearish signal… after all if SPX prices are pushed up by 20 SPX points in the overnight and stays there to slightly higher the entire day… then just about all that volume would be volume showing as positive in the on balance volume calculation and only the small waves down during the cash day negative.)…
http://stockcharts.com/public/1092905
My Comment [Joe’s]: Nothing is as it appears in usual technical data… “The BIG CON” is in full force by the powers that be!
Great point regarding OBV Joe. The wave count in the link provided is not a valid count for an expanding triangle.
I don’t believe that analyst is using Elliott Wave Analysis (he does not use EW terms anywhere). Just triangles… + other tech’s.
Two other interesting stats:
1. The S&P 500’s Shiller price-to-earnings ratio was 26.92 at Thursday’s close of the market. That’s well above its 16.68 long term average.
2. The Buffett indicator – market capitalization to gross national product – ended Thursday at 122.9 percent. This is considered “significantly overvalued.”
Another Technician’s take on all time new highs:
Cornerstone Macro’s Carter Worth…
http://www.cnbc.com/2016/07/16/stock-markets-moonshot-to-record-highs-is-all-hype-cornerstones-worth-says.html
I agree that it is indeed a con and quite a massive one at that. I am now expecting that it will all end at the next most natural round number stopping point, namely DJI 20,000.00. My plan going forward will be to accumulate a massive short position by selling bullish put spreads going into late 2017 for the rest of the run higher. As the market moves higher, the sell side will be closed, the buy side will remain open. It is my opinion that the turn will be sudden and again be signaled via a monster collapse in overnight futures, likely caused by an outbreak of military conflict. I plan on having a very large short position, courtesy of Mr. Market’s bullish pranks, when that day arrives. Best of luck and savvy trading to you all…!
I have to admit to you all I have a bit of anger, disbelief, confusion, a sense of giving up trying to play the right side of the trade….etc. I have been following so many good people like Lara (very smart ones IMO) that understand EW Theory. I am subscribed to many channels on Youtube from experts that had been calling a bear market since the May highs in 2015. I am perplexed that we hit new highs and I thought (without a doubt) this last run up near resistance levels would be the mother load of a Bull trap. I am NOT blaming anyone and I know Lara does a phenomenal analysis! I am just blown away by the fact that the markets have fooled everyone involved… including myself! Maybe after OBAMA with his “peddling fiction comment” he knew this already when he met with Janet Yellen a month ago in a private meeting. What did they talk about? I speculate he told her… “keep this propped up for my legacy”? OR “We need to run to all time highs, before the next false flag while I am president” You see, either way it still could be a BULL Trap!
Ever since QE’s from Bernanke I have never seen such distorted markets to invest in. This has created so much confusion. I am absolutely stunned that the average Joe can invest in his 401K into mutual funds the past 3-5 years with zero knowledge of what the underlying economy and they have 51% returns on the benchmark S&P index. That is unbelievable!!
This is the most HATED Bull market in history!! I am proof that fundamentals no longer exist… i am convinced we are living in a global elitist playground.
Ask yourself:
1.) How can the market be hitting all time new highs with 17 weeks of record selling of BOA smart money clients? 17 weeks was a record
2.) How can 10Y Treasury yield be at a record low while the S&P is at a record high?
3.) How can GOLD run up while the USD is rising into a all time high S&P?
4.) How can, George Soros, Stanley Drunkenmiller and a slew of others known to exit positions on the S&P 500 and go long Gold and we are at all time highs again on LOW volume?
5.) HOW CAN I HAVE BEEN SO STUPID TO LISTEN TO THIS STUFF AND JUST INVEST INTO A MUTUAL FUND AND WOULD HAVE MADE BETTER OFF??
Well….. they say the trend is your friend. I am telling you that if that is the case, I am riding the comet wave of the Miners space in the precious metals now. I have been reluctant to get into the S&P 500 because I was afraid the trend would go the other way. However, I am absolutely convince the there is not much upside in that and a huge opportunity in the miners.
Again… either I am stupid or eventually will make some BIG money!
take care
-Marty
Oh one last one I for got to mention….
6.) How can JP Morgan, Wells Fargo have outstanding quarterly results after American Companies have just registered the most corporate defaults ( I think up to 100 now) since 2009 and it’s ramping up fast.
I call BS somewhere.
Marty,
Playing the markets based on rationale and old measures including TA alone doesn’t cut it anymore as too many cooks in the kitchen..
Ris,
That sounds good…just like late a 2006-2007 statement. However, when the markets went the other way… rationale and technical Analysis made sense all of a sudden. So I respectfully disagree.
Marty,
Like many have said it ‘It works until it stops to work’. My concern and worry is that given my limited financial resources compared to Manipulators, I will loose it all if I was to just go by the TA. TA such as EW helps you with risk assessing the alternatives to make informed decisions.
I don’t know anyone on this board that raked in big time when the markets crashed in Feb 2016, 2008 or 2000. Some were perhaps lucky to be in positions that made money but majority probably missed a big chunk of the drop.
I will never blindly just go with the TA and risk investment s.
Marty, if you’re subscribed to so many channels and read EW analysis, then at this point what would make things easier is be a hard core contrarian. Gather what you hear, see what the consensus is, and do exactly the opposite…
I only read Lara’s analysis, so I can’t really do that. But if you’re putting in all this time and energy reading, that’s what most other investors are reading also…
Keep that in mind…
For so so long we were looking for a 3rd wave down… all the news and logic and EW analysis expected it. Instead, we’re in a 3rd wave up!!! What a joke… and all of us bears are left holding the bag, whatever that means…
Marty,
I am new to this site, I am (quite) new into trading and, eventually, I am new into deep water situation, as I have (heavy) short positions on the S&P. And, last but not least, I have the same feeling about this situation, something is wrong, fully wrong, but despite this wrongness the index goes up and up….There is always room for improvement in the field of markets knowledge…let’s hope this lesson will feed best trades in the future…
Marty – the answer to most if not all of your questions are in this graph. Noting I was a bear too since May 2015. And have to give credit to Nate’s EW blog as he did get it right, a bull market, long ago. Months ago. Of course when you have either up or down there are bound to be a percentage who can automatically claim they got it right.
Turkey coup flatters so now markets will celebrate come Monday with relief rally … 🙂
It now may be worse… Turkey a NATO country…
may now be well on it’s way to becoming an Islamic State. With Erdogan’s path to full, authoritarian power. Goodbye to democratic constitutional government.
This morning, the president’s own “counter-coup” began with the purging of 2,745 judges across the country, as well as the issuance of arrest warrants for 140 appeals court members.
This is now a big problem for NATO, Europe and the rest of the west and western allies in the middle east. It will also be a huge problem for Russia.
Joseph,
If in near to short term turkey event has bigger impact than Brexit or unfortunate incident in Nice,France, market will react but as I understand there is no immediate economic impact to US. In fact fight or war in Middle East is going to help arms manufacturer in the US.
NATO Allies Rally Behind Erdogan is the headline flashed on bloomberg
Unfortunately that’s the major problem in this world… People only take the time to read and believe what headlines say!
Very few take the time to understand the details of the issues!
I will leave it at that… some here fully understand what I mean.
XYZ Company reports and earnings are better than expected. Nuff Said!
You think the NATO allies are liking what just occurred at a major NATO Air Base in Turkey???? This Action OPENS a whole other can of worms (Friction at major proportions).
Turkey Suspends All US Operations Against ISIS At Incirlik Airbase, Which Vaults B61 Nuclear Bombs
Following the failed Turkish coup, U.S. military operations out of Turkey’s giant Incirlik Air Base – critical in the ongoing campaign against ISIS – came to a halt Saturday afternoon as the Turkish military closed the airspace around the base and suspended all US-led operations, mostly targeting the Islamic State.
A statement posted by the US embassy in Turkey said that local authorities are denying movements on to and off of Incirlik Air Base adding that the power there has also been cut.
http://www.zerohedge.com/news/2016-07-16/turkey-suspends-all-us-operations-against-isis-incirlik-airbase-which-vaults-us-b61-
Exactly was my thought…. anything makes the S&P 500 climb…… anything! It’s unbelievable!!!
I’m off, heading north, to hunt for waves in the ocean tomorrow. Will answer questions when I get back Monday evening / NY Sunday afternoon 🙂
Here’s hoping I find waves and come home with a silly stoked smile on my face 🙂
Have fun!
First for the first time. yay
Well done!
“Feels like the first time!” 🙂
https://www.youtube.com/watch?v=8Tl-kOcnn1U