Again, the two daily Elliott wave counts today are judged to have about an even probability.
Assume the trend is the same, until proven otherwise.
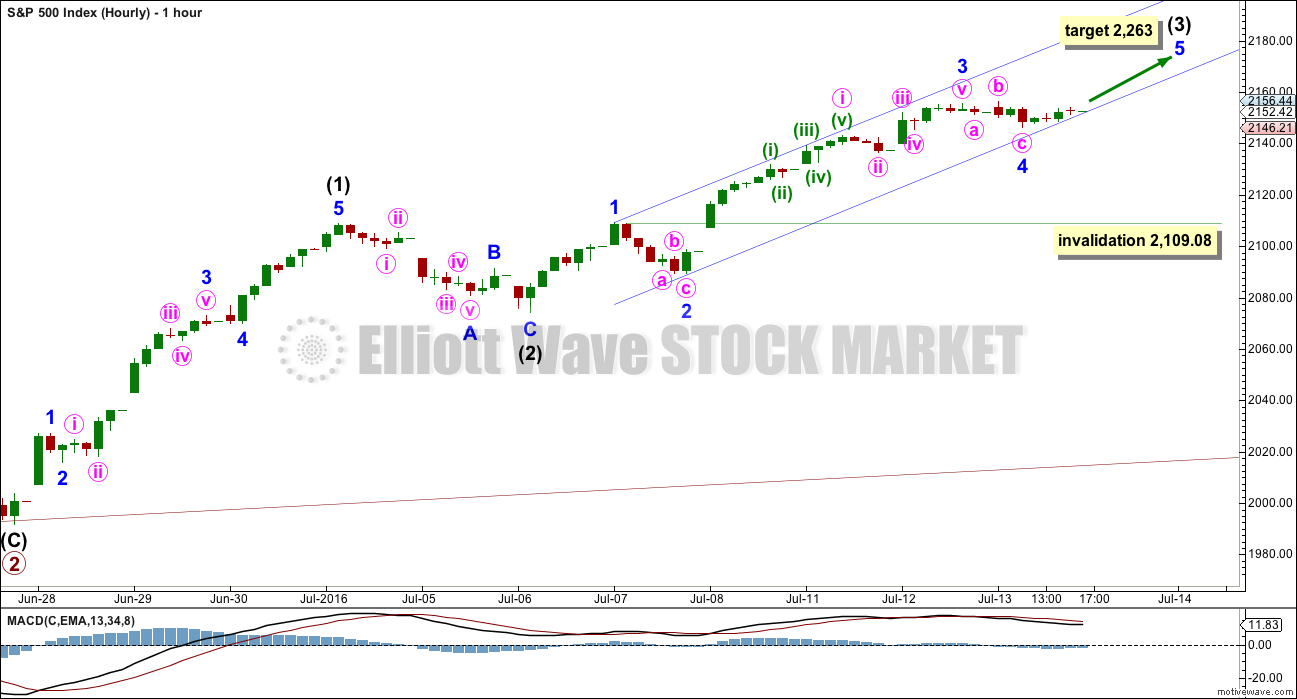
Summary: In the short term, assume the trend remains up while price remains within the channel on the hourly chart, and above 2,109.08. There is bullishness today from On Balance Volume to support this view. The target is at 2,263. A new low below 2,109.08 would confirm a trend change. Once a trend change is confirmed the target would be at 1,963.
Last monthly chart for the main wave count is here.
New updates to this analysis are in bold.
WEEKLY CHART
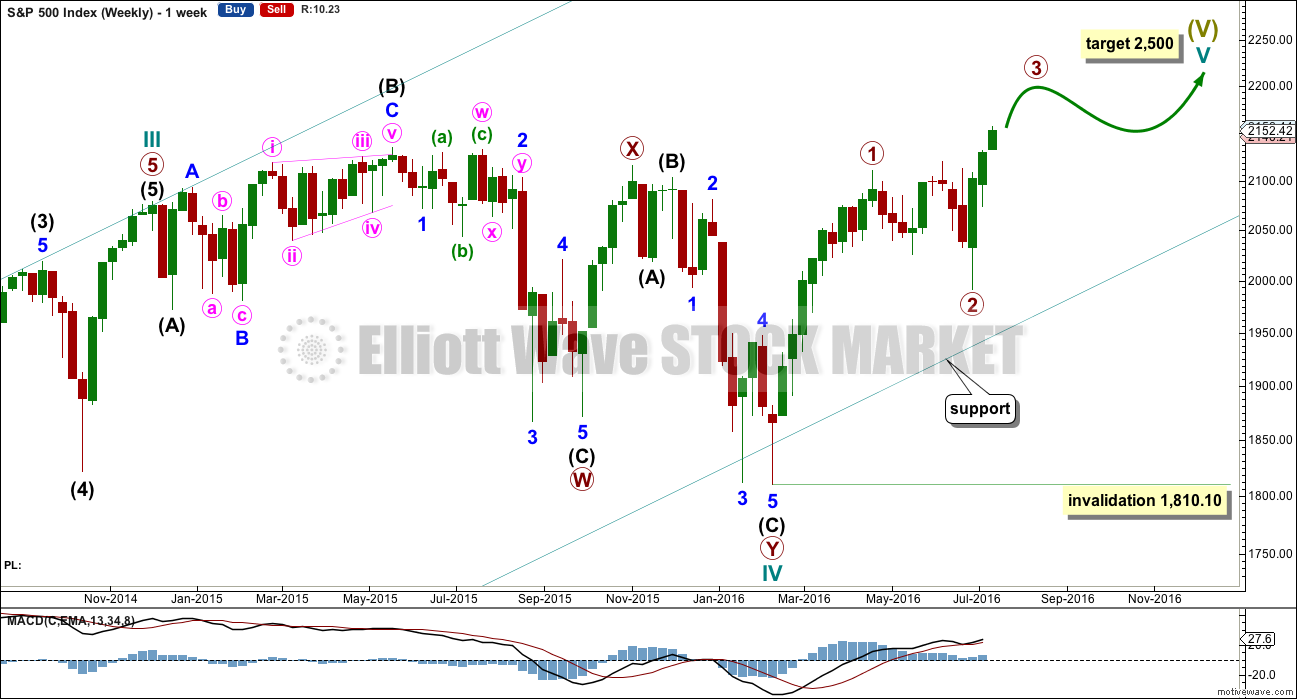
Cycle wave II was a shallow 0.41 zigzag lasting three months. Cycle wave IV is now seen as a more shallow 0.28 double combination lasting 14 months. With cycle wave IV nearly five times the duration of cycle wave II, it should be over there.
After some consideration I will place the final invalidation point for this bull wave count at 1,810.10. A new low below that point at this time would be a very strong indication of a trend change at Super Cycle degree, from bull to bear. This is because were cycle wave IV to continue further sideways it would be grossly disproportionate to cycle wave I and would end substantially outside of the wide teal channel copied over here from the monthly chart.
Cycle wave I lasted 28 months (not a Fibonacci number), cycle wave II lasted a Fibonacci 3 months, cycle wave III lasted 38 months (not a Fibonacci number), and cycle wave IV lasted 14 months (one more than a Fibonacci 13).
If the target for cycle wave V is for it to be equal in length with cycle wave I, then it may also be expected to be about equal in duration. So far cycle wave V is in its fifth month. After this month, a further 23 months to total 28 seems a reasonable expectation, or possibly a further 16 months to total a Fibonacci 21.
Wave count I should be preferred while price remains above 2,109.08. If price moves below 2,109.08, then wave count II would be confirmed.
DAILY CHART I
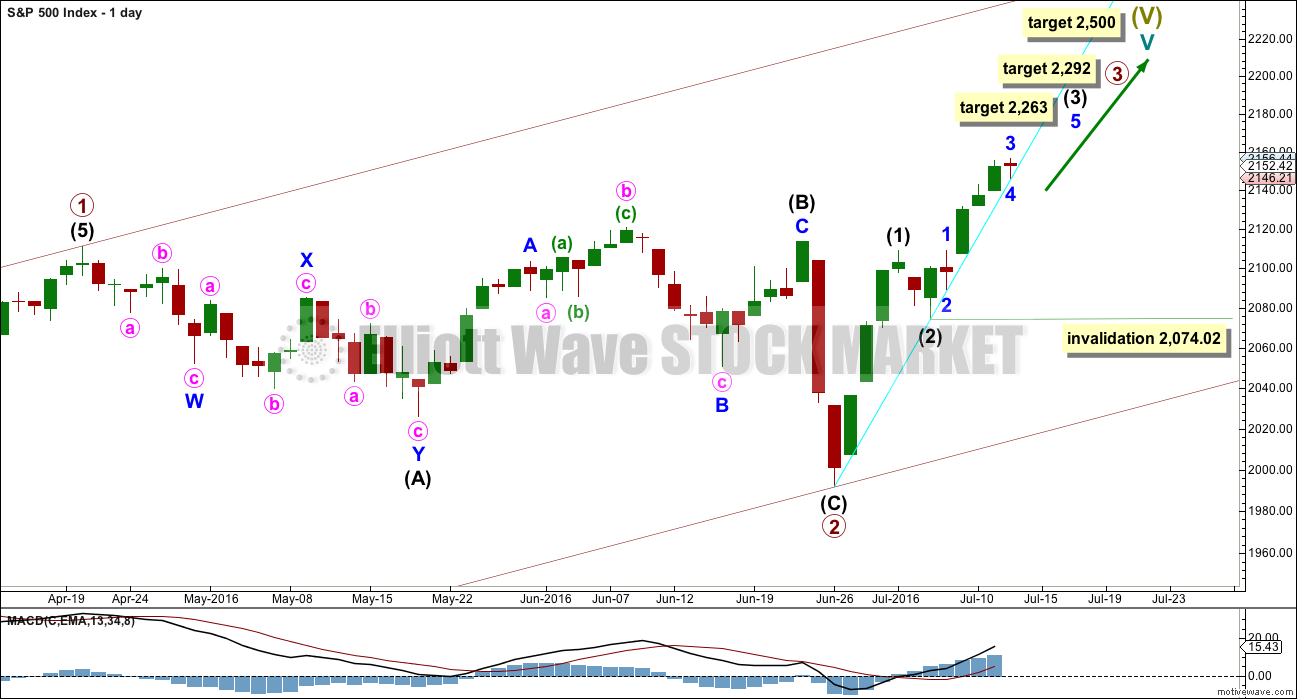
It is possible that primary wave 2 is already complete as a shallow regular flat correction. Primary wave 3 may have begun.
At 2,292 primary wave 3 would reach equality in length with primary wave 1. This is the ratio used for the target in this instance because primary wave 2 was relatively shallow and it fits neatly with the high probability target of 2,500 for cycle wave V to end.
Primary wave 3 may only subdivide as an impulse. So far within it intermediate waves (1) and (2) may be complete.
Within intermediate wave (3), no second wave correction may move beyond its start below 2,074.02.
At this stage, it looks like intermediate wave (3) may have seen minor waves 1 through to 4 complete. This labelling assumes an extended wave for minor wave 5 to reach the target. Alternatively, the degree of labelling within intermediate wave (3) may be changed. For this reason, the invalidation point must remain the same today.
At 2,263 intermediate wave (3) would reach 1.618 the length of intermediate wave (1).
A support line is added in cyan. So far price is finding support at this line. If a daily candlestick is printed below this line, then a deeper correction would be expected to have begun.
HOURLY CHART I
Intermediate wave (3) should still be incomplete for this wave count. It has not lasted long enough nor moved far enough above the end of intermediate wave (1).
At its end, intermediate wave (3) should be far enough above intermediate wave (1) to allow for subsequent room for downwards / sideways movement for intermediate wave (4) to unfold and remain above intermediate wave (1) price territory.
Within intermediate wave (3), minor wave 4 may not move into minor wave 1 price territory below 2,109.08.
It looks like minor wave 4 may have printed a small red daily candlestick today. With both minor waves 2 and 4 showing up on the daily chart, the wave count at that level has the right look so far. Yesterday’s analysis incorrectly noted minor wave 2 as not showing up on the daily chart, but it does. It was a small red doji.
So far there is no Fibonacci ratio between minor waves 1 and 3. Minor wave 3 was extended and longer than 1.618 of minor wave 1. A target for minor wave 5 using ratios between minor waves 1 and 3 does not yield a calculation close to 2,263. At this stage, the target will remain the same.
Draw a small channel about the impulse unfolding upwards as shown. Minor wave 5 may end about the upper edge.
Because the short term volume profile still looks bullish today and because On Balance Volume is still bullish, this first wave count is preferred.
DAILY CHART II
This wave count still has a reasonable probability.
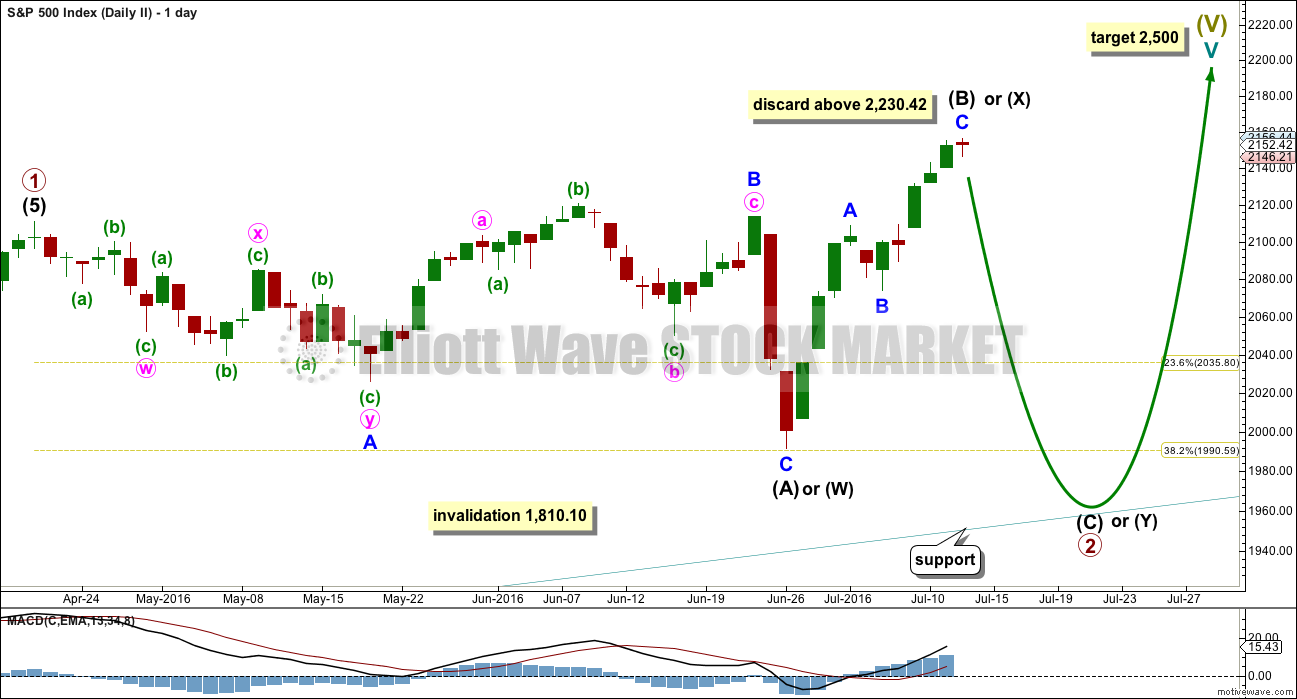
The common length for intermediate wave (B) is from 1 to 1.38 the length of intermediate wave (A), giving a range from 2,111.05 to 2,156.41.
The idea of a flat correction should be discarded when intermediate wave (B) exceeds twice the length of intermediate wave (A) above 2,230.42.
When intermediate wave (B) is complete, then a target may be calculated for intermediate wave (C) downwards. It would most likely end at least slightly below the end of intermediate wave (A) at 1,991.68 to avoid a truncation and a very rare running flat. It may end when price comes down to touch the lower edge of the channel copied over from the monthly chart.
Primary wave 2 may also be relabelled as a combination. The first structure in a double combination may be a complete regular flat labelled intermediate wave (W). The double would be joined by an almost complete zigzag in the opposite direction labelled intermediate wave (X). The second structure in the double may be a flat (for a double flat) or a zigzag to complete a double combination. It would be expected to end about the same level as the first structure in the double at 1,991.68, so that the whole structure moves sideways.
An expanded flat for primary wave 2 is more likely than a double combination because these are more common structures for second waves.
HOURLY CHART II
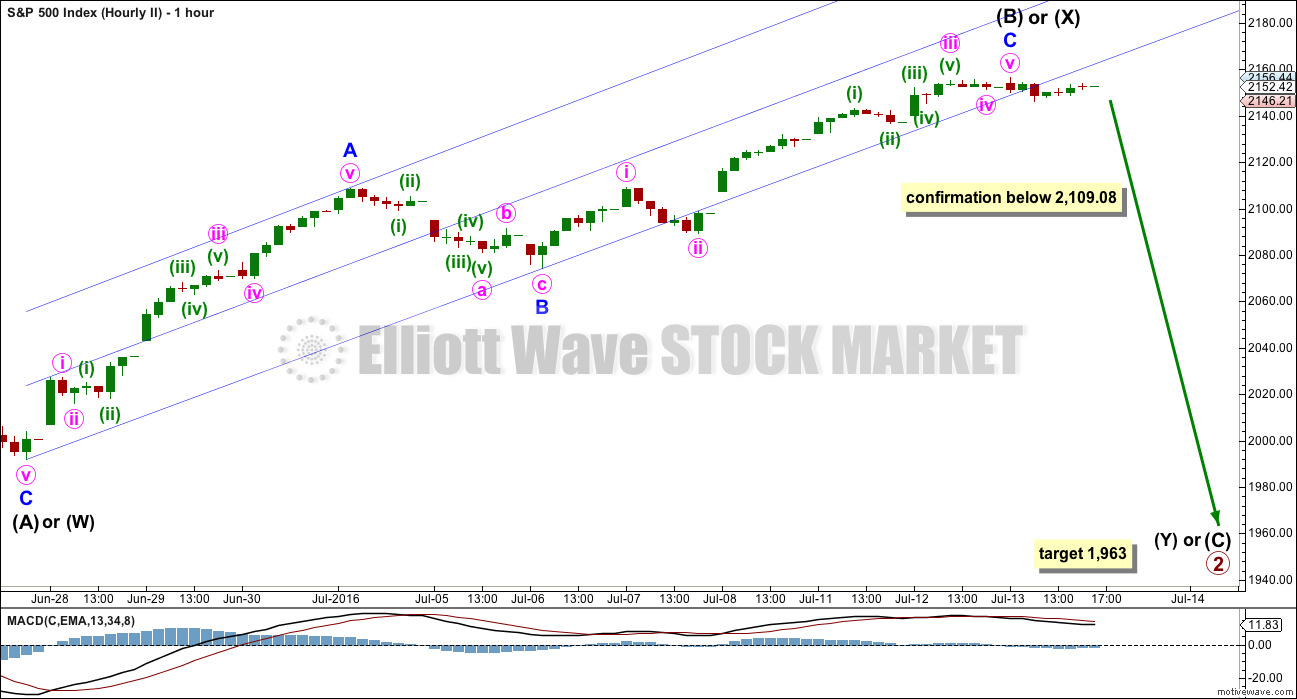
The upwards zigzag of intermediate wave (B) or (X) may again be over.
This wave count requires confirmation with a new low below 2,109.08. At that stage, confidence in a downwards wave may be had.
At 1,963 intermediate wave (C) would reach 1.618 the length of intermediate wave (A). This is the most common ratio for a C wave of an expanded flat, so it has a reasonable probability.
ALTERNATE WEEKLY CHART
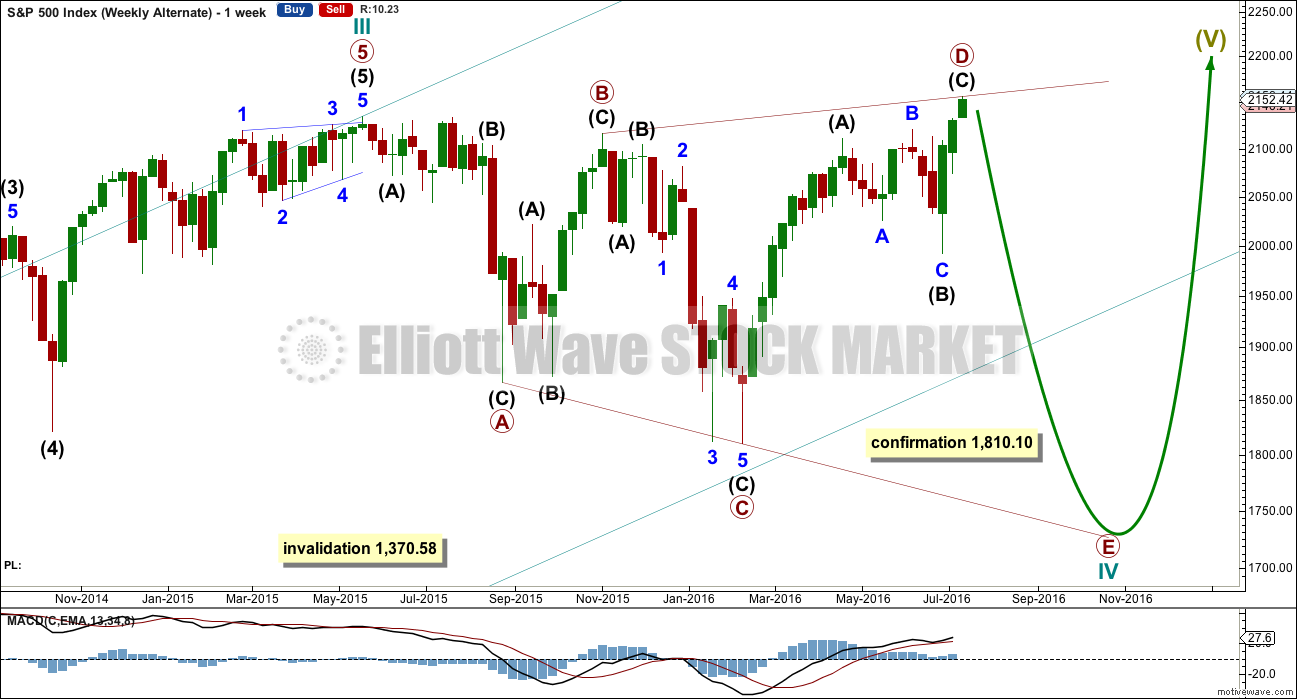
It is possible that cycle wave IV is an incomplete expanding triangle.
This wave count sees cycle wave III over earlier. All subdivisions within the expanding triangle fit perfectly as zigzags.
However, this wave count relies on the rarest of all Elliott wave structures. In my several years of daily Elliott wave analysis on more than one market, I have only ever seen two movements which in hindsight were definitely expanding triangles, and neither were in the S&P500.
With the main wave count relying on a common double combination for cycle wave IV, followed by a common impulse up for cycle wave V, this alternate should not at this stage be seriously considered.
It should be charted and followed as a possibility, and used if price proves it is correct.
Unfortunately, what that means is a new low below 1,810.10 could still be part of a larger bull market. If price does make a new low below 1,810.10, then probability of this wave count vs any other wave count at that time would be determined based on structure and classic technical analysis.
Primary wave E would most likely fall short of the A-C trend line. If price moves substantially below this line, then this idea should be discarded long before the price point at 1,370.58 is breached.
BEAR WAVE COUNT – WEEKLY CHART
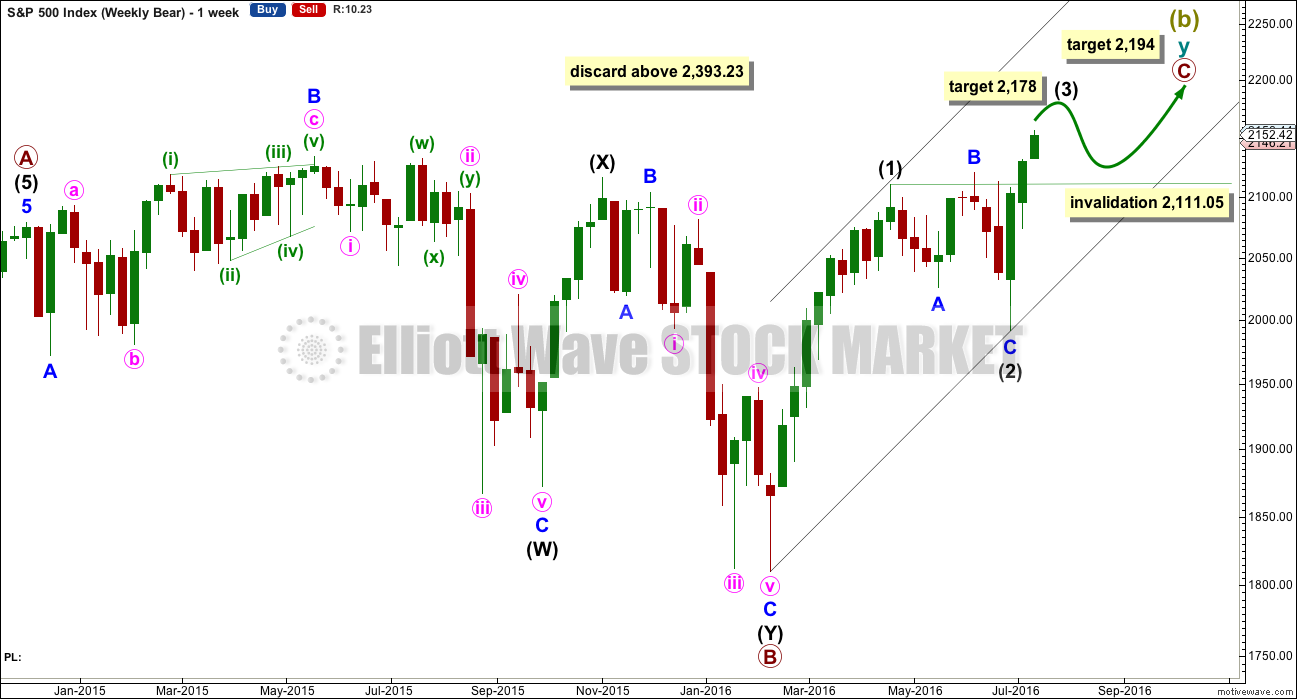
It would still be possible that a Super Cycle trend change is close if Super Cycle wave (b) (or (x) ) is subdividing as a double zigzag.
However, the expected direction and structure is now the same short and mid term for this idea as it is for the main wave count.
Within the second zigzag of cycle wave y, primary wave C must complete as a five wave structure.
So far Super Cycle wave (b) is 1.72 the length of Super Cycle wave (a). This is comfortably longer than the normal range which is up to 1.38, but still within the allowable convention of up to 2 times the length of wave A.
Above 2,393.23 Super Cycle wave (b) would be more than twice the length of Super Cycle wave (a). Above this price point the convention states that the probability of a flat correction unfolding is too low for reasonable consideration. Above that point this bear wave count should be discarded. The same principle is applied to the idea of a double combination for Grand Super Cycle wave II
A five wave structure upwards would still need to complete for primary wave C. So far upwards movement is a very strong three wave looking structure. Trying to see this as either a complete or almost complete five would be trying to fit in what one may want to see to the waves, ignoring what is actually there.
At 2,178 intermediate wave (3) would reach 0.618 the length of intermediate wave (1).
Thereafter, intermediate wave (4) may move sideways for a few weeks as a very shallow correction. Thereafter, intermediate wave (5) would most likely make a new high. At 2,194 primary wave C would reach 0.382 the length of primary wave A. This final target is close to the round number of 2,200 and so offers a reasonable probability.
If price reaches 2,200 or close to it, then this idea would again be assessed, and an attempt made to determine its probability. The situation between now and then though may change.
The important conclusion is more upwards movement is extremely likely, as a five up is needed to complete.
TECHNICAL ANALYSIS
DAILY CHART
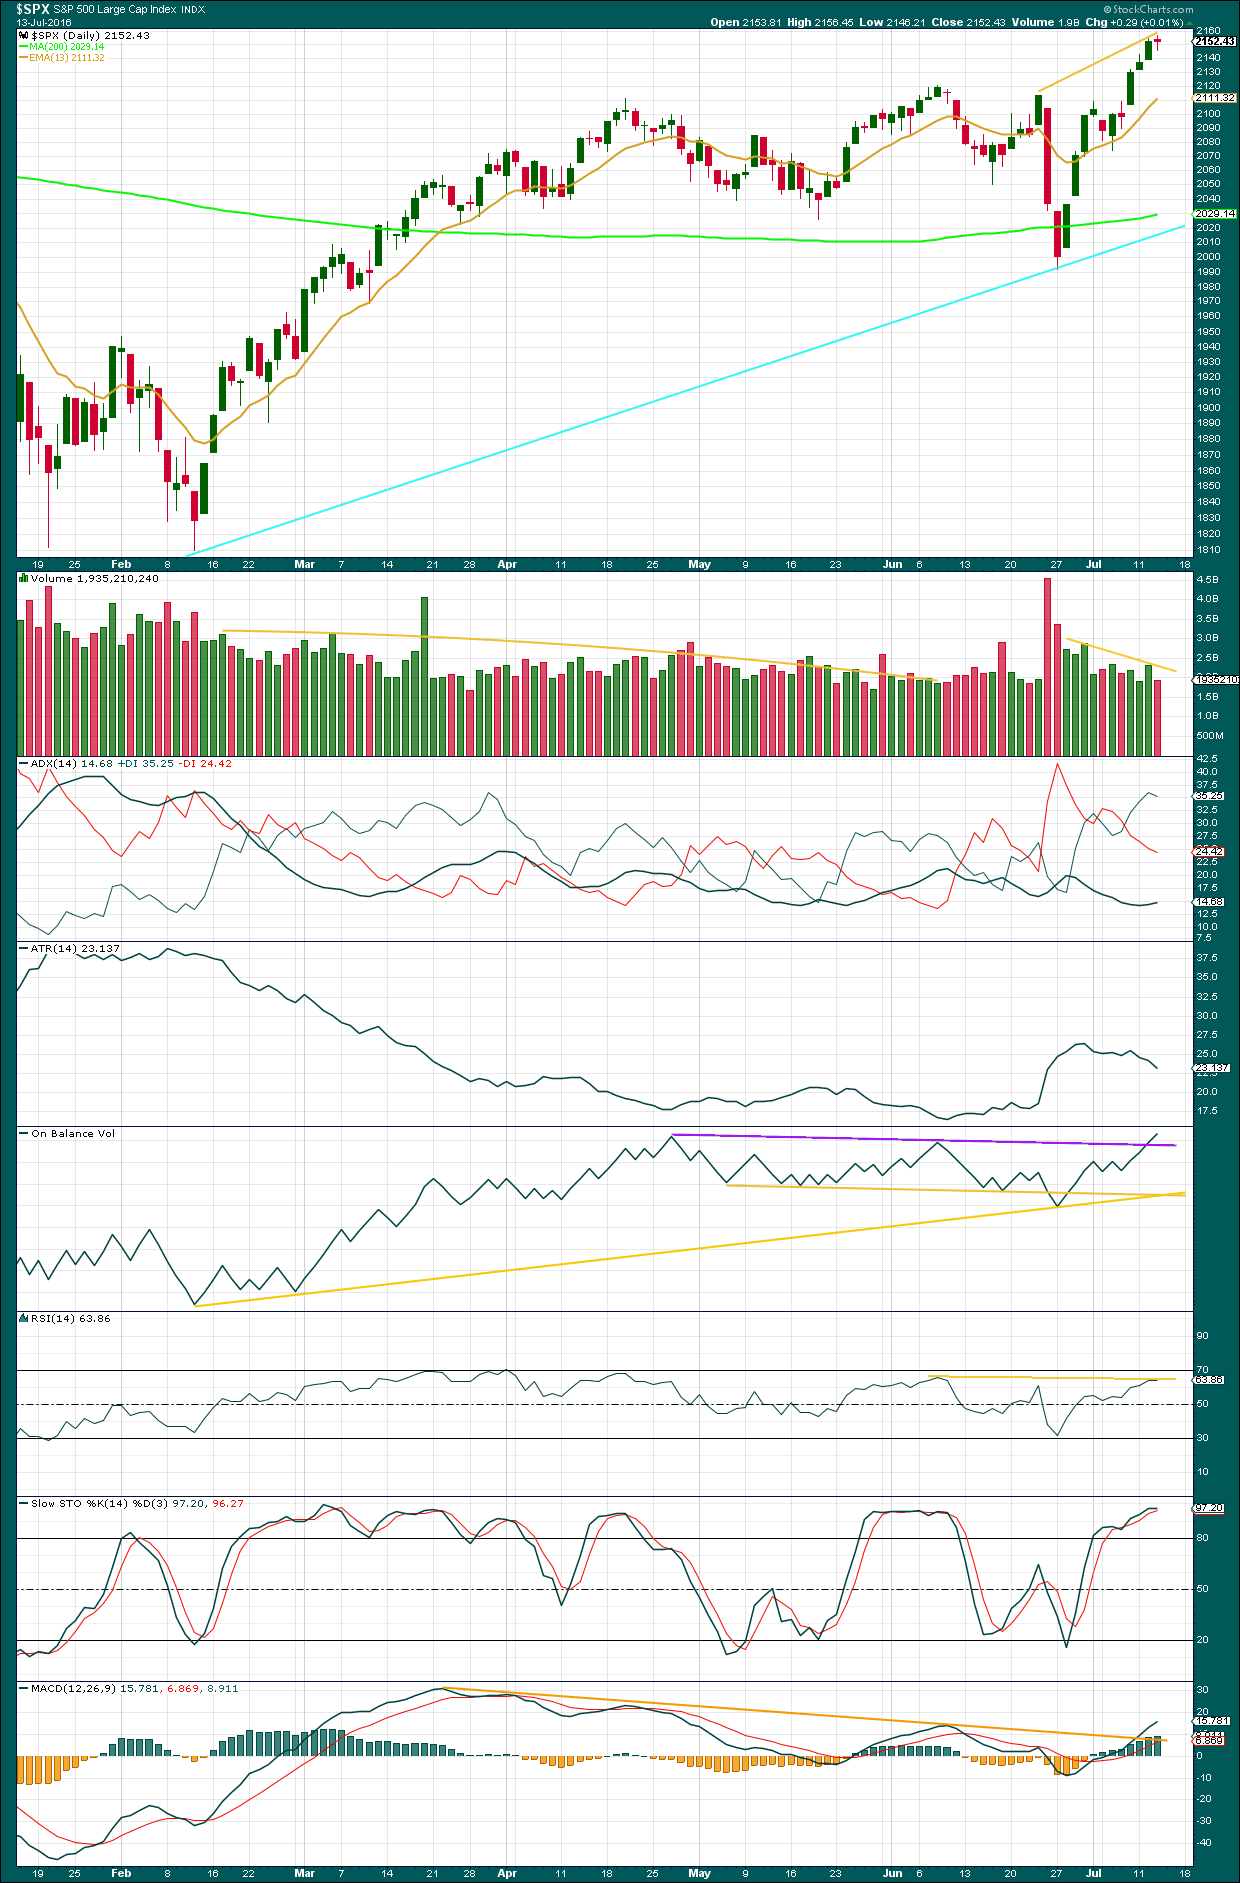
Click chart to enlarge. Chart courtesy of StockCharts.com.
With Wednesday’s session printing a small red daily candlestick, which has lighter volume, the short term volume profile looks bullish.
The mid term volume profile is still bearish. Volume is still falling as price is rising overall.
However, On Balance Volume is bullish and supports the first wave count. OBV has broken above two important resistance lines recently, the first on a monthly chart and the next on this daily chart.
ADX is increasing and the +DX line is above the -DX line. But ADX is still low, not yet at 15. If it can reach 15, then an upwards trend would be indicated. ADX is very weak considering that price has been trending upwards for overall 11 days now.
ATR is still declining, indicating there is something wrong with this trend. Normally, in a trending market the range travelled each day increases for a healthy trend. Each day the bulls are weaker, able to push price up less and less. But still price keeps going up. The weakness seen does not mean price must turn here or that it must turn soon. It only means that eventually this upwards trend is likely to be more than fully retraced.
RSI exhibits still some divergence with price (yellow lines). This indicates some weakness in upwards movement, but at this time divergence is proving unreliable.
There is no divergence between price and Stochastics. Stochastics is extreme, but it can remain extreme for reasonable periods of time during a trending market. If Stochastics exhibits short term divergence after moving into over bought territory, then it would be indicating a correction to arrive. That is not the case yet.
MACD no longer exhibits double divergence, only single. The break by MACD above its trend line was a bullish signal. MACD is indicating there is some momentum to this upwards movement.
At this time, divergence does not look to be reliable. Although there is persistent weakness in upwards movement, there is some support now from volume and particularly On Balance Volume.
VOLATILITY – INVERTED VIX DAILY CHART
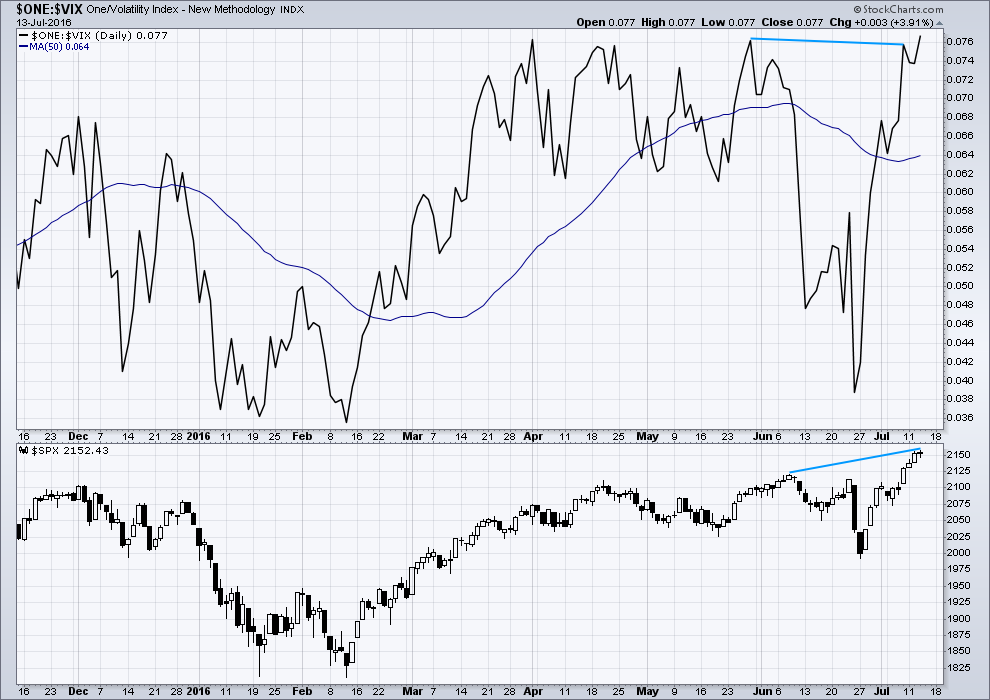
Click chart to enlarge. Chart courtesy of StockCharts.com.
VIX from StockCharts is inverted. As price moves higher, inverted VIX should also move higher indicating a decline in volatility which is normal as price moves higher. As price moves lower, inverted VIX should also move lower indicating an increase in volatility which is normal with falling price.
Divergence at the daily chart level between inverted VIX and price has now disappeared. Up until the last couple of weeks, this indicator was used successfully to anticipate trend changes but at this time is not working.
At this time, volatility is declining as price moves higher. This is normal for an upwards trend.
DOW THEORY
Major lows within the prior bull market:
DJIA: 15,855.12 (15th October, 2014) – closed below on 25th August, 2015.
DJT: 7,700.49 (12th October, 2014) – closed below on 24th August, 2015.
S&P500: 1,821.61 (15th October, 2014) – has not closed below this point yet.
Nasdaq: 4,117.84 (15th October, 2014) – has not closed below this point yet.
Major highs within the new bear market:
DJIA: 17,977.85 (4th November, 2015) – closed above on 18th April, 2016.
DJT: 8,358.20 (20th November, 2015) – has not closed above this point yet.
S&P500: 2,116.48 (3rd Nobember, 2015) – has now closed above this point on 8th June, 2016.
Nasdaq: 5,176.77 (2nd December, 2015) – has not closed above this point yet.
Dow Theory Conclusion: Original Dow Theory still sees price in a bear market because the transportations have failed to confirm an end to that bear market. Modified Dow Theory (adding S&P and Nasdaq) has failed still to confirm an end to the old bull market, modified Dow Theory sees price still in a bull market.
This analysis is published @ 10:47 p.m. EST.

Lara,
Is anything like this remotely possible?
https://www.tradingview.com/x/RNLgqtZZ/
I am really concerned that some members are still holding shorts.
The final point for stops for any shorts should have been the last ATH at 2,134. No one should be holding shorts here and now.
But you are.
This is why I have the rule, never ever trade anything without a stop loss.
For those holding shorts, I cannot help you. I wish I could. Mr Market keeps going up, OBV is bullish.
There will be a pullback, and the alternate is still viable and reasonable. Now, in normal times I would say that this deep and persistent weakness means the alternate is more likely, but divergence isn’t working and price is rising on declining volume. So with current market conditions I must judge it to be less likely.
The one thing that does seem to be working at this time is On Balance Volume, and it’s bullish.
Perhaps hedge with quick scalps on these upwards days?
Here is a question (a observation really)… why is it that all the deep corrective waves occur following a wave down?
Going Up… you never ever seem to get a deep corrective wave?
Bear markets do tend to have sharper deeper rallies than bull markets have deep corrections, that does seem to be true so far for the S&P.
But it’s not correct to state that you never seem to get a deep corrective wave.
For the wave count, the bigger picture, the start of cycle wave III back in October 2011 saw the first correction a deep 0.60 of the first wave up. So they can be deep.
Looking back further, the rise from the end of the bear market at 666.97 on March 2009 didn’t have any deep corrections, they were all shallow. When primary 2 arrived it was shallow at 0.38 of primary 1.
So it varies.
Which isn’t helpful is it.
That’s a long time ago. I guess my only way out now is some kind of black swan???
Lara, I think many of us holding shorts are just looking for a short term pull back to exit those shorts. At least that’s the boat I’m in.
Yeah, I know. My concern is it may not come in time for you.
Here is an interesting article on volume at the start of bull markets in the past.
http://www.hussmanfunds.com/rsi/rallyvolume.htm
Volume is higher than yesterday… but still overall volume is declining.
This upwards wave is pathetic. It’s just so weak. Weak in terms of volume, and strength (RSI still shows divergence), and momentum (MACD still sows divergence). But it keeps rising.
But it did begin with three days of good strong volume and price movement. So there’s that.
This weakness means it’s unsustainable maybe, or now maybe it’s a precursor to the eventual crash. With this much weakness it is my opinion that it means it is doomed to be more than fully retraced. But first, the structure upwards needs to complete. And that may take months and months….
yes Lara, I have been looking at that weakness all day and although this wave could kick in and start moving the needle soon, it should be showing better signs now. So, what kind of wave moves higher on weaker technicals….. a (B) wave. So chart II or the bear wave count begins to look consistent with that behavior. No?
Normally I’d agree with that statement. It looks like a B wave.
But we’ve seen divergence develop…. persist for a few days… then just disappear. Looks like it isn’t working right now.
I’ll go through the analysis process shortly (finishing up Gold now) and maybe my answer will be different… but so far I’m sticking with the main wave count because On Balance Volume.
I’ll stick with what seems to be working… until it doesn’t.
Certainly, the trend is up.
I am trying to learn about divergence at the moment using up to 5 different oscillators and going threw the history of price action to the divergence in oscillators! I have seen divergence on the hourly and daily charts over this last week that look good to trade and rather than trading it just writing down an entry point while I learn and as you say Lara they just are not working at all!
Another green candlestick… the higher this goes the lower the alternate goes in probability.
So this is for those still holding shorts: the alternate now has intermediate (B) at 1.48 X intermediate (A). It’s not too far off normal range, I have seen plenty of expanded flats with long B waves. This wave count is viable.
But
Volume is bullish, particularly On Balance Volume. I am giving this more weight as it was the canary in the gold mine prior to the new ATH. OBV broke above a trend line on the monthly chart BEFORE price made the new ATH.
OBV is breaking trend lines upwards. That supports the idea of a third wave up. The alternate does not have a good probability. The main wave count is definitely preferred.
I like Peters approach to this. Scalp upwards. Don’t hold in case the alternate is correct, but do expect more upwards movement as it has some support now from volume.
Target for primary 3 to end is 2,292. When it’s done then the correction for primary 4 will be expected to be shallow so that it remains above primary 1 price territory; it can’t go below 2,111.05.
So if the main wave count is correct that will be the big pullback, primary 4. And it won’t be particularly deep.
5min chart, possible buy when it touches the downward sloping trend line, should be little ii of last wave 5 up yet.
little wave iii takes off in the futures now late this afternoon into the evening the first target would be 2180, then little correction, then blow off top tomorrow. I’m liking this though as fits perfectly with the ‘major’ cycle top all the way back from the June 27th low
Yep! Yep! The banksters will definitely try to crush any remaining shorts with a blow through the upper BBs on lots of things tomorrow. Stink bids all locked and loaded! I really would like to see IWM explode completely outside the upper BB for a classic RTM trade trigger. “Bye!
When I hear everyone giving projections much higher I have to wonder……..rarely are the majority of wave technicians right at any one time. 9% in 12 days? Come on
Kinda funny isn’t it? 🙂
covering my long scalps here as I don’t like to hold anything overnight, egal was ihr Name ist
should be another good scalp long here if anyone is interested, get in about 2156.25 on Sept e-minis. It is the retracement of the little wave i up which just completed, of the larger wave 5 up; and would be touching the down trendline of the bull flag on the 5min chart. Risk about 2.5 basis points. I’ll post a chart
Another peculiarity. The indices of SPX and DJI are showing strong candles today; the ETFs, DIA and SPY are printing dojis – wassup up wid dat??!
What is crazy frustrating is, all the very big moves tend to happen when we are sleeping in the states. Tough trying to scalp moves when all the BIG moves are happening at 2:00-3:00 AM Eastern Standard Time.
That has been going on since the low in February.
It’s occurring over night because it takes less money to move & control the market in the overnight!
The surfs during the day then buy the shares the insiders/powers that be are selling (without moving the market much to slightly higher). That is called… the Fix is in. Whoever buy shares during the day will be left holding the BAG!
Don’t look at the GAP… Look at the prices after the 1st 3 to six min of trading… + the volume after that period.
I certainly agree with that Joseph. If all those overnight gaps were taken out of this market we would be at a much lower level, in fact way below ATH. The retail market is comatose.
I have a feeling they are not going to be filled sedately, but suddenly. Another overnight Brexit…albeit unexpected?!
I am not sure why this strange difference in candles of the indices versus the ETFs but movement up around the upper BB is one of the few signals that still seem to be working lately. I am eyeing the SPY July 22 215 puts expiring next week and waiting for a downside trigger to pocket a few…
VIX August call premiums are huge! Something’s up folks.
I am REALLY tempted to sell some calls against my long position but I am a little chicken….is anybody else noticing this?
Do you know what this is?
Me looking for my put options’ premiums.
LOL… Yea… could also be me looking for my leap option premiums on inverse ETF’s.
At least it appears you still have air… I on the other hand am drowning. 🙂
next little spike down will begin to add longs for scalping
There was a huge spike down to SPX 2160… did u catch it???
Lol
I’m awe struck!
yes, in spite of all my bluster on long term predictions 90% of what i do is day trade scalping. Just gets cumbersome posting 3-5 trades a day, and many here may not even want to see all that posting….so run up now most likely all the way into the close. Even went to the bank and back just now in between, living life to the fullest : )
Including the doji on July 7, to day was the sixth day of consecutive “stacked gap” opens on SPX. I have never ever seen this index behave like this…ever!!
Looks like euphoria to me…. 🙂
just going from memory here.. pretty sure it acted like this in summer of 2013
i remember that painful stair stepping higher very well
One Day… Hopefully soon, all those un-filled GAPS (and there are more than ever recorded in history) from SPX 1050 to 2168.99 will be filled!
I remember them all!
Yep! You are right. A friend of mine Jeff Clark sent me an e-mail about how so many of his trader friends were depressed by the absence of market volatility, making it almost impossible for them to execute their usual “bread-and-butter” trades. The could sense that there was something un-natural about the market’s move straight up and had no idea how to trade it. At that time I remember commentary about how so many technical indicators seemed to have gone completely haywire…deja vu all over again!
Another doji forming in the qqq’s…..macd still not flattening out….maybe after extractions tomorrow it will start to turn…qqq’s sometimes lead the spx down
…expirations…..
I don’t know about you guys but I am encouraged by what’s happening with interest rates. I decided that since I did not like playing on a field where one can keep getting ambushed by the wily banksters, to move to one that is a bit more level, namely the far end of the yield curve. That is an arena in which their pumping and jaw-boning prowess is substantially diminished. With all due respect to Joe’s legitimate points on the coming deflation, at some point the market is going to start to realize that the banks are in serious trouble, and that their trillions in bonds ( to say nothing of their derivatives portfolios) are nothing but rotting, festering, malodorous piles of detritus, many of which ought to be properly marked to market at precisely zero. No amount of flooding the market with liquidity, or jawboning about short term interest rate hikes will do one iota to change that. They can really screw bears in the short term with these ridiculous market ramps. Let’s see how these geniuses handle the pincer jaws or rising rates and rising bond defaults.
I really like this Theresa May.
Did you hear that one of the first things she did was sack George Osborne??!!
Yer Fired!!
He! He!
Vern, Any major defaults and all will move into US Treasury Bonds for cover/safety… 1st which will pull those yields materially lower.
If this is truly a reversal of interest rates the 30 Year UST Bond yield must break cleanly above the 2.60% level. It’s a long way to that atm.
Now… all non UST yields (HY Cor / Corporates / Muni’s) will explode higher at the same time UST yields go materially lower.
UST Bonds will be the last of the garbage standing!
To clarify… explode higher in Yields on non-UST.
Are you watching the 30 Yr today? 🙂
They went to far to fast… just a bounce for a couple of days. Nothing moves one way in a straight line. It went from a yield of 2.60%ish to 2.10%ish in a very short period of time. That was a BIG Move!
It will reverse… mark my words! I have been involved with bonds since I graduated college in 1982 and into my 1st job & before. It’s a strong skill set for me.
You could be right. I really like the RTM trade when anything gets to poking above its upper BB and TLT clearly did that the last few days. I am expecting at least another four or give point move down from the upper BB before a meaningful bounce…I could be wrong but that is what I am expecting…
For a quick trade off an extreme, sure… just be aware sometimes things change fast in the UST mkt.
Here is another issue. When all those bond defaults begin, no doubt the Central Banksters are going to try to re-liquefy the market by buying up the garbage as they did during the last crisis, further bloating their already bloated balance sheets. They will have to service all that new paper at the elevated rates due to all the panic in the market. If they don’t buy this toxic material the panic will spread even faster I would imaging. It seems to me a no-win situation for the banksters…
They don’t have the authority to buy defaulted bonds. At least the US Federal Reserve does not… they can only buy investment grade rated bonds BBB or higher.
Uh! Oh! You mean they would have to let the corporate bond market implode?
I am a bit surprise to hear that as I thought they had picked up quite a few CDS and mortgage backed bonds that were questionable. The whole point of the FED as buyer of last resort was to get all the toxic stuff off the banks’ balance sheets and stuff them full of brand spanking shiny new treasury bills was it not?
Furthermore, who is to say the FED is in any way following the rules? They have never been audited so God alone knows what they are harboring under the covers!
Yep, Mortgage Backed Bonds… FANNIE MAE and FREDDIE MAC funded mortgage backed bonds.
There was a difference between that and the privately issued mortgage backed bonds.
Agree Verne, I have added to long bond shorts today..
Awesome! I think right now it’s the smart money trade Gary. As more and more folk start to figure that out I think I think it has the potential to be as explosive the metals trade was earlier this year. We may get a brief interruption with a FED rate cut when all hell starts to break loose but I think the pause will be short lived…
New multi-month low in VIX!!
Back up the truck people!! 🙂
Shorting US Treasuries for anything more than a very short term trade is HIGH Risk!
30 Year Treasury bond Yields will go below 2.00% before they go above 2.50% in yield.
You can short the shit out of other types of long bonds… High Yield… Then Corporates… Then Muni’s.
I think we are in uncharted territory, with global low or negative rates. At these levels a very small increase in bond rates will force a significant amount of selling. If we are in a liquidity challenged environment then there will no better source of liquidity than bonds held in portfolio. On the long end I think participants will want a higher premium to purchase debt. This is an upside down world.
Agreed… But you have to make a distinction.
UST Bonds are a different animal then High Yield… HY a different animal than Corporates & Muni’s.
Yields on UST Bonds can go in one direction and Yields on everything else another. Just look at the Fall of 2008 as a glairing example!
Well, from Dec of 2008 to the bottom in the S&P March 2009 the 30 year went from 2.5% to over 5% even with several CB interventions. But now we have had an extremely prolonged period of low and negative rates with a commensurate ballooning of dollar demonated debt. Even a small deflation of that debt bubble will cause all rates to increase just as they did in 2008….only bigger.
You should be looking more at 9/1/2008 to 12/31/2008… That is the period when the shit hit the fan! The period all the banks & other went under.
And just like always… the UST bond market reacted well before the stock market bottomed in March 2009 to the recovery.
Just as the Bond market is reacting now with low 30 year UST yields before the real stock market sell off starts.
Yeah. I am actually thinking we are going to see double digits in the 30 year yield before this is all said and done folks…
You hit the nail on the head! At these levels, it would not take much of a rate increase to inflict incredible damage on a bond portfolio. I agree that UST may initially see a safe haven trade in a flight to safety but I think the FED will ultimately be forced to raise on the short end of the curve, dragged kicking and screaming all the way to be sure but dragged no less. At that point it is game over!
Agree Vern, really I don’t believe that CBs actually control rates over the long run. They lag the market not lead it. The bond market is way to large for them to be able to control it.
CB’s only control the Fed Funds Rate… That’s it! The market control’s the rest of the yield curve.
Unless they are purchasing bonds through QE. The Fed is not currently in the QE business… that ended in 2014.
I hear ya Joe. The term “very short term trade” is a technical descriptor that applies to just about everything I do in this bizarro market these days! Remaining in this market too long could find you with your shorts down around your ankles and your you-know-what exposed…! 🙂
The SPX 1 min chart looks like the market is being held up by some kind of alien levitation!
Found Yellen’s printing press.
Is that in her basement???
bedroom
Now.. that is an insane image! Why did you do that to me? I am not going to be able to sleep at all now!
LOL
I’m not sure which is funnier Joe, Peter’s pic or your comment
ROFL
And an extra one in the bathroom for good measure!
Now that’s just weird…
🙂
Not at all…it’s just what is commonly known as “Privy Printing!”
he! he!
LOL!
If Main Hourly count above is in progress, I think we are still working on minute wave(iii).
I’m going long for a scalp at about 2154-2155 on futures, should be end of the bull flag on 5min chart soon. Maybe 10-15mins from now. Possible throw over to the downside with these flags, note.
Good plan Peter, Too many options right now to take longer term positions. Added to bond short today. This really does not look like a 3d of a 3d IMHO. I am leaning toward the Chart II counts but not enough to trade it.
Doing something a little different. Buying actual shares of VIX. I am not sure how long the banksters are going to RAMP.
I am sure of one thing though…when they are done, volatility is going to RIP!
I am not going to be loosing any sleep over decay of option premium on this one and will execute a set-it-and-forget-it trade on volatility this time around. Once the party gets going, short term trades on the Unicorn will always be a more robust option, sans the time decay of waiting for the worm to turn…
It is starting to look like that reverse split on the 25 is going to execute either shortly before, or shortly after something significant…
What is the reverse split date again?
July 25. If UVXY is trading in the five dollar range at that time, assuming this move lasts that long, the RS will take the price to around 20 just before it explodes higher during the ensuing corrective move. It has the potential to be really hilarious as those who have a knee-jerk reaction to shorting it will probably continue with business as usual after the split. If we get the pull-back before July 25 it could go back to the 10.00 area with the split then taking it to around 50.00
An SPX pull-back before the split will make it an excellent short candidate as it would be a wave four with one more wave up to go. If the top is put in before the split, shorting it is going to result in a whole world ‘o pain for those who do.
How to tell the difference?
BBs of course.
If it punches through the upper BB BEFORE the split, chances are new 52 week lows are in its future.
If the BBs dilate and price remains contained at the time of the split, I think you will be shorting at your own considerable risk…. 🙂
Looks like a good bet…..vix usually goes over 20 twice a year or so and down to10 – 13 twice or so too. That’s a 50 % gain.
Tick tock….
http://money.cnn.com/data/fear-and-greed/
Nice. I like the put to call ratio. When that gets around .7 over 10 days usually have a fair sized hiccup.
Good morning all.
I am on a sabbatical of sorts until I return in August from my vacation celebrating my 40th wedding anniversary. I just want to chime in on the conversation regarding requests for additional charts and comments etc.
Vern, I and several others have been here for many years. I started in late 2011 or early 2012. We have been through much together and I think we have developed some surprisingly deep relationships, friendships. As such, we are not only somewhat protective of one another but significantly so of Lara. We have a genuine care for the well-being of one another beyond just these market and trading conversations. We will be protective of Lara even though she is a big girl and hasn’t asked for any protection.
So, when there are significant developments in the markets especially those that can cause stress / tension and emotions like these last two weeks, it is all our responsibility to ease off of demands of Lara as well as being extremely careful and considerate with our posting here.
Enough said on that topic.
One more point and I am gone for the day. We remind ourselves here, “If you have to ask is this a third wave, it probably is not.” Well, this current upwards move having started at 1810 in February and corrected to 1990 in June, looks to me like it is now in a third wave. Just when I see some weakness, I wake up to find the SPX futures up 16+ points for no apparent reason. This looks like a third wave to me and I do not need to ask if it is.
I offer this as a friendly caution to those remaining short that the main weekly count has a target of 2500 on the SPX.
I hope you all have a great day and a great weekend. I am feeling much better and more optimistic every day. See you soon.
Blessings,
Rodney
PS – Thanks Lara for the unrelentingly honest and forthright analysis and commentary. You stick true to the adage “Count what I see, not what I may want.”
HiYA Rod!
So good to hear from you.
Forty!!
Wow!!
I’ve got a ways to go to be in the same league as you so far as marital longevity is concerned. I will be definitely consulting you about the lessons of wisdom you have acquired along the path. Congrats my friend!
Don’t be a stranger now y’hear? 🙂
Congrats Rodney – have a great vacation 🙂
I couldn’t resist…
To whom it may concern…
Jules original post was nothing rude or unpleasant…this could have been handled much more professionally.
Just because some of us have been here for some time that does not give us a green light to cyberbully new members. Keep it cool.
Jack
PS1 – Jules congrats on the baby
PS2 – Congrats Rodney
Thanks Jack! they are cute but im in sleep depravation mode right now…
Congrats Rodney on 40years! thats cool!
Let me know if you are ever in Portland OR….
Thanks Jack. I hear you and agree, cyber bully or intimidation anytime is not okay. If I am ever perceived like that, I apologize and hope someone would gently point it out to me. Longevity of membership gives me no more rights or privileges on this site than the person with a one week subscription.
Thanks for all the congrats! My wife is a saint and she deserves all credit for our making it this far. She is the most forgiving, loving and wisest person I know or have ever met. In my early days of this life, I was a jerk and worse. I came from Chicago and Cicero where Al Capone established the most powerful mob presence anywhere in the world before or since. In fact, …. well, I better stop before I get into trouble. I was a hard man from a hard background. My wife is a saint.
Jules, congratulations on the birth of a child and welcome to the EWSM blog. You’ve been here some time and I appreciate your comments. I have five children and my quiver is full of blessings.
Now, back to the sabbatical. (he he)
You da man Rodney 🙂
That’s wonderful Rodney 🙂 Well done on making it 40 years! A huge life achievement that is.
congrats Rodney! you’ve been married longer than i have been alive 🙂
enjoy the anniversary
Now you are starting to make me feel old. I still can live in the mountains on my own. Well, I keep telling myself that.
Thank you Rodney for the very kind words.
Feeling all warm and fuzzy now, I have some very lovely members here. I’m actually amazed you’re all sticking with me after a new ATH, but here we are.
I was thinking back at that point in time, it was after hours. I had a large short position and watched it stopped out as price made a new ATH. I had a visceral physical reaction, of revulsion. I couldn’t act.
I knew two things: that there would be a pullback at that point. There was very short term. Then price would start to rise… and drift up. And it has.
But I couldn’t trade it. My revulsion was too strong, I was shellshocked. What I should have done was flip my thinking immediately and jump in long.
Trading is mostly psychological. If I’m ever in that situation again I think I’ll have a strategy planned out BEFORE it happens and follow the plan. That’s how I think I’ll manage such a situation next time.
Small bull flag seen on SP500 futures 30min chart, looks like going higher yet
15min chart showing an a-b-c now of a little iv down, still wave v up yet to go. Would fit nicely then with the major cycle date of today/tomorrow. 2188 is a 1.618 fib point for one target
noting above is SP 500 futures chart, right now not following that close on the very short term bases as the SPX
josepha look at the chart that i put i belive we going to 2000 hope it
Print is too small to read… even at 400% zoom. Yes if that is the level of the lower line that would be a resistance point.
After much thought and consideration… my best option here at ~ES 2168 this morning is to stay positioned as I currently am and have been.
Everything I know & feel says to me this market is extremely overvalued, in bubble territory and I just can’t convince myself otherwise no matter how much additional review I do. I have no margin trades on… so that is it. One big Mexican standoff between the market & myself!
So Mr. Market… go F yourself… you are not fooling me with this FINAL CON Job your putting on.
Good Luck All!
i agree with you my friend joseph im exactly in the same positon as you i stay in short and what will be will be
Its testing times and hopefully will get an oppurtunity to unwind some of those trades
I personally covered my shorts with longs at 2134 when we broke the old ATH. I have just started closing those which still leaves me with a pile of margined shorts. The decision has to be if the bull count is correct at what point I close those shorts (Average is 2040). The problem I have is physicologically I feel we are in a Bear Market and want to hold of but need to remember this is trading and not to let my emotions cloud my judgement
Suppose we would all be millionaires if it was easy
Once again thanks Lara for all your analysis and thanks for this forum. I know emotions get us all but the banter and idea sharing has definitely made the probability of me being on the right side of the trade better
Paresh
What will be will be… a great line! Exactly how I feel right now!
izak… I now feel good about what I decided. Feel good for the 1st time in days.
So… Volume much higher than yesterday at this time… This overnight Bankster POP of SPX Futures is going to reverse in a big way today in the cash market SPX! The market fixers will be over run soon!
Take that market!
Edit:
Actual vacation for me starts mid next week… But I should stay away from this board for the sake of my sanity! But just when I thought I was out… they pulled me back in!
Good Luck all!
What a great set-up to short right now… But I am maxed out short already can’t take advantage at this level.
Going Short…
“Set me free, why don’t you babe…! You just keep me hanging on…!” 🙂
https://www.youtube.com/watch?v=KKQbcJyVKR0
Great song!
the moment we can’t take the pain any more and sell our shorts is when it will drop like a rock.
A loss isn’t a loss until you sell!
No Margin… you never have to sell. There is NO WAY in HELL we are that wrong where by we have no choice but to sell!
We will have an opportunity to re-evaluate at much lower levels than here on what to do.
Time is my only issue and that is with my leap option positions. 1st one expires 1-2017
aa
hi to all friends i need some advice as i shorted the s&p and i want to go out from that short i just wait for correction to 2100 level about to close that short but each day mr s&p go up and more and im afried to lose everthing .i will be very thankfull what you thinks about the good level to close my short position i entered to short in 2020 level on the s&p on etp short *3 please help 🙂
Vern, I do agree with you. If someone just makes an EW count by his own, he or she will appreciate the effort needed to provide those time consuming analysis. Lare is doing a great job, especially in this period of time when things are amazingly erratic.
Since last Friday, Lara re-evaluated tens of alternatives to provide us with adjusted EW analysis in order to keep track of this rally.
No offense anyone neither. I am deep underwater and nerves are triggering new highs as well 🙂
You guys pestering Lara about additional charts please be considerate and cut her some slack. She has already indicated she will post them when she has the time. No offense but the badgering is really impolitic. Thank You! 🙂
Verne…last i checked your name is not Lara! Im new to site and not sure where she would put it if she did! Im not pestering her. Keep your remarks courteous if you may
Trust me. You have not seen me NOT being courteous. I did get a bit annoyed as on the earlier thread (perhaps you did not read her response) someone else asked about the NDX analysis and she indicated that she had been working very long hours to do the regular analysis and would post the extra analysis when she could. We are paying for SPX. Lara occasionally provides additional charts when she can. To have others insisting that she provide, at their behest, additional services that we are not paying for is crass. And you are right. My name is not Lara. Call me “old-fashioned”.
Thanks Verne! I didnt check every comments yesterday. Dealing with a new baby so didnt see her earlier response! However, there is a nicer way to mention that to me than what you first wrote! I didnt appreciate your comments since they were not addressed to you and my intention is not to pester Lara. Anyways….i will send her a mail so she can point me to it if she does it since that seems to bother you.
No problem Jules. Sorry if I came on a bit too strong in that first post. I should have realized that you may have missed her first response.
And welcome aboard and congrats on the new addition!
It’s okay guys.
I will get to it when I have the time, honest.
Thank you Verne for your support. And to Jules, OMG dealing with a new baby, I think I’ll be cutting you some slack 🙂 And wishing you best of luck.
As you were.
Rising interest rates will deliver a pythonic squeeze to equities markets, slowly constricting the hose gushing limitless CB liquidity. Loaded TLT short after oversold bounce yesterday. Long TBT is equivalent trade and I think we are looking at a significant trend change. As rates continue to rise, markets may initially respond slowly but respond they will. Oil seems to be another candidate for the dark side trade and looks like it is executing its counter-trend bounce today.
There are lots of leveraged contracts to unwind in Gold and Silver and I think the correction is going to sharp and deep. I plan on going very long after the upcoming correction, along with a Gold subscription to Lara’s analysis!
I expect we now get a final wave up in SPX before the first decent pullback…
Woo Hoo!
Your on a roll! Second again for me. 🙂
You’re both rollin’
Hi Lara, did you have time today to update on RUT and nasdaq?
Thannnnnnku?
Nope. Not today.
I don’t have a wave count for RUT anyway.
Here’s my Nasdaq weekly bull wave count.
thnk you Lara! much appreciated. Have a great day