The two daily Elliott wave counts today are judged to have about an even probability.
Assume the trend is the same, until proven otherwise.
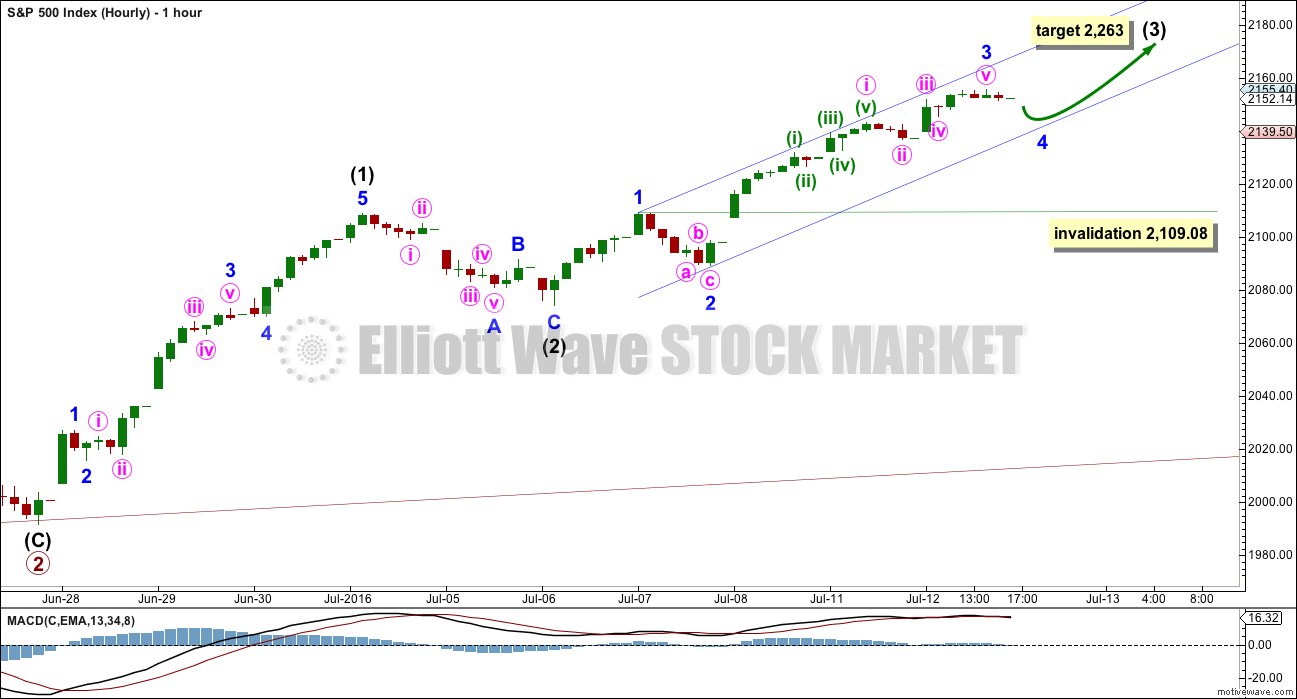
Summary: In the short term, assume the trend remains up while price is above 2,136.32. There is some bullishness today from volume and On Balance Volume to support this view. The target is at 2,263. A new low below 2,136.32 would add some confidence to a trend change, and a new low below 2,109.08 would confirm it. Once a trend change is confirmed the target would be at 1,963.
Last monthly chart for the main wave count is here.
New updates to this analysis are in bold.
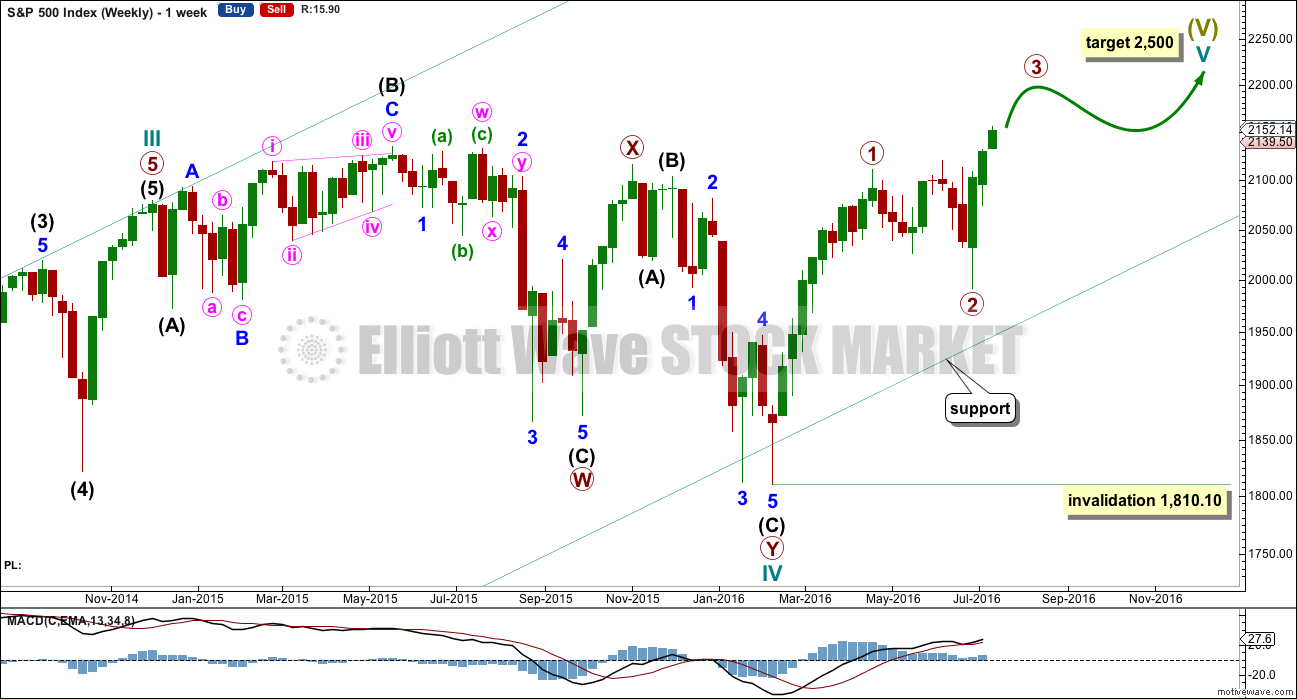
WEEKLY CHART
Cycle wave II was a shallow 0.41 zigzag lasting three months. Cycle wave IV is now seen as a more shallow 0.28 double combination lasting 14 months. With cycle wave IV nearly five times the duration of cycle wave II, it should be over there.
After some consideration I will place the final invalidation point for this bull wave count at 1,810.10. A new low below that point at this time would be a very strong indication of a trend change at Super Cycle degree, from bull to bear. This is because were cycle wave IV to continue further sideways it would be grossly disproportionate to cycle wave I and would end substantially outside of the wide teal channel copied over here from the monthly chart.
Cycle wave I lasted 28 months (not a Fibonacci number), cycle wave II lasted a Fibonacci 3 months, cycle wave III lasted 38 months (not a Fibonacci number), and cycle wave IV lasted 14 months (one more than a Fibonacci 13).
If the target for cycle wave V is for it to be equal in length with cycle wave I, then it may also be expected to be about equal in duration. So far cycle wave V is in its fifth month. After this month, a further 23 months to total 28 seems a reasonable expectation, or possibly a further 16 months to total a Fibonacci 21.
The daily charts today are swapped over, but it is my judgement that they have a close to even probability. For this reason, they are labelled wave counts I and II. Wave count I should be preferred while price remains above 2,109.08. If price moves below 2,109.08, then wave count II would be confirmed.
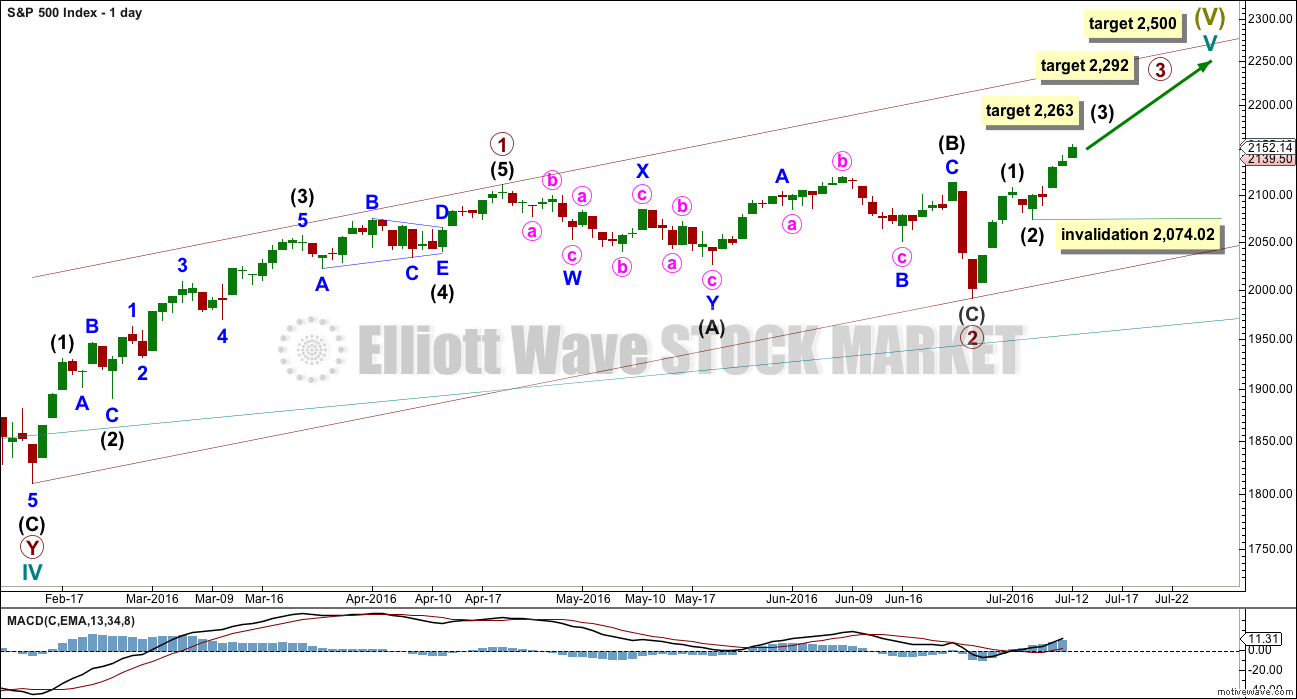
DAILY CHART I
It is possible that primary wave 2 is already complete as a shallow regular flat correction. Primary wave 3 may have begun.
At 2,292 primary wave 3 would reach equality in length with primary wave 1. This is the ratio used for the target in this instance because primary wave 2 was relatively shallow and it fits neatly with the high probability target of 2,500 for cycle wave V to end.
Primary wave 3 may only subdivide as an impulse. So far within it intermediate waves (1) and (2) may be complete.
Within intermediate wave (3), no second wave correction may move beyond its start below 2,074.02.
At 2,263 intermediate wave (3) would reach 1.618 the length of intermediate wave (1).
There is some support today for upwards movement from increased volume, and On Balance Volume. This wave count has a reasonable probability at this stage.
HOURLY CHART I
Intermediate wave (3) should still be incomplete for this wave count. It has not lasted long enough nor moved far enough above the end of intermediate wave (1).
At its end, intermediate wave (3) should be far enough above intermediate wave (1) to allow for subsequent room for downwards / sideways movement for intermediate wave (4) to unfold and remain above intermediate wave (1) price territory.
Within intermediate wave (3), minor wave 4 may not move into minor wave 1 price territory below 2,109.08.
Draw a small channel about the impulse unfolding upwards as shown. Minor wave 5 may end about the upper edge.
Tomorrow’s session may begin with a little downwards / sideways movement for minor wave 4. Because minor wave 2 does not show on the daily chart, minor wave 4 should not show on the daily chart if intermediate wave (3) is to have a typical look. If tomorrow prints a red candlestick, then this wave count would substantially reduce in probability and wave count II should then be preferred.
DAILY CHART II
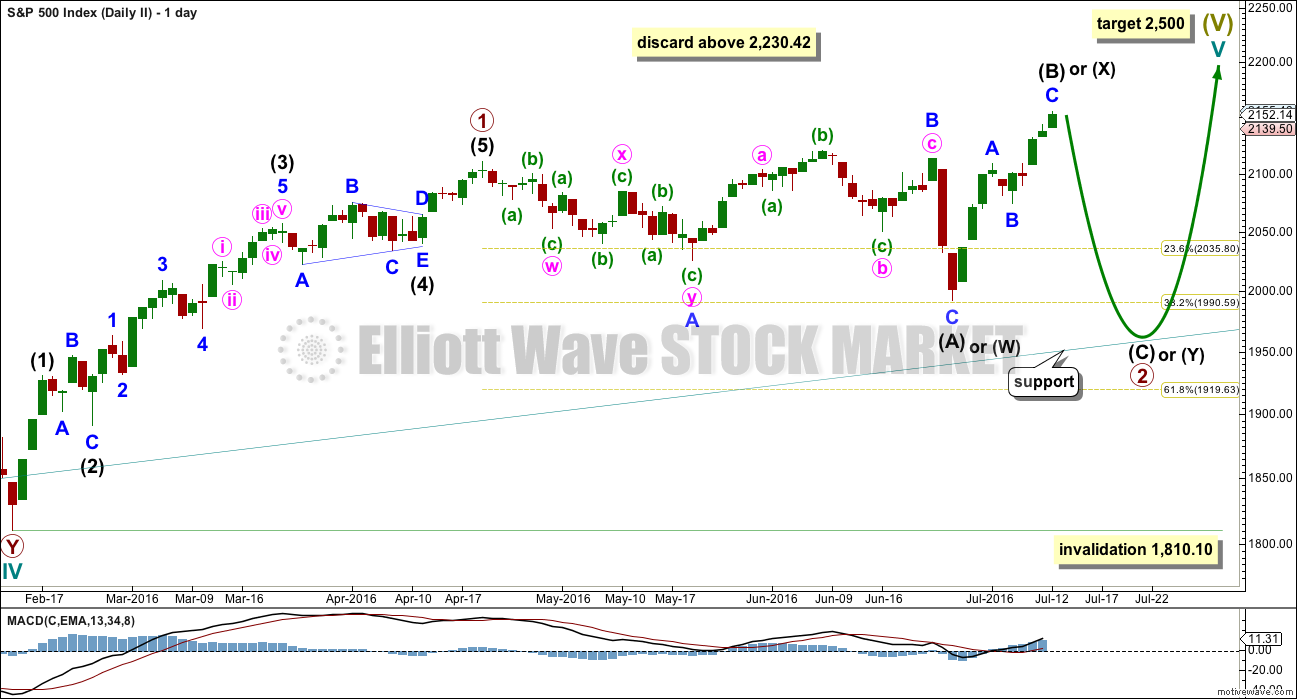
This wave count still has a reasonable probability, very close to even with wave count I.
The common length for intermediate wave (B) is from 1 to 1.38 the length of intermediate wave (A), giving a range from 2,111.05 to 2,156.41.
The idea of a flat correction should be discarded when intermediate wave (B) exceeds twice the length of intermediate wave (A) above 2,230.42.
When intermediate wave (B) is complete, then a target may be calculated for intermediate wave (C) downwards. It would most likely end at least slightly below the end of intermediate wave (A) at 1,991.68 to avoid a truncation and a very rare running flat. It may end when price comes down to touch the lower edge of the channel copied over from the monthly chart.
Primary wave 2 may also be relabelled as a combination. The first structure in a double combination may be a complete regular flat labelled intermediate wave (W). The double would be joined by an almost complete zigzag in the opposite direction labelled intermediate wave (X). The second structure in the double may be a flat (for a double flat) or a zigzag to complete a double combination. It would be expected to end about the same level as the first structure in the double at 1,991.68, so that the whole structure moves sideways.
An expanded flat for primary wave 2 is more likely than a double combination because these are more common structures for second waves.
HOURLY CHART II
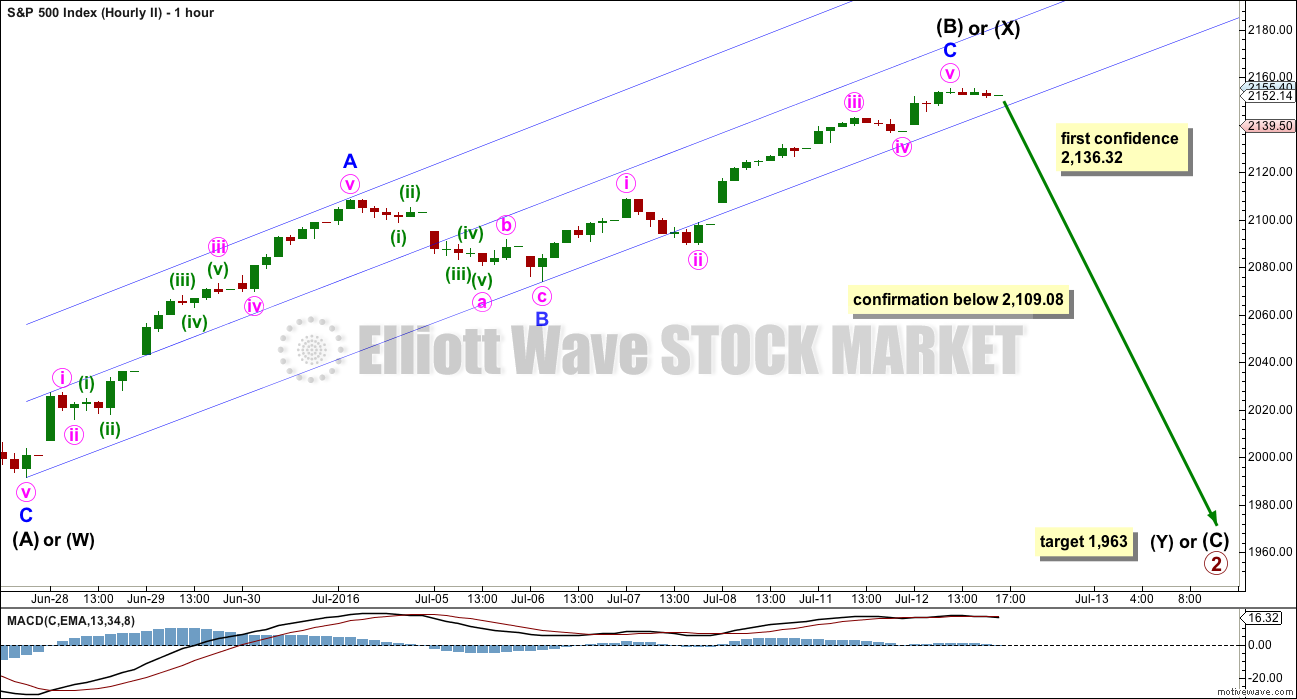
Within minor wave C, minute wave iii is 2.99 points short of 1.618 the length of minute wave i. Minute wave iv may not move into minute wave i price territory below 2,109.08.
Minor wave C continued higher, past the target calculated at 2,146. There is no Fibonacci ratio between minor waves A and C, and within minor wave C there is no Fibonacci ratio for minute wave v to either of minute waves i or iii. This is why the target calculated was inadequate.
Intermediate wave (B) is now 1.37 the length of intermediate wave (A), within normal range of 1 to 1.38. For this wave count, it would be most likely now that upwards movement would be over here so that intermediate wave (B) remains within normal range.
Draw a channel about the upwards movement. When price breaches the lower edge of this channel with clear downwards movement (not sideways), that shall be a very early indication that intermediate wave (B) or (X) may be over. Price confirmation would still be required.
Some confidence may come with a new low below 2,136.32. At that stage, downwards movement could not be a second wave correction within minute wave v, so minute wave v would have to be over if it is correctly labelled.
Earliest price confirmation would come with a new low below 2,109.08. At that stage, downwards movement could not be a fourth wave correction and so minor wave C would have to be over.
Final price confirmation would come with a new low below 2,074.02. At that stage, downwards movement could not be a second wave correction within minor wave C. At that stage, also the alternate below would be invalidated.
At 1,963 intermediate wave (C) would reach 1.618 the length of intermediate wave (A). This target assumes that primary wave 2 is an expanded flat. If it is a combination, then the target may not be met. Downwards movement could subdivide as a zigzag and end close to 1,991.68, so that a combination ends with an overall sideways movement.
BEAR WAVE COUNT – MONTHLY CHART
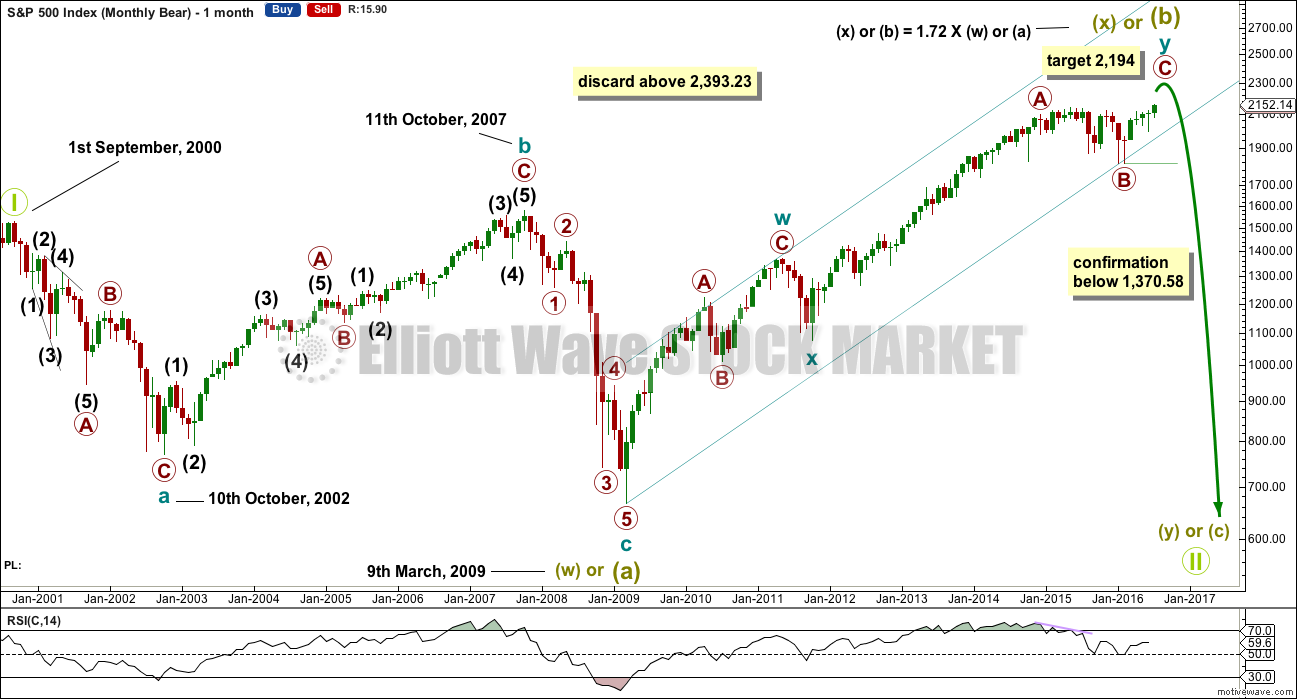
It would still be possible that a Super Cycle trend change is close if Super Cycle wave (b) (or (x) ) is subdividing as a double zigzag.
However, the expected direction and structure is now the same short and mid term for this idea as it is for the main wave count.
Within the second zigzag of cycle wave y, primary wave C must complete as a five wave structure.
So far Super Cycle wave (b) is 1.72 the length of Super Cycle wave (a). This is comfortably longer than the normal range which is up to 1.38, but still within the allowable convention of up to 2 times the length of wave A.
Above 2,393.23 Super Cycle wave (b) would be more than twice the length of Super Cycle wave (a). Above this price point the convention states that the probability of a flat correction unfolding is too low for reasonable consideration. Above that point this bear wave count should be discarded. The same principle is applied to the idea of a double combination for Grand Super Cycle wave II.
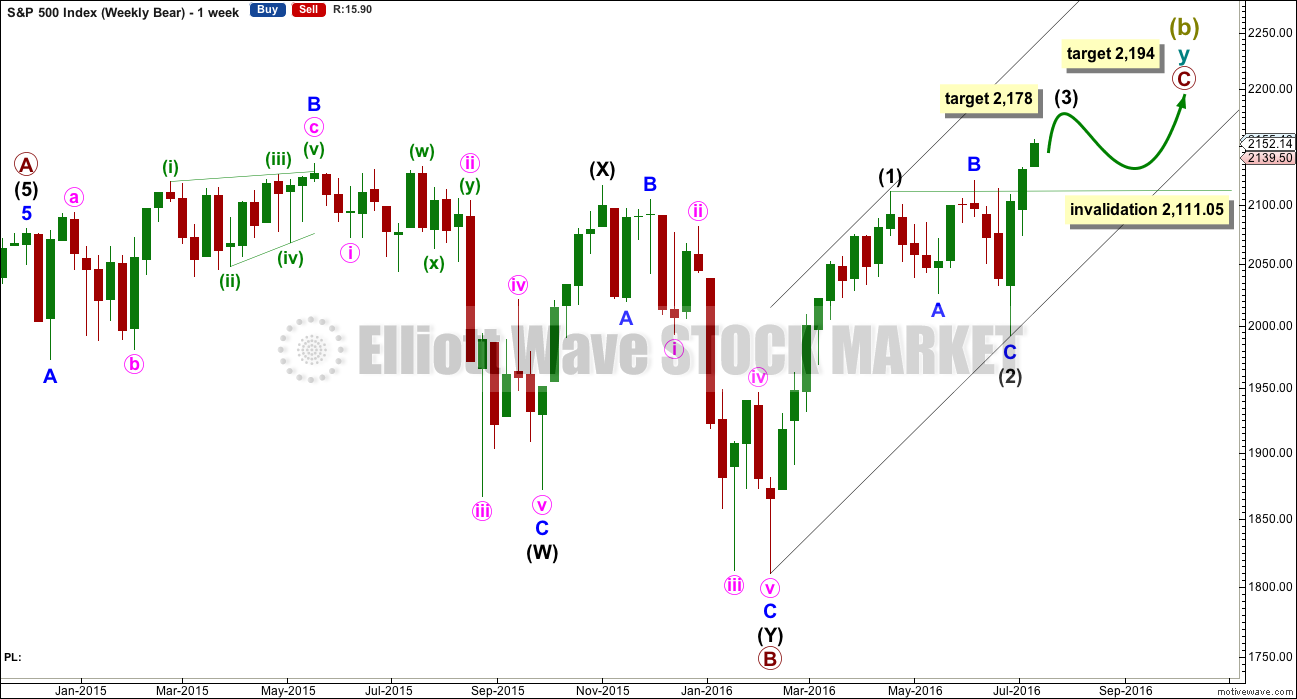
BEAR WAVE COUNT – WEEKLY CHART
A five wave structure upwards would still need to complete for primary wave C. So far upwards movement is a very strong three wave looking structure. Trying to see this as either a complete or almost complete five would be trying to fit in what one may want to see to the waves, ignoring what is actually there.
At 2,178 intermediate wave (3) would reach 0.618 the length of intermediate wave (1).
Thereafter, intermediate wave (4) may move sideways for a few weeks as a very shallow correction. Thereafter, intermediate wave (5) would most likely make a new high. At 2,194 primary wave C would reach 0.382 the length of primary wave A. This final target is close to the round number of 2,200 and so offers a reasonable probability.
If price reaches 2,200 or close to it, then this idea would again be assessed, and an attempt made to determine its probability. The situation between now and then though may change.
The important conclusion is more upwards movement is extremely likely, as a five up is needed to complete.
There is one other wave count which will be added to analysis tomorrow, but that too long term is bullish. It relies on the rarest of all Elliott wave structures, so it is not necessary to publish it immediately and should not be seriously considered.
TECHNICAL ANALYSIS
DAILY CHART
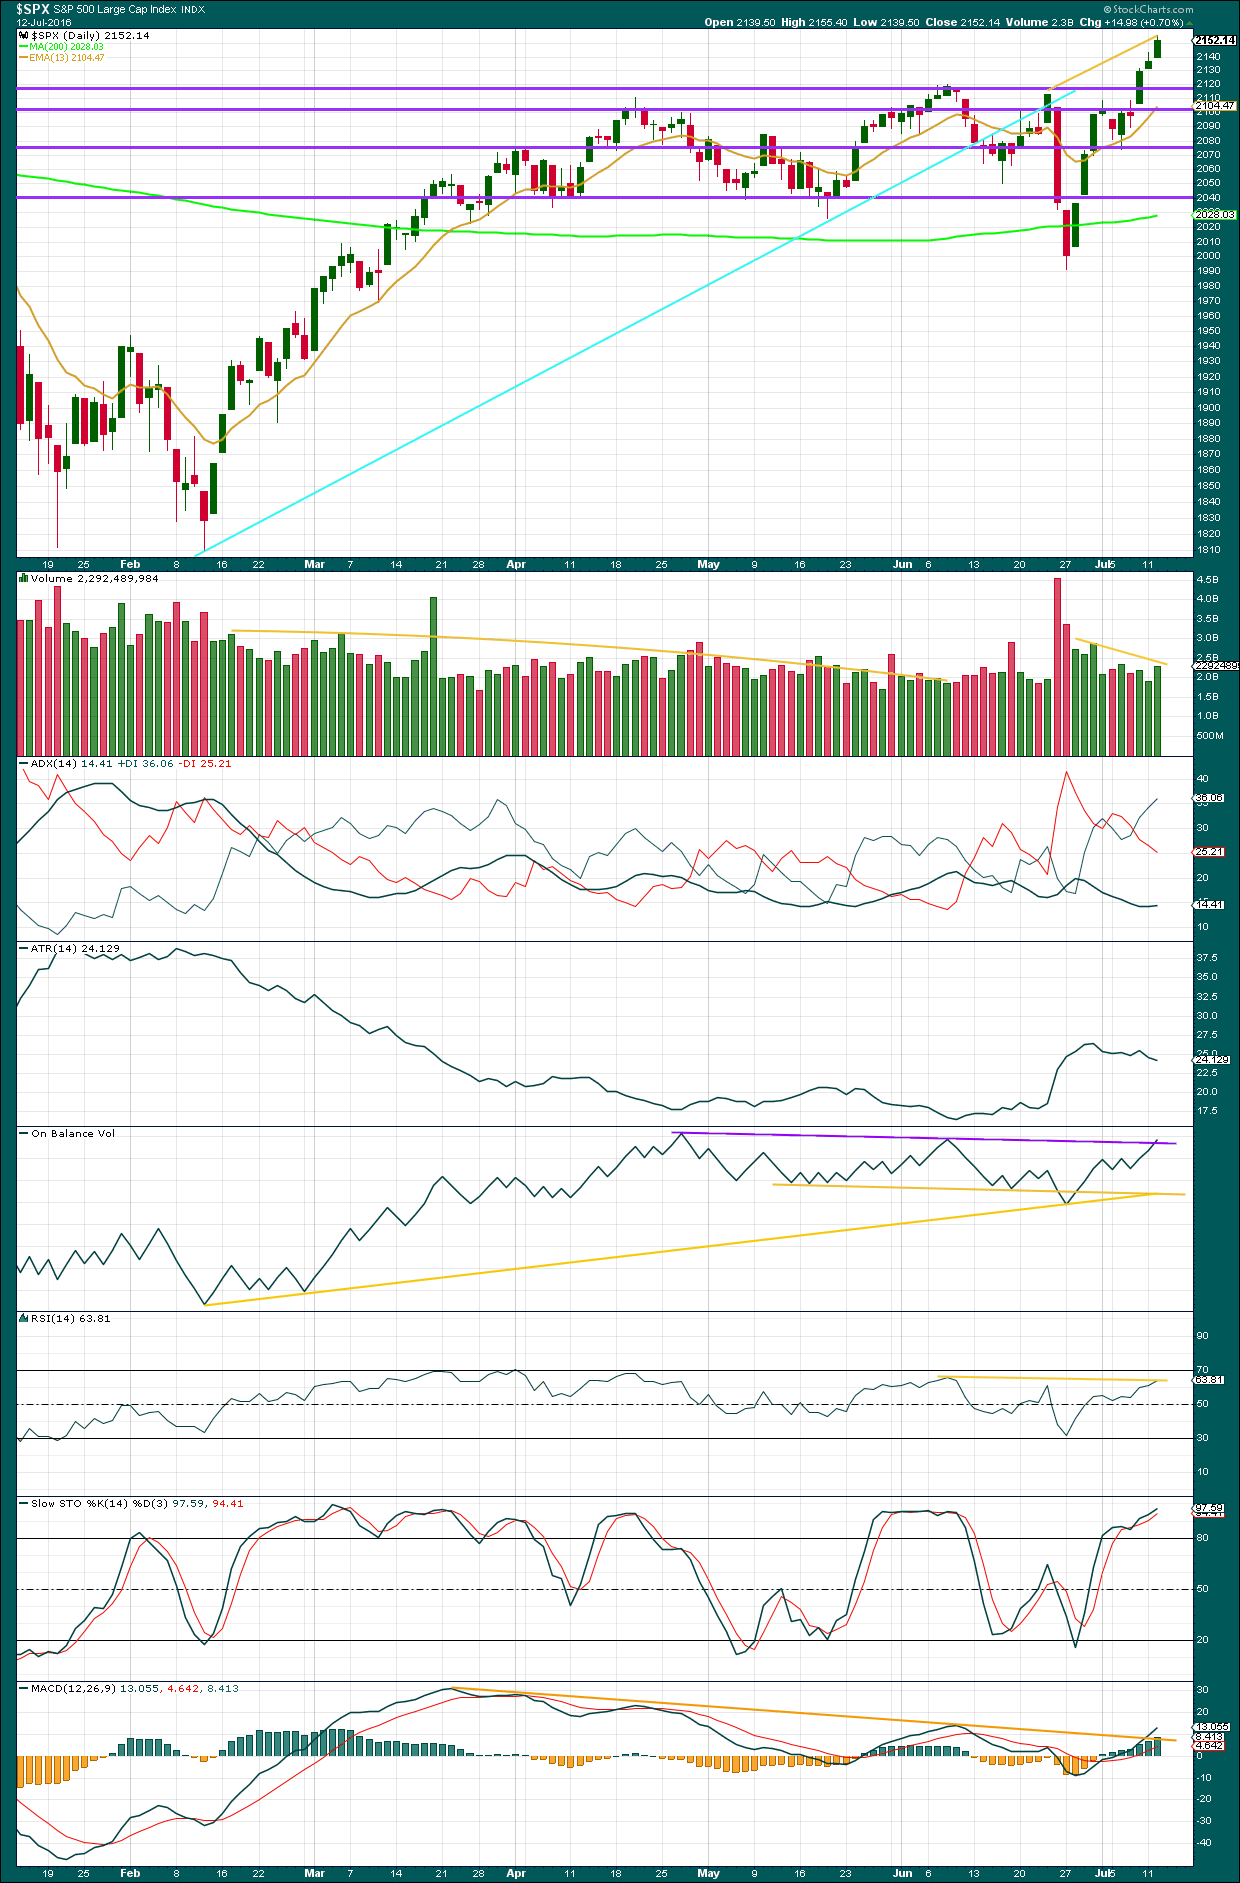
Click chart to enlarge. Chart courtesy of StockCharts.com.
Upwards movement today came with some support from volume. Volume for the day was higher than the prior two upwards days. This supports wave count I. However, volume is still lighter than the start of this upwards wave nine days ago. Overall, volume is still declining as price is rising.
At the daily chart level, On Balance Volume today has broken above the purple trend line. At the monthly chart level, OBV has given a bullish signal, and now also at the daily chart level. This bullishness should be taken seriously. It is possible that price could continue to rise for some time before a pullback. This supports wave count I.
ADX is now increasing indicating an upwards trend. ATR still disagrees. There is again something wrong with the trend. Normal trends come with increasing ATR, not declining. This adds some doubt to the bullishness from volume and OBV. This supports wave count I *edit: wave count II.
There is still divergence between price and RSI from the high back on 8th of June. On that date RSI was at 65.98. Price today has made higher highs, but RSI has failed to make corresponding new highs; it is lower at 63.81. This divergence is bearish. Normally, this would be a strong indicator of a trend change either now or very soon indeed, but at this stage no trend change has occurred. This divergence supports wave count II.
There was divergence with price and Stochastics in the past few days, but this has now disappeared. Divergence between price and Stochastics is unreliable. Stochastics is now overbought, but this oscillator may remain extreme for reasonable periods of time during a trending market.
MACD has breached the trend line which showed divergence with price. This is a small bullish signal. There is still double divergence between price and MACD from the highs of 20th of April to 8th of June to now, the 12th of July. This indicates the current upwards movement from price is lacking in momentum and is weak. This divergence supports wave count II.
On balance, with some support for upwards movement today from volume and a bullish indication from On Balance Volume, it is my judgement today that wave count I has slightly more support from classic technical analysis than wave count II. Wave count II is entirely possible still, but its support comes from divergence with indicators, not from volume. More weight should be given to volume than divergence because too often divergence can disappear.
VOLATILITY – INVERTED VIX DAILY CHART
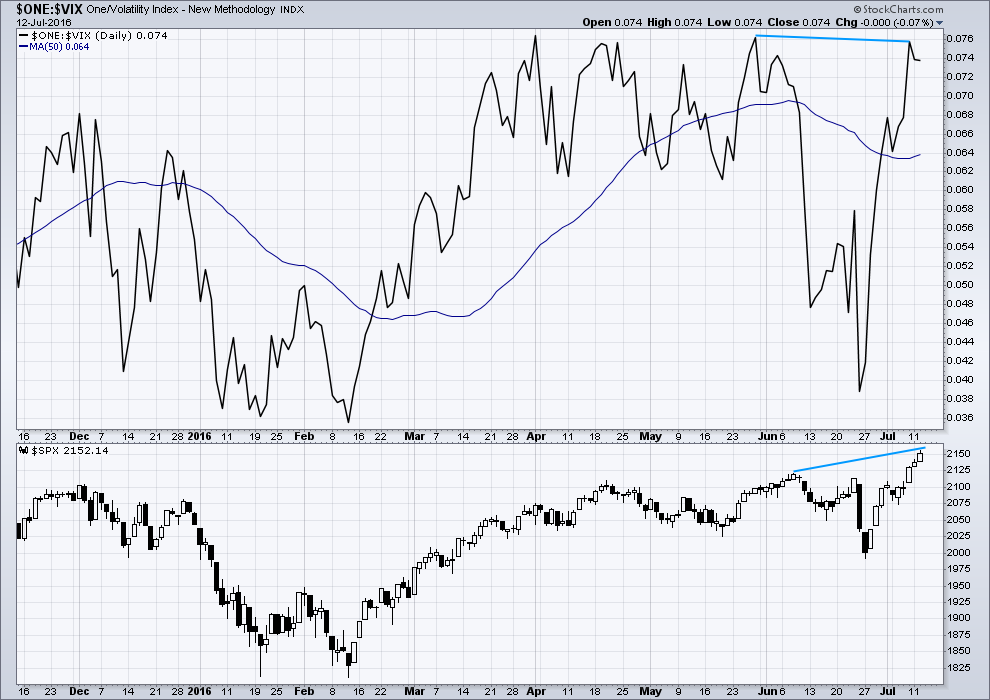
Click chart to enlarge. Chart courtesy of StockCharts.com.
VIX from StockCharts is inverted. As price moves higher, inverted VIX should also move higher indicating a decline in volatility which is normal as price moves higher. As price moves lower, inverted VIX should also move lower indicating an increase in volatility which is normal with falling price.
Along with multi month divergence between price and inverted VIX, there is also short term divergence (blue lines). This indicates weakness in price and supports wave count II.
However, there was a multi day instance of divergence between VIX and price some days ago on 1st of July and this divergence failed to be followed by strong downwards movement. It may be that at this time divergence between price and VIX is no longer reliable, or it may be that it is but the trend change to come is still some days away. It does not appear to be followed by a quick change.
DOW THEORY
Major lows within the prior bull market:
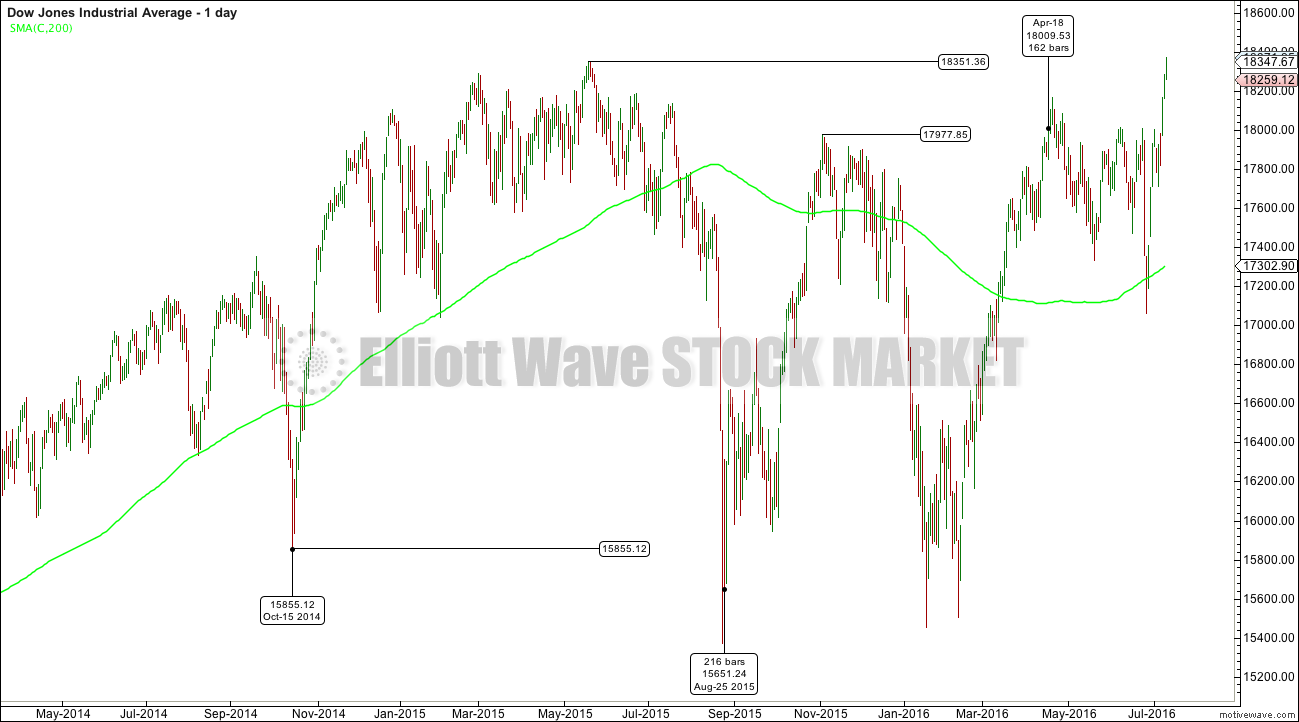
DJIA: 15,855.12 (15th October, 2014) – closed below on 25th August, 2015.
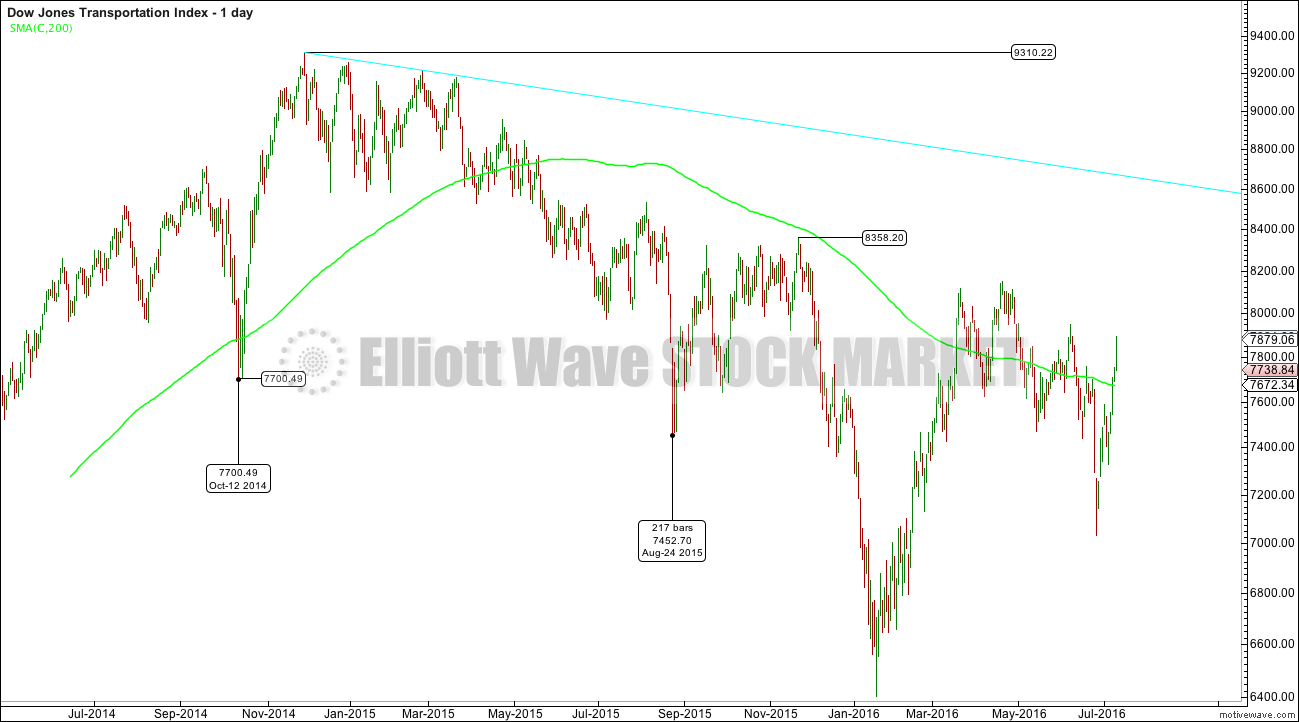
DJT: 7,700.49 (12th October, 2014) – closed below on 24th August, 2015.
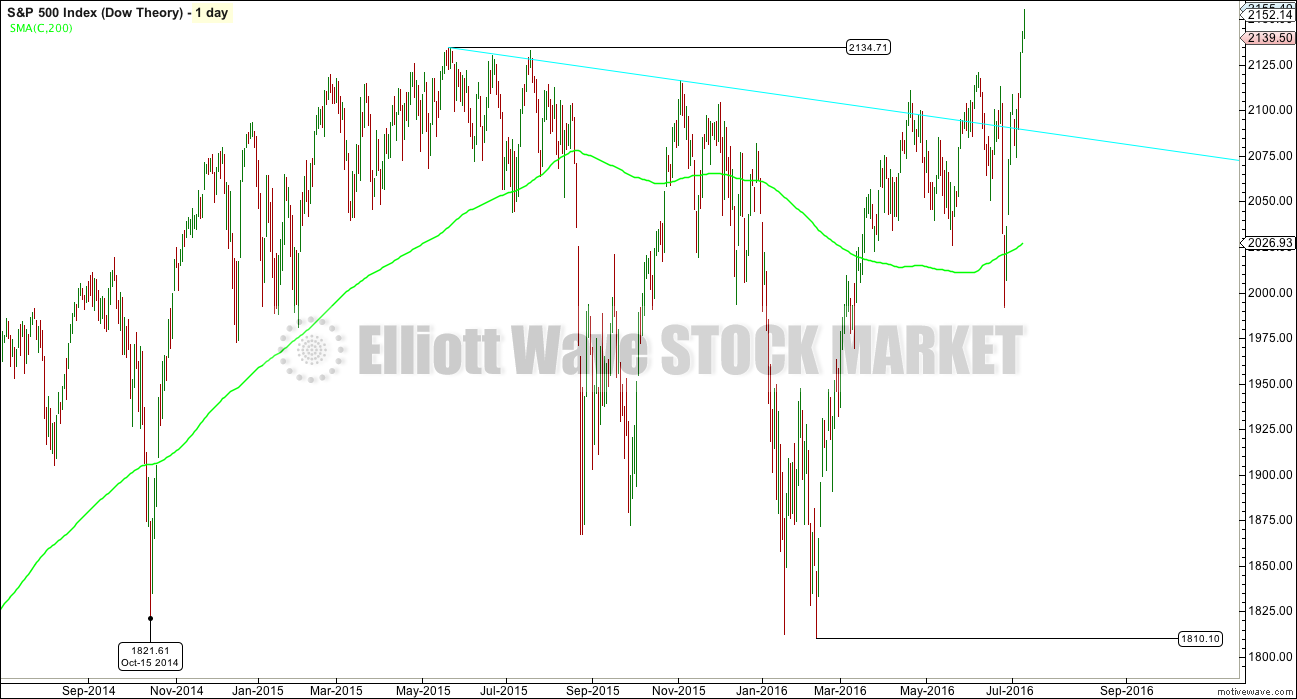
S&P500: 1,821.61 (15th October, 2014) – has not closed below this point yet.
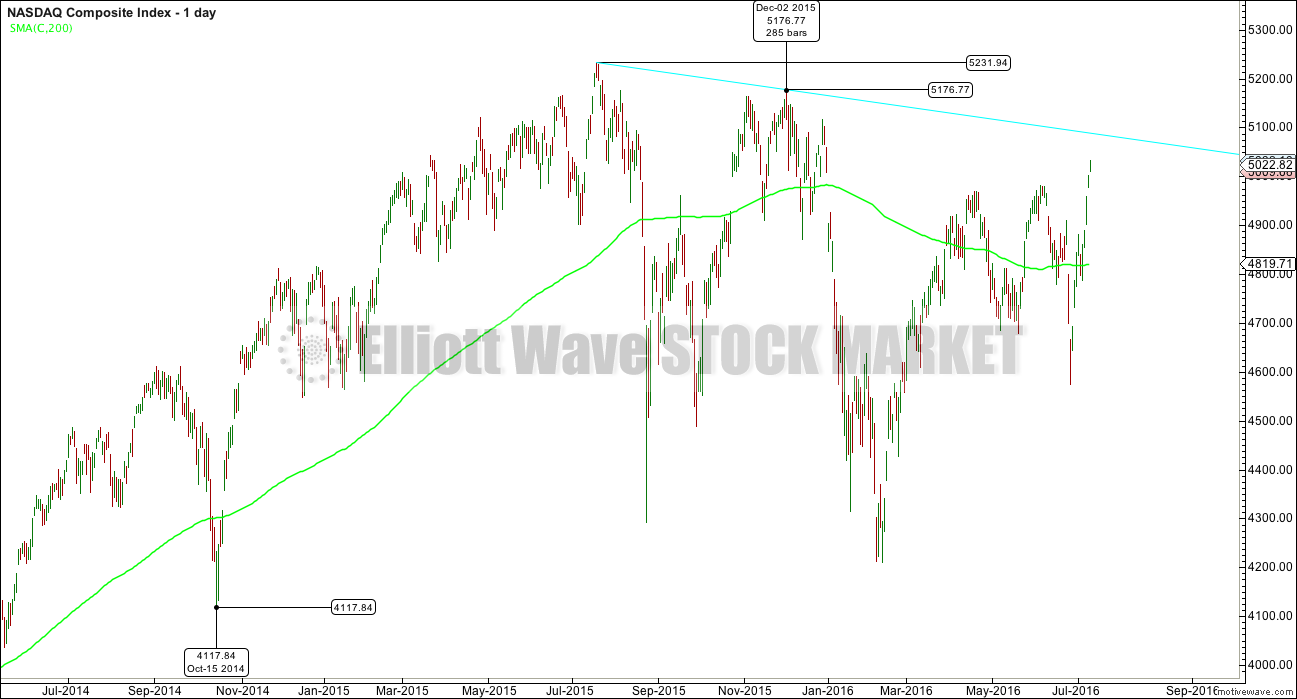
Nasdaq: 4,117.84 (15th October, 2014) – has not closed below this point yet.
Major highs within the new bear market:
DJIA: 17,977.85 (4th November, 2015) – closed above on 18th April, 2016.
DJT: 8,358.20 (20th November, 2015) – has not closed above this point yet.
S&P500: 2,116.48 (3rd Nobember, 2015) – has now closed above this point on 8th June, 2016.
Nasdaq: 5,176.77 (2nd December, 2015) – has not closed above this point yet.
DJIA DOW THEORY
The industrials closed below the prior major low in the prior bull market on 25th August, 2015. With the transportations confirming a change from bull to bear on 24th of August, the day before, at that stage on the 25th of August original Dow Theory confirmed a change in market conditions from bull to bear.
Dow Theory tenet expects that the bear market is intact until both the industrials and transportation averages make new major highs within the new bear market.
For the industrials, the first important major high within the bear market may be considered to be the November 3rd high at 17,977.85.
At this stage, the industrials have closed above this major high on 18th of April 2016.
DJT DOW THEORY
The last major low within the prior bull market is taken as 7,700.49 on 12th of October, 2014. The transportation average closed below this point on 24th of August, 2015. On the following day the industrial averages confirmed a new bear market.
The bear market for the transportations remains intact. The important point of confirmation for a change from bear to bull has not been met by this average. The first major high within the new bear market is taken as 8,358.2 (this is very conservative, it could theoretically be taken higher). The transportations have not closed above this point.
Original Dow Theory as applied with these price points sees the transportations not confirming. The bear market should be expected to remain intact while DJT is offering non confirmation.
S&P500 DOW THEORY
The S&P500 has closed above the prior all time high strongly indicating a new bull market. The 200 day moving average is now increasing. The larger picture looks bullish.
The S&P500 needs to make a new low below 1,810.10 on a daily closing basis for it to indicate an end to this bull market and a possible return to a bear market.
However, the bull market remains suspicious while original Dow Theory has not confirmed a change from bear to bull.
NASDAQ DOW THEORY
Nasdaq has not confirmed a change from bull to bear from the old bull market. But nor has it offered confirmation that the old bull market remains. It has not made a new high on a daily closing basis above the prior major swing high at 5,176.77.
Dow Theory Conclusion: Original Dow Theory still sees price in a bear market because the transportations have failed to confirm an end to that bear market. Modified Dow Theory (adding S&P and Nasdaq) has failed still to confirm an end to the old bull market, modified Dow Theory sees price still in a bull market.
This analysis is published @ 01:04 a.m. EST on 13th July, 2016.

Signed into this site on my smart phone. For some reason it had me start on July 6th. Didn’t realize it. Very confused by everyone’s comments until I figured it out 🙂 I was back in a happy Bear universe for short while! The good old days. Lol.
Still looking for a bear, Mr. Market, on my birthday 8/16. Don’t dissapoint.
Lara can you please update the Nasdaq count? I know you mentioned yesterday you’d get to it today… just a friendly reminder 🙂
I have worked the last two days until after 9pm.
I will update Nasdaq when I have time. So far that has not happened.
As Lara predicted. small fourth wave will conclude without a red print. Final run up to new ATHs should get going into the close….
Exactly !
Close : 2 152.43
Price increase; 0.29 (0.01%) <- Just above red print
Not that it matters much, but we actually got a red candle today. Price closed a little over one point under its open. So it’s a red candle, and barely at that. Nothing to brag about after a 160 point straight up rise from 1991…
The only way we go lower from here is a big downturn in oil. I mean a 8-10% in one day down day. Otherwise this market will shrug it off like it did today… 3-4% down days in oil is not affecting the indices any longer…
I’m not a bear anymore, just waiting for a correction of this massive move up to unload my short position that is deeply under water. Looks like I may not get that lucky though…
in exactly the same boat
If the bull count is correct and the SPX is indeed to head toward 2500, a return to test the 2100 pivot is highly likely Ari….
I would be ok with that Verne. I’d be happier if Lara’s second count is correct and we re-test 1991. But with the market resiliency, it seems very unlikely… I can only see that if oil heads to 35, and only if it goes down rapidly. If it crawls down to that level, doubt market will go down too far below 2100…
The move off the lows today looks corrective. Overlapping and sloppy, but I only see 3 waves down from the highs so far. Possible explanation is this is a little 2 wave up of a 3 wave down? If so we have a 1 down 2 up and 1 of 3 down and now this is 2 of 3 up.
If so, we can’t go above 2148 on the ES or this count is invalidated.
If count is correct, we could see a sell into the close.
A MUST Read:
https://www.linkedin.com/pulse/market-swings-like-pendulum-from-highly-overvalued-back-mirahyes?trk=mp-reader-card
When there, then click… a synopsis of where we are in the larger Bear
Except that wave count was invalidated with a new ATH.
Unless he’s figured out how D can move higher and the structure make sense.
Lara,
From what I gather (you really have to read all the links that I posted yesterday in order… Parts 1 & 2 & ab base. I had to read all a few times.) due to using RN Elliott’s A-B Base pattern he changed some rules in limited situation where the A-B- Base is used.
I think this answers your question… but if not the answer is in there with a full reading.
New-Wave Elliott™ requires some adjustments to Elliott’s 3 Rules & guidelines.
Elliott’s only 3 rules
1) Wave 2 cannot correct beyond the origin of wave 1
2) Wave 3 is never the shortest, and often the longest of waves 1, 3, & 5
3) Wave 4 cannot overlap wave 1
In New-Wave Elliott ™ Diag >s (Diagonal Triangles), Diag IIs (Diagonal 2’s), break all of Elliott’s rules. In these structures, waves 1 & 4 overlap by definition. What’s more, RN Elliott’s a-b reversal, long discarded by the Elliott establishment, will often exceed the origin of wave 1, as an irregular top or irregular bottom, once wave 2 completes, beyond the orthodox termination. This is where extreme herding sentiment is expressed, as a false break-out, or false breakdown.
Sorry Joe, I have a really big problem with this guys writing.
Firstly, there’s too much hyperbole in it. My bullshit detector is on high alert.
I am always suspicious of anyone who makes a statement that they are an expert, Prechter and Frost is all wrong (I know, I know, Prechter has had some horrible wave counts in the last few years) and only they know the truth.
I am not willing to go with this one guy who is completely rewriting EW rules, based on some of R N Elliott’s early work and his interpretation of it.
Finally, in the third link you kindly provided, here, he’s not very clear on how he’s rewriting Elliott wave rules. It’s all rather vague to me.
I’m not going to suddenly change my whole method to rewrite some of the most basic EW rules as laid out in Frost and Prechter.
If I do that based on this guys writings, then where shall I stop? There are a great number of people online publishing their work, calling it Elliott wave, and rewriting the rules as they do so. Shall I rewrite more rules?
I just cannot do that. I have to stick with the rules in Frost and Prechter as the standard for Elliott wave.
And if that makes me arrogant according to “exceptional bear” then so be it.
In all my years of daily EW counting of various markets, I have not yet seen a movement that does not fit into the restrictive rules as laid out in Frost and Prechter.
At this time I don’t see the need to rewrite the rules. IMO if I were to make a statement that I know better, and the rules in Frost and Prechter are wrong, then I had better have some voluminous research to back that up. Otherwise IMO I would be behaving with arrogance.
That’s my two cents worth on the topic anyway.
Here is one comment from him I found which sums up the only differences. All else is the same as Frost & P
New Wave Elliott™ long count, is the only count which is consistent with Robert Shiller’s historical Values, and verified by Elliott’s Channel. The Bearish Diag II, and the A-B Transition are integral, neither is recognized by the Elliott establishment, that is what has given The Wave principle a bad rap for being unreliable. In such cases it was the analyst that is at fault, not the tool.
He is saying that adding those two tools makes the larger counts more reliable. Based on my experience with EWI… especially the last 6 as a member… I would say his larger counts have been unreliable. He try’s to say after the fact that that he warned… but he certainly was not confident and keep the warning so low key (less than a sentence) buried near the end of the report that you just didn’t give it much weight.
Since they basically ignored RN Elliott’s a-b base work… I believe that part is worth further analysis and so is the Diag II. For me it will be interesting to continue to watch at the very least.
Thank You for having this conversation… I certainly understand your position & view. I also respect your work and the daily analysis you do is 2nd to none.
Thanks for the link Joseph. I’m not really sure what context of analysis is charted at this link. If it is an attempt at Elliott Wave Theory, I don’t know where to start. First, the labeled “Diagonal” is really a triangle (A,B,C,D,E). Second, the labeled (D) wave exceeds 150% of wave (C) which violates an EW rule. Third, the current price has not only exceeded the analylist’s target price for the “correction” but has actually exceeded the previous all time high.
There is a case that can be made, which Lara has already charted, that allows for a continuation of the expanded Super Cycle wave (b). Even though that continuation may be stretching the “guidelines” of EW it does not violate a rule.
Sorry Lara, I was composing this when you already posted.
Gary, please read all the links as I list above. Found in July 11ths section… 3/4s down.
Need to keep an open mind and read completely. He can point to it working on historical charts… but it sounds like we are close for an actual example of what he is counting out. But I am not sure how close.
+ I am working off of reports that are out there publicly… the above being the most recent that is public. July 10 or 11th. So atm I don’t know what post NH’s comments will be. But from what I gather (not 100% sure), NH’s in this specific pattern won’t matter.
Thanks Joseph, I did read the follow-on links. Personally, I find it unproductive to change the laws of science just because you didn’t like the results of the experiment. There have been many attempts over the years to create a “New Elliott Wave”. John Neely’s (a previous partner of Robert Prechter) NEoWave is just one example. With every attempt to modify the rules of RN Elliott, the result has been a more convoluted, complex, and less effective tool. In most of these attempts, the motivation to create a “New Elliott” can be traced to an over-hyped and over-promised prediction which went bad. ” …There must be something wrong with the rules!”. Elliott wave analysis is a probability gauge which should be used to place the proper size and direction of trade. It is not, and never was a precision predictive stick pin on a chart.
I subscribe to EWSM because Lara is a steadfast disciplined analyst in orthodox Elliott Wave Theory. No hype, no over-promised predictions which cloud trading judgement. Make no mistake, I am never happy when the lower probability alternate count proves to be correct, but I also find it not worth my efforts to try and explain the reason through fundamental, geo-political, or methodology excuses.
So for now, I’m going to stick with the current science and pursue a different experiment.
But you have to ask yourself why Frost & Prechter threw out RN Elliott’s A-B Base pattern… ANd why their long count looks distorted? That pattern was part of the original RN Elliott’s work. This guy seems to have corrected the long count. by using it.
Why not see if it can be improved… especially at critical junctures. That is what this guy is claiming.
I never looked at NEoWave and how it differed. So I can’t comment on that.
What this New Elliott Wave guy is doing seems logical to me. His argument for the A-B Base makes sense to add back & use. If he was able to figure that out where Frost & Prechter could not.
Plus the Diag discovered in the 1950’s.
I also love that he is also using the Valuation metric.
A real life example of the reversal pattern he is claiming is very near or in the not too distant future. So we shall see how it all plays out in real time.
And, that contingency is totally accounted for in any of Lara’s counts above. The difference in them being whether it happens sooner than later.
I have the collected works of R N Elliott. I’ll look through it for an “A-B base” and see what I find.
Correction: Glen Neely
I am not an EW expert ( follow results not ideaology) so tracked his recommendations (UVXY and SVXY , JDST and NUGT) closely for about 6 weeks. Would be 50% loss of portfolio. Maybe he is correct big picture but short term big losses.
I have not looked at specific picks. I am more interested in the EW & his NEW counts and what it’s says on big picture.
Although Timer Digest has him as the 2015 Timer of the year for S&P… Whatever that means???
Edit:
Look all… I am not promoting anything or anyone. I stumbled on all this and after reading it few times + this Guy’s background on LinkedIn (if true)… I thought it was very interesting and worth sharing with this board. Lara also gave the Okay in a posting on the 11th.
So that’s all I have to say on this… Unless others what to carry on the conversation after reading all the material I posted both yesterday and today with an open mind.
No worries Joe, it’s a valid conversation to have.
I’ve posted my view on it.
Others are free to take a look at the links Joe’s posted, the more important one I think would be this.
Eureka! Munching the gummy bears worked! I now have a chart that captures all the big moves since 1975 and explains our current emotions and supports the Bulls and the Bears. Now I am going to see if I can Elliott Wave count the thing and throw it up for comment to all of you EW experts. More to come.
Cheers,
Jim
Here is what I think is going on. More information to come but I wanted everyone to see what I am seeing.
https://www.tradingview.com/x/tqYqAEyt/
Jim, thanks for your post….if it is not askign too much, can you do the same for RUT and Nasdq?
Here is the Nasdaq (except this is is log scale)
https://www.tradingview.com/x/2JcEzjLX/
SPX log scale too.
QuangVo
I am very interested in cycle theory, would you point me to or provide a link to your preferred source of cycle dates? Thanks.
Phillip got me interested in it. The call was 6/23, 7/4, 7/14-7/15 were the turn dates.
6/23 was was a HUGE turn date.
7/4 was also a short term top (Globex ES session) was also the high.
next up 7/14 and 7/15.
I’m very new at it, but in theory, depending on how the move is coming into the dates, then it reverses on these days.
I don’t know how accurate they are, I have seen only 2 dates so far, and been a client for about 1 week.
Link below….
http://cyclesanalysis.com/index.html
Thanks
Looks like we had a doji yesterday on the Nasdaq…qqq’s…possible bearish engulfing candlestick today…we will see on the closE.
This is looking like a fourth wave which means we have one more impulse up to complete the current move. Today will in all likelihood be an uneventful session not worth watching. The reversal, if we were seeing an expanded flat should have been quite decisive and that’s not what we are seeing, so it seems count 1 is unfolding. Ciao!
Funny thing is, I have to automated mechanical trading systems that I built (had buit should I say). One is on the 5 minute chart and the other is on the 30 minute chart. Sometimes I turn these on so that it can help me manage my position (close me out) when I’m away from the screen. I always have them running, but not always executing, because they often help me confirm direction of my trade.
currently one has me long and the other has me short…both losing money right now…..lol. Good thing they the execution on both is currently off.
EDIT: This doesn’t happen very often, but when it does, it usually means our trend is about to change. In this case from up to down.
another pin prick. shoooot!
wow…there is some serious size on both sides of this market here….
Answering Lara’s post/question: July 12, 2016 at 10:30 pm
“Yet it hasn’t let to inflation, all this printing money…. and it doesn’t seem to be flowing through the wider economy. It appears to be retained within the financial industry. Or am I mistaken there Peter? You’d know about this better than I…”
The FRED graph shows all the real money pumped into the US financial system.
The US Federal Reserve created new money then bought various financial instruments directly from about 17 banks/financial institutions. The Fed created excess reserves in the banking system. But, these big money banks held onto the monies they received from selling the Fed their paper assets (mortgage backed securities, Treasuries, bonds, etc.). The banks failed to loan out the Fed cash to Main Street. They did so because at the time, and still, they didn’t/don’t like the economic conditions and didn’t/don’t want bad loans on their books. Conversely businesses in the USA have not had much of a need or want to take out new loans either: poor demand for their goods and services for 8 years. At the same time the new Dodd-Frank 2010 Act was passed which ironically discourages banks from loaning money. Also, and I’m not making this up, to “stabilize” the US financial markets back in 2008 the Fed began paying interest to the banks on reserves the banks held. Thus, it cost much less for the banks to hold excess reserves. As inflation is the general rise in prices and goods (whole other subject) the Fed funny money has simply not gotten to Main Street. Thus, inflation has not reared its head. Now, after 8 going on 9 years, we have proof the rapid money buildup to jump start the main economy has failed, as Kenyesian economic theory always does. As VerneC noted there certainly are pockets of bubbles: real estate, art, bond and stock markets, fancy car market. Exactly what Wall St. bank people would buy. But most of the money the banks received from the Fed they just turned around and bought bonds. A certainty of 3% return (depending on when they bought) with no risk, from their prospective. So this time the ‘flight’ to bonds is not one of safety, it is more so a place to park the huge sums of cash these Fed bank favorites had. Further may explain the huge divergence in stock market indexes because these big boy banks are only going to purchase large cap stocks. They aren’t going to be buying $5 – $10 stocks on the RUT or Nasdaq. Large caps found on the SPX and the Dow Jones – the two markets going up the most. Repeating our TA may not be working because of what one sees in the graph: massive money pumping.
Thanks Peter
Future Inflation: it depends on what happens to the excess reserves/pumped money as if there will be massive inflation or not. If the Fed sells off their holdings (which they already have been doing) they are taking the QE monies back in, and out of the USA’s financial system. There will be little to no inflation. Yet if the Fed’s favorite banks begin loaning in mass then inflation would rear its ugly head. With the multiplier the banks have around $26 trillion in effect to loan.
Thanks Peter, one of the most lucid explanations of the effects of the current CB intervention I have read.
I’ll second that, thank you Peter.
Just got short 1/2 position in the ES.
going to keep a little wider then normal stops here. These 5 minute candles are bigger then normal.
On July 11 the beginning paragraph that was updated stated that if we in a b up then it may be followed by a few down days below 1991 and change. Just curious where the few days were estimated from? Does anyone know?
Only because the falls lately have been fast. At least a few days would be required to get down that far, for intermediate (C) to unfold.
A fifth attempt at another “stacked gap” open stymied today with rapid close of gap open.
TLT on oversold bounce, entering short…
well, maybe the news of 17% of all Italian loans outstanding is bad is finally starting to register with some folks.
Lara – appreciate the new Bear Wave Count.
I can only imagine what sentiment might look like near 2200 as we approach end of summer.
It will also be interesting to see where DJT and small caps are trading as DJI/S&P keep moving higher.
GLTA
LOL…These d*amn banksters are having a field day. Easy to ramp this market when there are no sellers left.
They must be scared, cuz they see what we all here see. What would you do if you were in their shoes? Unlimited amounts of cash, print…buy.
When will it turn is anyone’s guess, but when it turns, we’ll see it in the 5 minute chart first, 30 minute chart second, then the hourly chart 3rd. In the mean time…. follow the trend until the trend ends. That’s what I am doing.
Big cycle dates tomorrow and the 15th. Looking for a reversal confirmation before getting short. SO far these cycle dates have been on the money to the day…so I’m going to pay close attention to them.
QuangVo
Would you point me to or provide a link to your preferred source of cycle dates? Thanks.
I posted some links on the board for the 11th… I Recommend you all read them.
Good luck all.
Plus this link: http://exceptional-bear.com/176.html
Truth & Falsehood in the Market – (its safe to download & open)
Thanks Joseph
Interesting article, our time will come just not quite there yet 🙂
You should read the links I posted yesterday under the analysis for July 11th… even more interesting to EW analysis. There are 3 pdf’s there. This is a boring day and those are well worth reading. I am on my 3rd read of the same material.
Thank you Lara for all the new adapted analysis. Great job !
You’re welcome.
Thank you all for your patience.
I’m the turd in third, as doc would say…
Looking at the gold analysis, I’d expect the indices to start turning around here… if gold is going to hit 1400-plus, can equities rise with it? Also, oil is expected to go lower from here… Add that with the greed index, and it should be a good time for a correction.
But correlations kind of don’t work any longer. We’ll see…
Woo Hoo!
Nice! Any points for second place?