A new all time high was not expected for the bear Elliott wave count.
The only Elliott wave count now viable (that I can find) is bullish.
Summary: In the short term, a little more upwards movement to a target at 2,146 may then be followed by a few days of downwards movement to end just below 1,991.68. Thereafter, the bull market should continue for several months, at least.
New updates to this analysis are in bold.
MONTHLY CHART
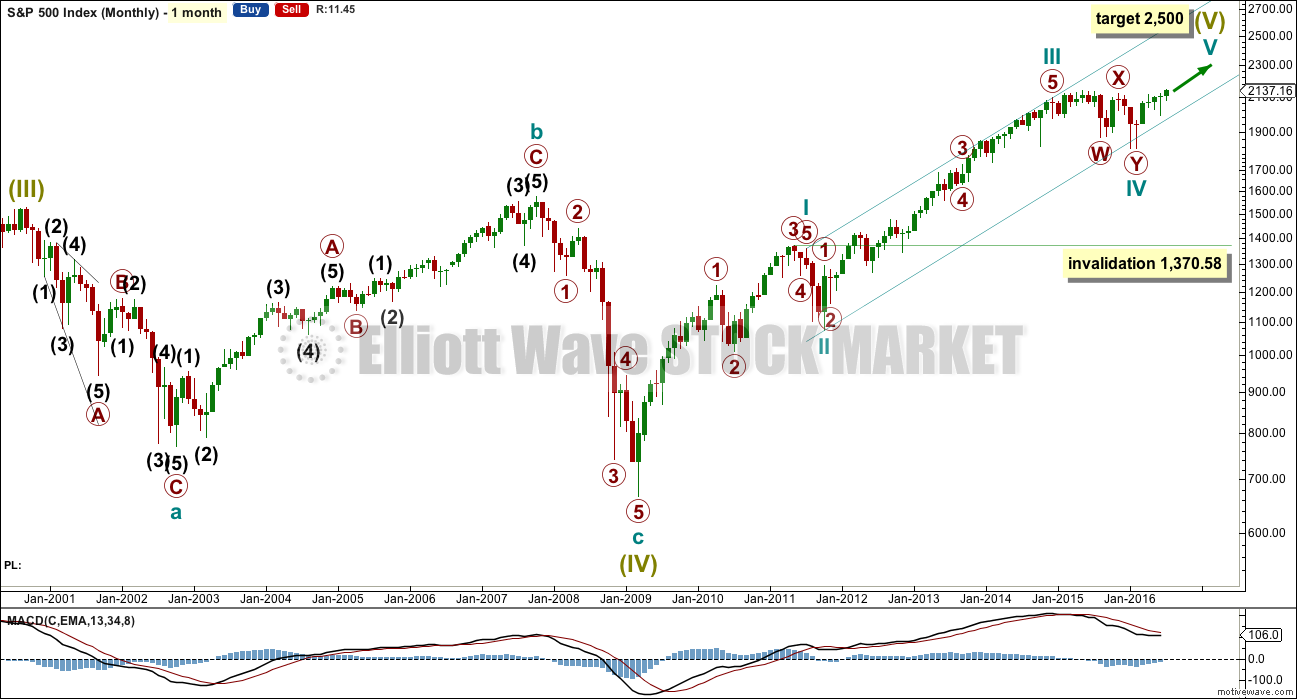
The large expanded flat labelled Super Cycle wave (IV) completed a 8.5 year correction. Thereafter, the bull market continues for Super Cycle wave (V). The structure of Super Cycle wave (V) is incomplete. At this stage, it is subdividing as an impulse.
There is no Fibonacci ratio between cycle waves I and III within Super Cycle wave (V). This makes it more likely that cycle wave V will exhibit a Fibonacci ratio to either of cycle waves I or III. The most common ratio for a fifth wave is equality with the first wave, which gives a target at 2,500. The probability is increased with this target calculation being a round number.
The teal channel is drawn using Elliott’s first technique about an impulse. Draw the first trend line from the ends of cycle waves I to III (from the months of July 2011 to December 2014), then place a parallel copy on the low of cycle wave II. Cycle wave IV has found support very close to the lower edge of this channel, so the channel looks about right. The lower edge should continue to provide support, and the upper edge may provide resistance if price gets up that high. For the S&P500, its fifth waves commonly end mid way within these channels, so in due course a mid line may be added.
Copy this large channel over to weekly and daily charts, all on a semi log scale. The lower edge will be important.
Cycle wave II was a shallow 0.41 zigzag lasting three months. Cycle wave IV is now seen as a more shallow 0.28 double combination lasting 14 months. With cycle wave IV nearly five times the duration of cycle wave II, it should be over there.
Cycle wave I lasted 28 months (not a Fibonacci number), cycle wave II lasted a Fibonacci 3 months, cycle wave III lasted 38 months (not a Fibonacci number), and cycle wave IV lasted 14 months (one more than a Fibonacci 13).
If the target for cycle wave V is for it to be equal in length with cycle wave I, then it may also be expected to be about equal in duration. So far cycle wave V is in its fifth month. After this month, a further 23 months to total 28 seems a reasonable expectation, or possibly a further 16 months to total a Fibonacci 21.
The degree of labelling within cycle wave IV may be moved down one degree. This combination may be only primary wave A of a larger more time consuming flat correction for cycle wave IV. However, if that were the case, then cycle wave IV would be grossly disproportionate to cycle wave II and would end substantially outside the large channel containing Super Cycle wave (V). This is possible, but the probability looks to be too low for serious consideration.
If cycle wave IV is still continuing further, then it may not move into cycle wave I price territory below 1,370.58.
WEEKLY CHART
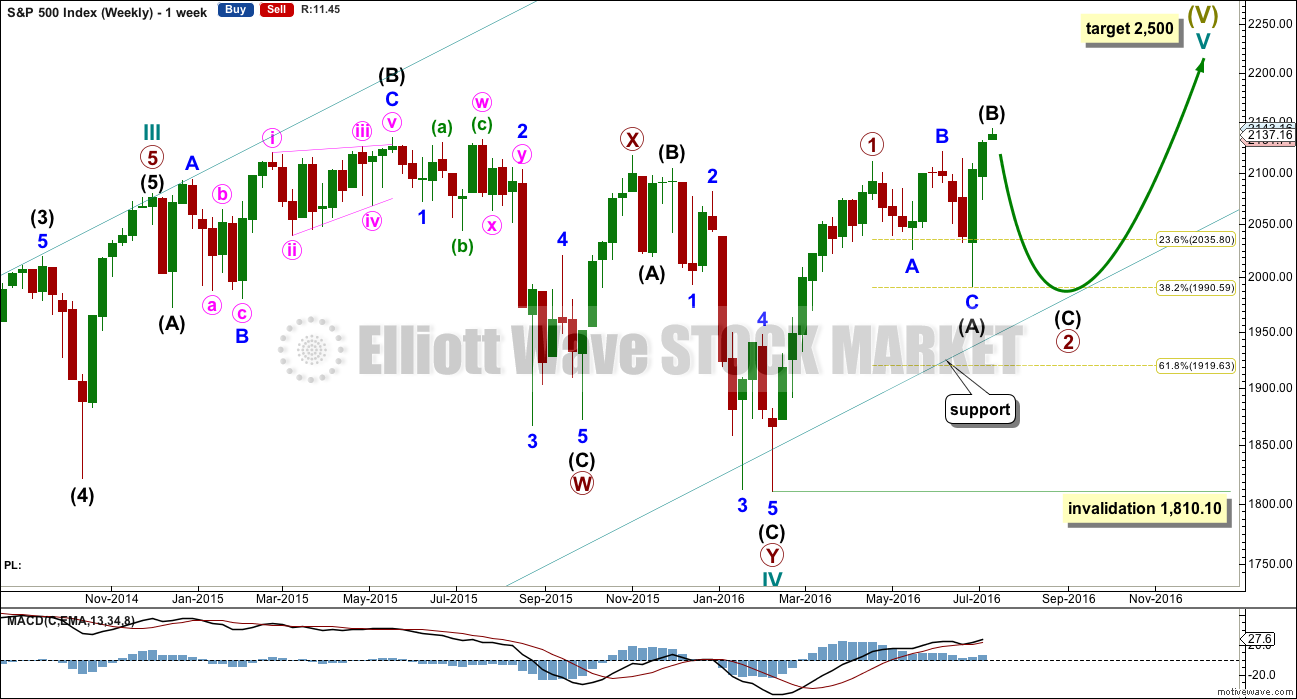
This weekly chart shows the resolution of prior problems for subdivisions within cycle wave IV.
If cycle wave III ended earlier at the end of November 2014 as shown, and not at the all time high, then cycle wave IV may have begun there. It now subdivides as a double combination and is mostly a sideways structure which has the right look for a combination.
The first structure in the double is an expanded flat labelled primary wave W. Intermediate wave (C) ends with a slightly truncated fifth wave within this structure. In this case, the truncation is acceptable because it did come after a movement that fits the description as “too far too fast” labelled minor wave 3. The truncation is small at 4.9 points.
The two structures of the double are joined by a zigzag in the opposite direction labelled primary wave X.
The second structure in the double is a zigzag labelled primary wave Y, which ends below the end of primary wave W but not enough for the whole of cycle wave IV to have a downwards slope. The whole structure has a sideways look fitting the purpose of a combination to move price sideways and take up time. It ends about the lower edge of the channel.
The prior problem of how to see the downwards wave labelled primary wave W is resolved with this wave count. This movement looks like and fits perfectly as a zigzag; any wave count that tried to see it as an impulse did not look right.
WEEKLY CHART – DETAIL CYCLE WAVE III
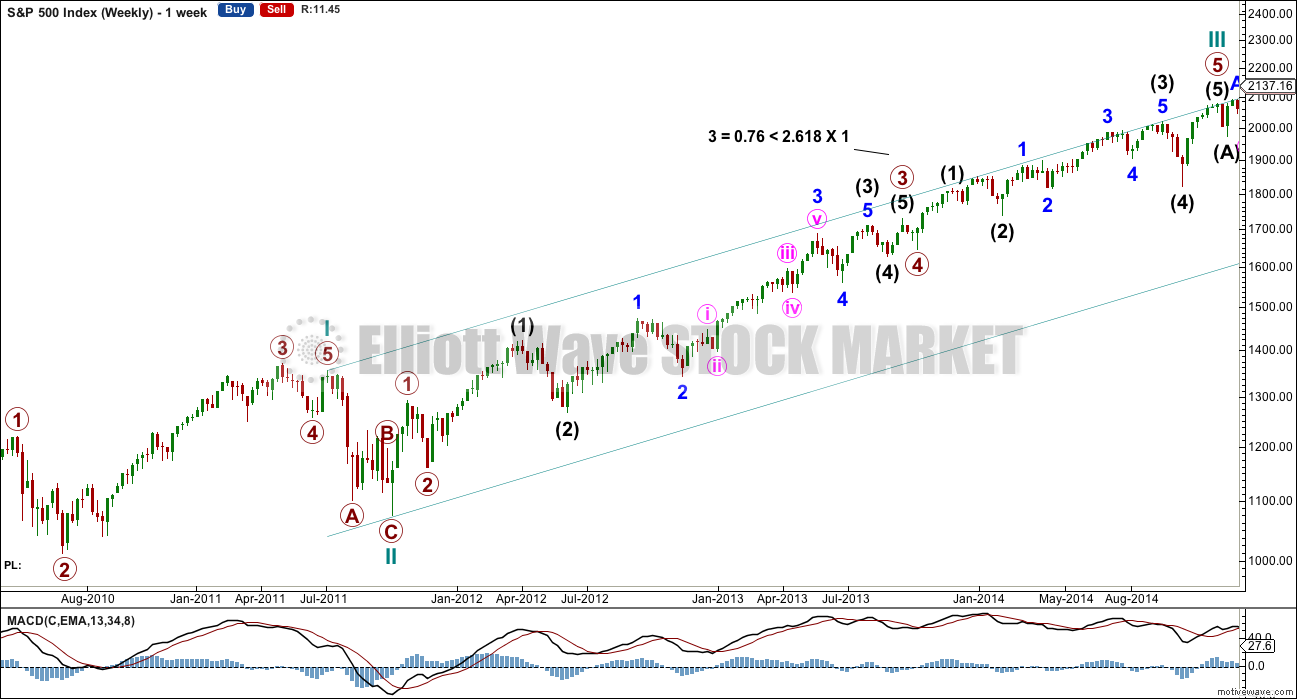
This chart is provided to show the detail of sub-waves at the end of cycle wave I, the zigzag of cycle wave II, and the subdivisions within cycle wave III.
Cycle wave III subdivides perfectly as an impulse. Within cycle wave III, primary wave 3 is just 0.76 points short of 2.618 the length of primary wave 1. This is the most likely labelling for this impulse because of this very close Fibonacci ratio and perfect subdivisions right down to the five minute chart level, whether it be a third wave or any other impulsive wave.
The change today is to the end of cycle wave III, primary wave 5 is seen as over earlier.
MAIN DAILY CHART
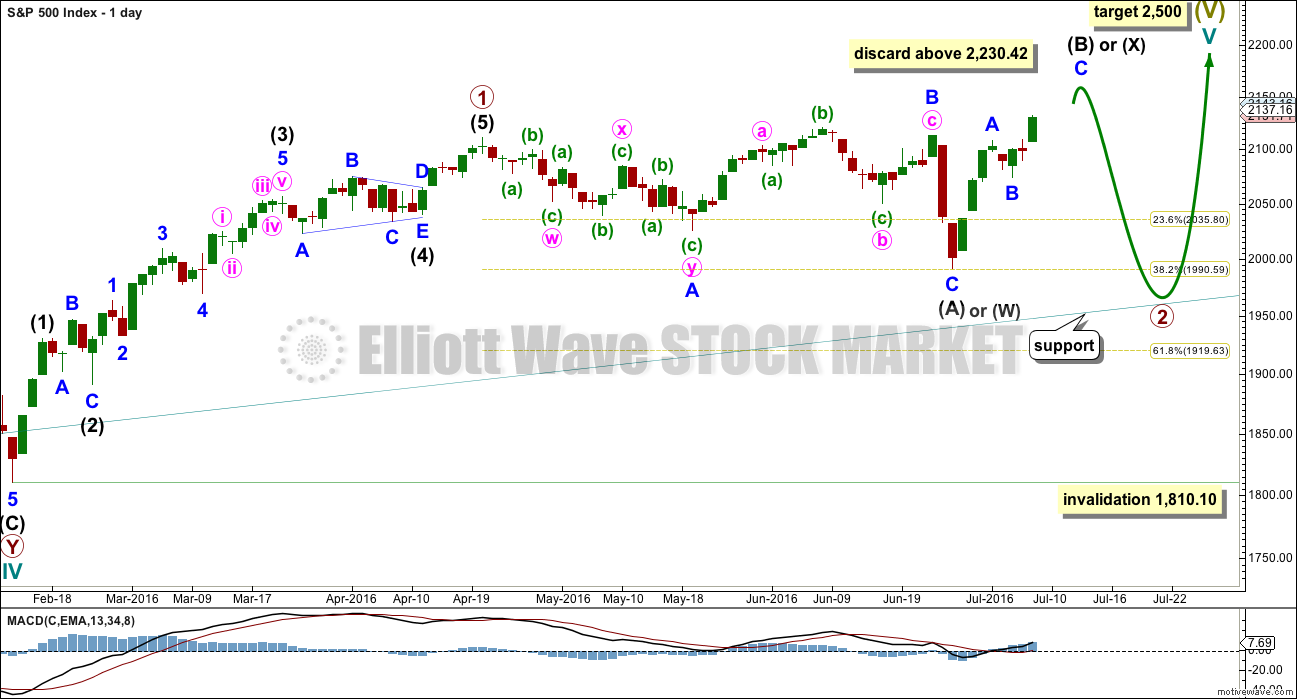
Classic technical analysis still sees substantial weakness in recent upwards movement. It is my judgment today that the recent highs are more likely a B wave than the early stage of a third wave up.
Two daily charts are provided today. This main wave count has more support from classic technical analysis, so it is more likely. Primary wave 2 is seen as an incomplete expanded flat correction.
The common length for intermediate wave (B) is from 1 to 1.38 the length of intermediate wave (A), giving a range from 2,111.05 to 2,156.41.
The idea of a flat correction should be discarded when intermediate wave (B) exceeds twice the length of intermediate wave (A) above 2,230.42.
When intermediate wave (B) is complete, then a target may be calculated for intermediate wave (C) downwards. It would most likely end at least slightly below the end of intermediate wave (A) at 1,991.68 to avoid a truncation and a very rare running flat. It may end when price comes down to touch the lower edge of the channel copied over from the monthly chart.
Primary wave 2 may also be relabelled as a combination. The first structure in a double combination may be a complete regular flat labelled intermediate wave (W). The double would be joined by an almost complete zigzag in the opposite direction labelled intermediate wave (X). The second structure in the double may be a flat (for a double flat) or a zigzag to complete a double combination. It would be expected to end about the same level as the first structure in the double at 1,991.68, so that the whole structure moves sideways.
An expanded flat for primary wave 2 is more likely than a double combination because these are more common structures for second waves.
HOURLY CHART
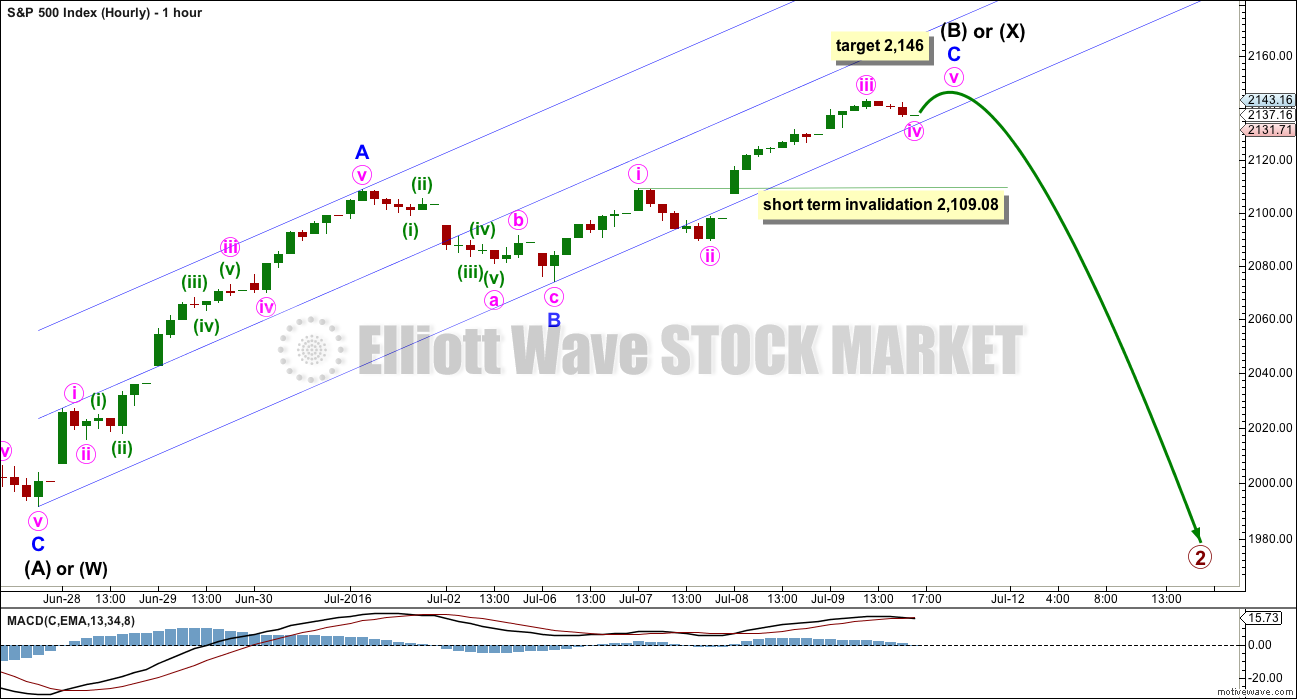
The hourly charts show the structure of recent upwards movement. So far minor wave C is an incomplete impulse.
Within minor wave C, minute wave iii is 2.99 points short of 1.618 the length of minute wave i. Minute wave iv may not move into minute wave i price territory below 2,109.08.
At 2,146 minor wave C would reach 0.618 the length of minor wave A. This target allows intermediate wave (B) or (X) to be within the normal range of 2,111.05 to 2,156.41.
Draw a channel about the upwards movement. When price breaches the lower edge of this channel with clear downwards movement (not sideways), that shall be a very early indication that intermediate wave (B) or (X) may be over. Price confirmation would still be required.
Earliest price confirmation would come with a new low below 2,109.08. At that stage, downwards movement could not be a fourth wave correction and so minor wave C would have to be over.
Final price confirmation would come with a new low below 2,074.02. At that stage, downwards movement could not be a second wave correction within minor wave C. At that stage, also the alternate below would be invalidated.
Price may remain within the lower half of the channel as minor wave C completes.
ALTERNATE DAILY CHART
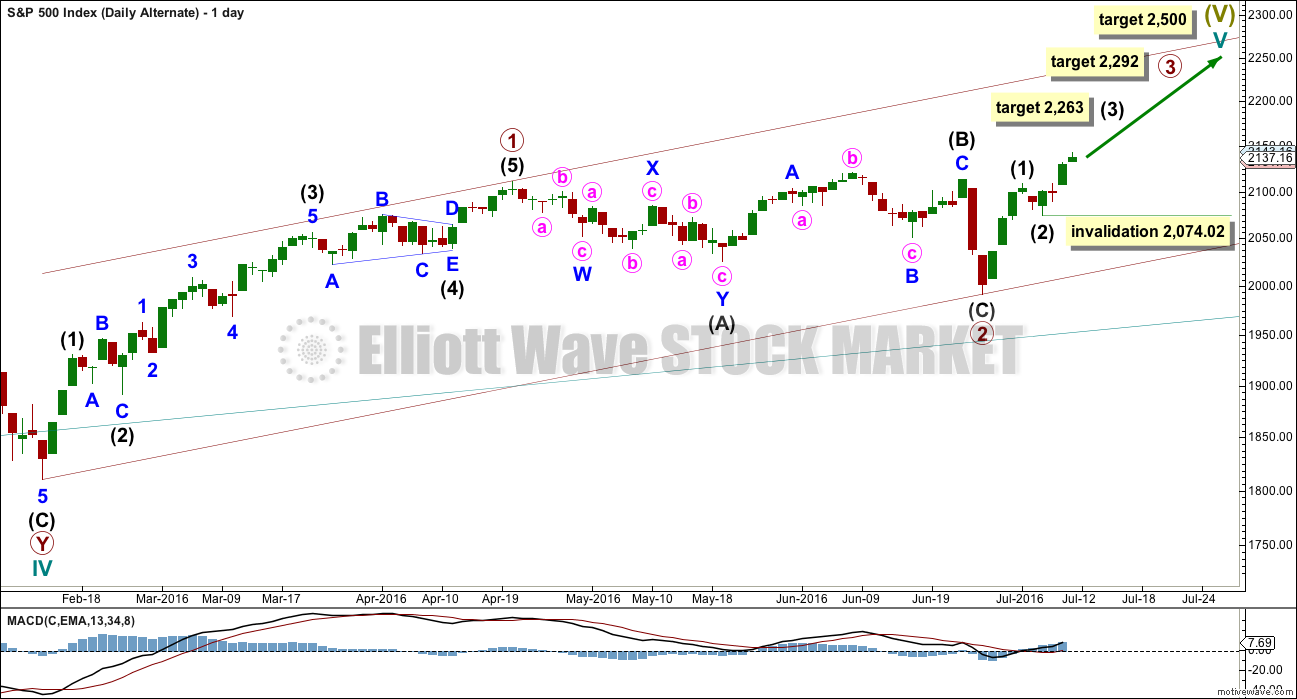
It is possible that primary wave 2 is already complete as a shallow regular flat correction. Primary wave 3 may have begun.
At 2,292 primary wave 3 would reach equality in length with primary wave 1. This is the ratio used for the target in this instance because primary wave 2 was relatively shallow and it fits neatly with the high probability target of 2,500 for cycle wave V to end.
Primary wave 3 may only subdivide as an impulse. So far within it intermediate waves (1) and (2) may be complete.
Within intermediate wave (3), no second wave correction may move beyond its start below 2,074.02.
At 2,263 intermediate wave (3) would reach 1.618 the length of intermediate wave (1).
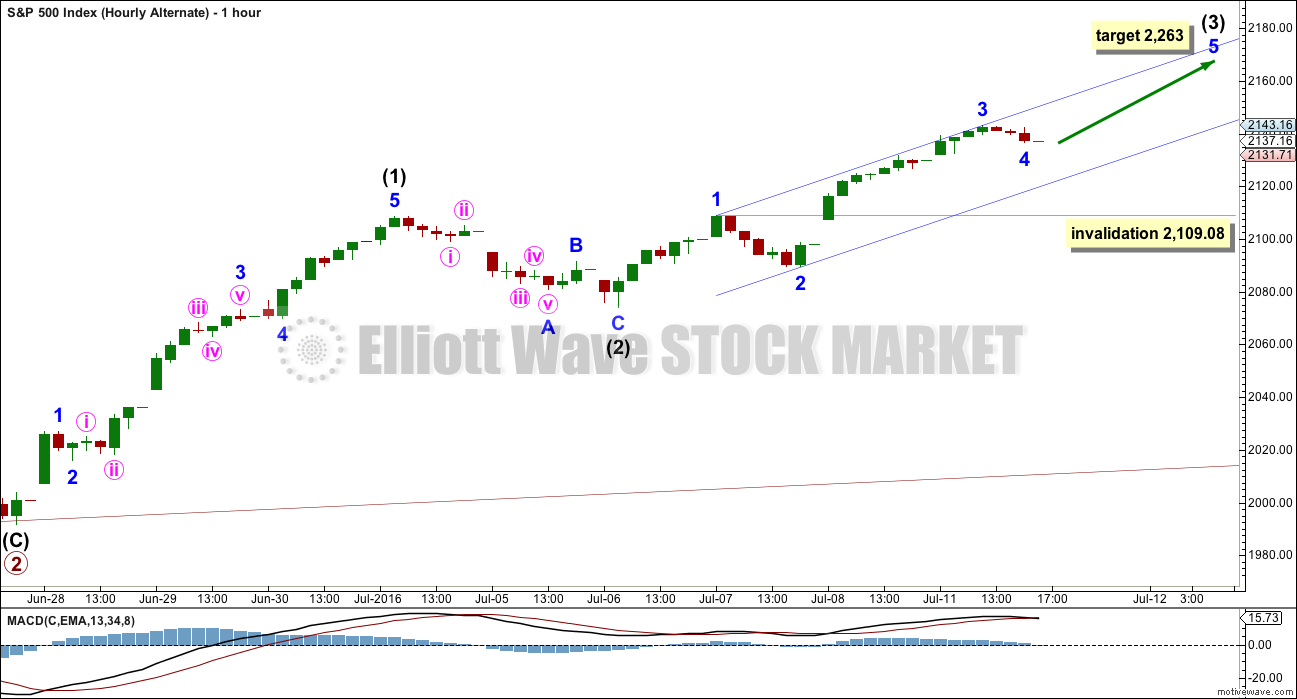
ALTERNATE HOURLY CHART
The subdivisions at the hourly chart level are exactly the same today for both wave counts because 1-2-3 of an impulse subdivides exactly the same as A-B-C of a zigzag.
Within intermediate wave (3), minor wave 4 may not move into minor wave 1 price territory below 2,109.08.
Draw a small channel about the impulse unfolding upwards as shown. Minor wave 5 may end about the upper edge.
TECHNICAL ANALYSIS
MONTHLY CHART
Click chart to enlarge. Chart courtesy of StockCharts.com.
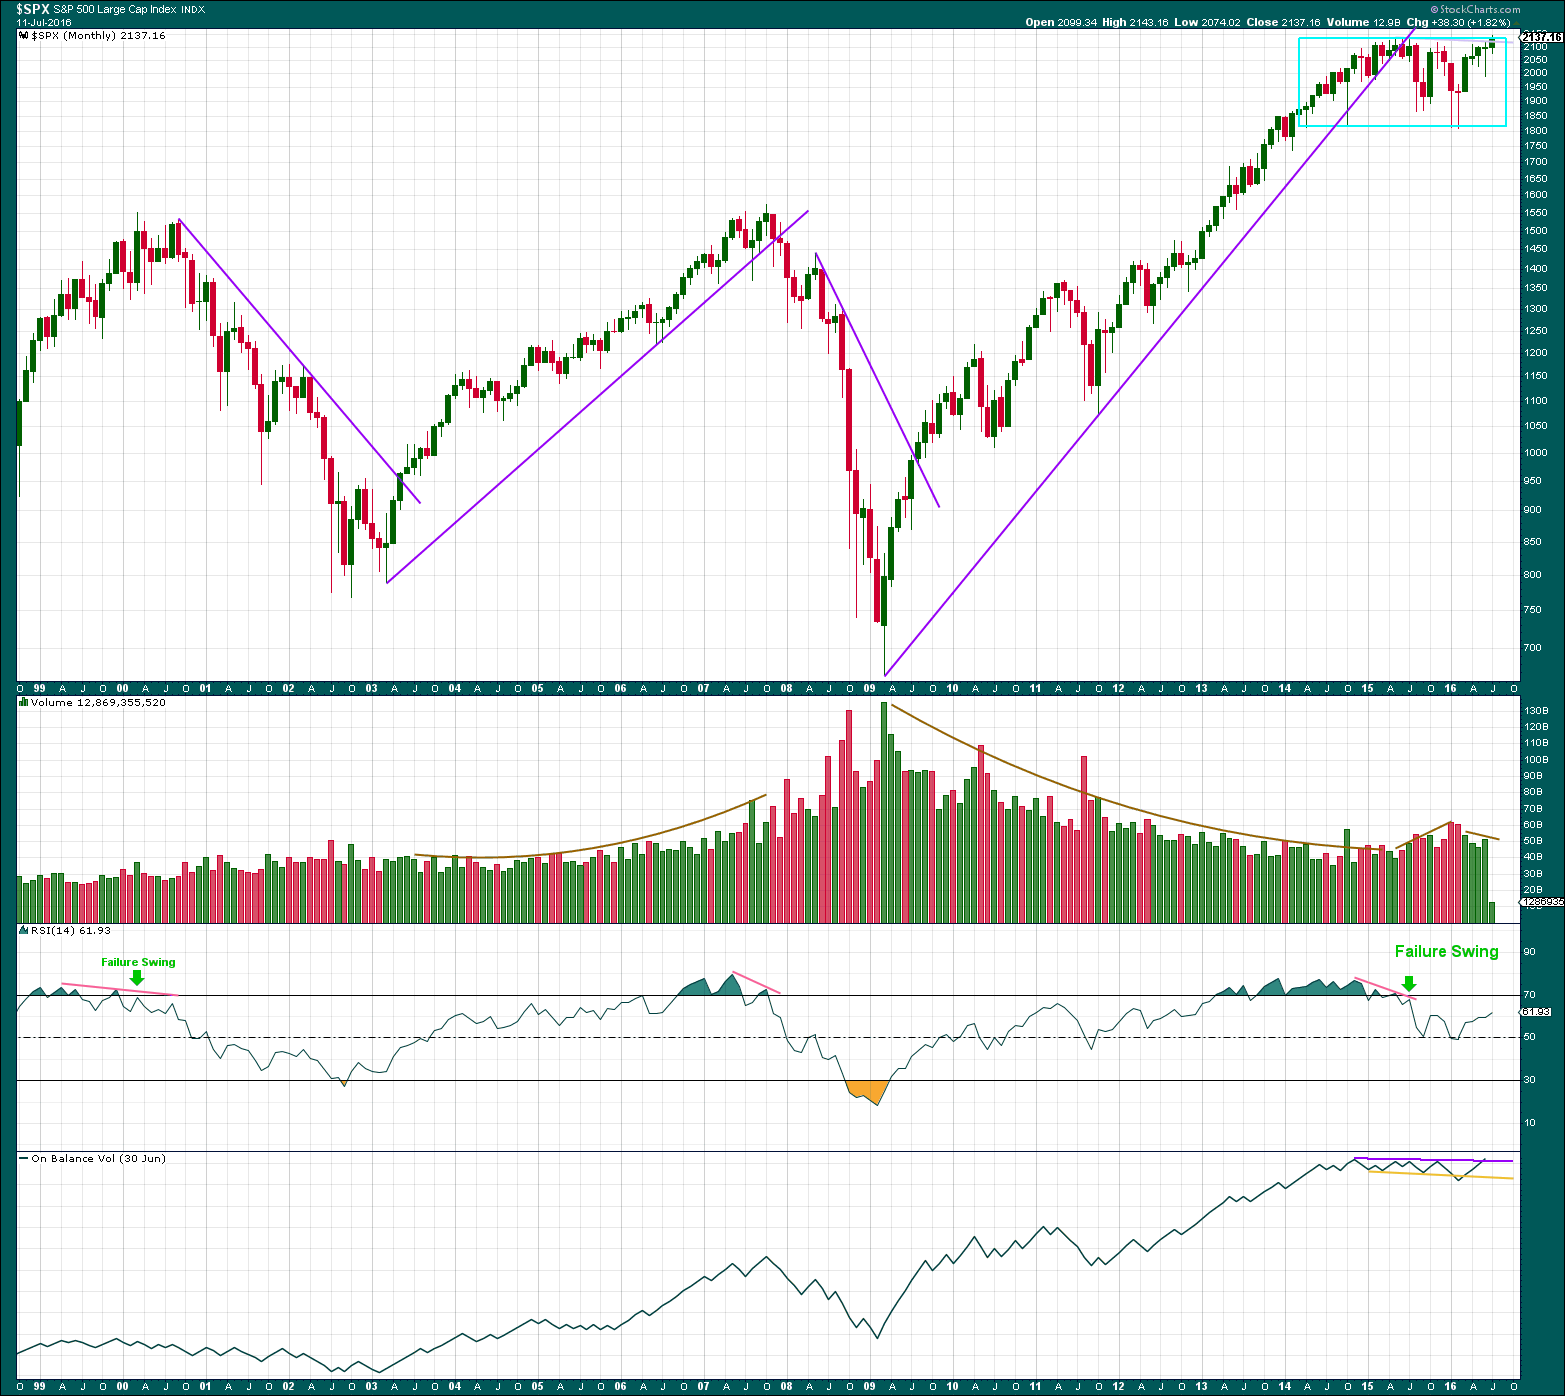
From the low of March 2009, price came with a clear decline in volume as price rose to the last all time high. The rise in price is still suspicious, so it is not supported by volume.
Thereafter, price came with an increase in volume as price moved sideways and lower for nine months. At the monthly chart level, so far the volume profile still looks bearish.
Price is still range bound. The new all time high seen today does not come with an increase in volume, so an upwards breakout is suspicious.
Nine months of sideways / downwards movement after the last all time high may have been enough to resolve RSI divergence and a failure swing.
On Balance Volume was a warning that in hindsight was not given enough weight. Recently, it broke above the purple line before price broke above resistance. At this stage, OBV is bullish at the monthly chart level which supports the wave count at the monthly chart level.
WEEKLY CHART
Click chart to enlarge. Chart courtesy of StockCharts.com.
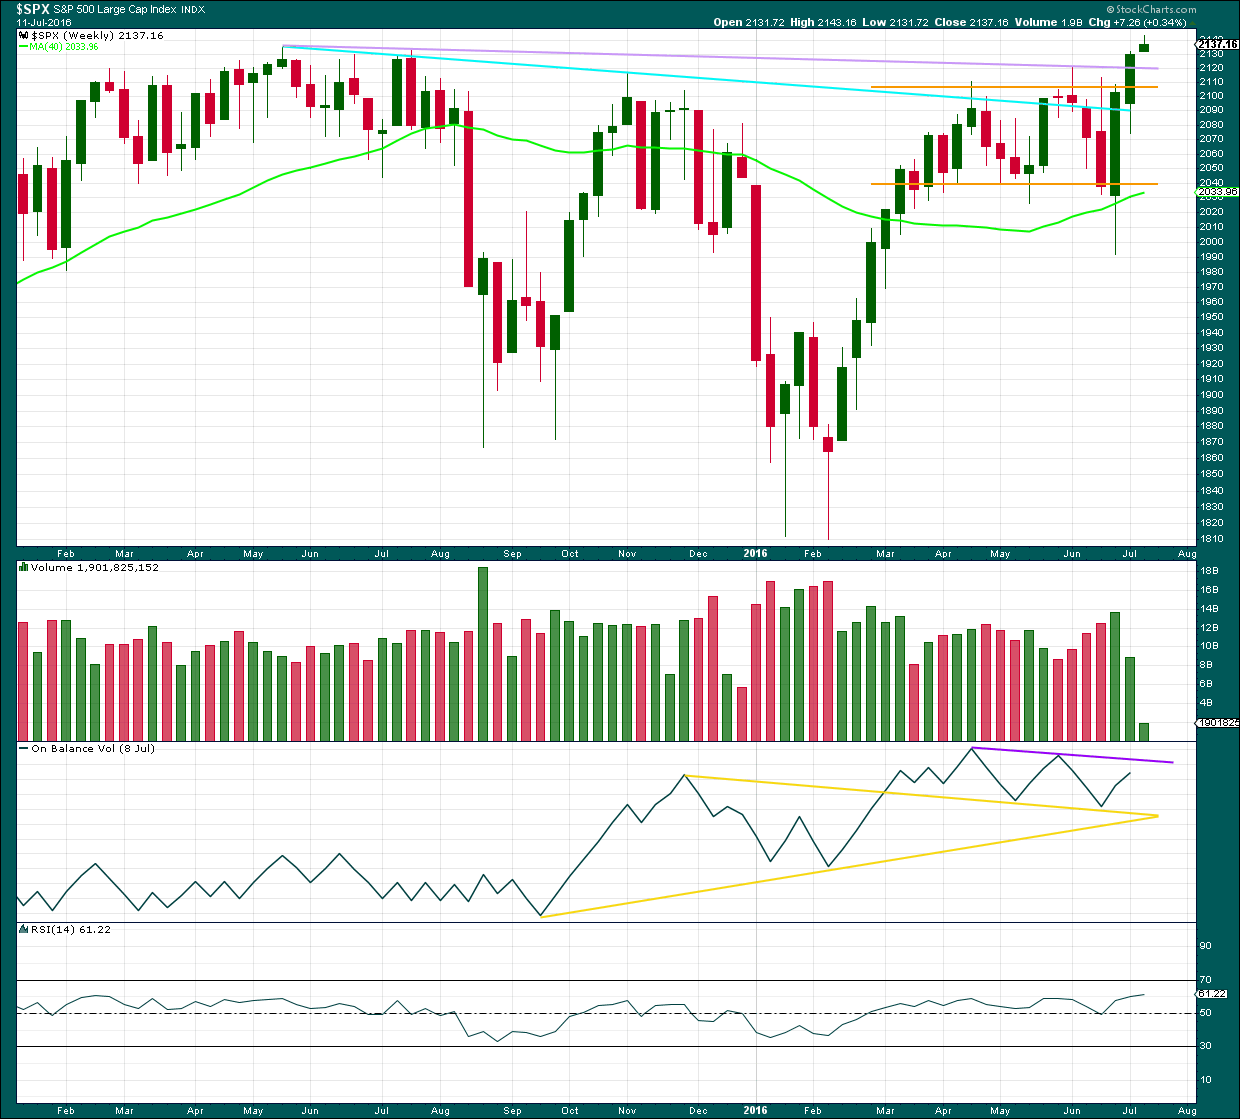
At the weekly chart level, it looks like price may be breaking above the upper orange resistance line, out of a recent consolidation zone. However, the breakout is on weak volume, so it is suspicious.
Volume is declining as price is rising. This is also clear at the daily chart level.
The lilac trend line line may provide some support for a downwards correction now that price is above it.
There is still double negative divergence with price and On Balance Volume at the daily chart level. This supports the main daily wave count over the alternate.
There is no bearish divergence between price and RSI at the weekly chart level though. I would give RSI more weight than divergence with OBV.
DAILY CHART
Click chart to enlarge. Chart courtesy of StockCharts.com.
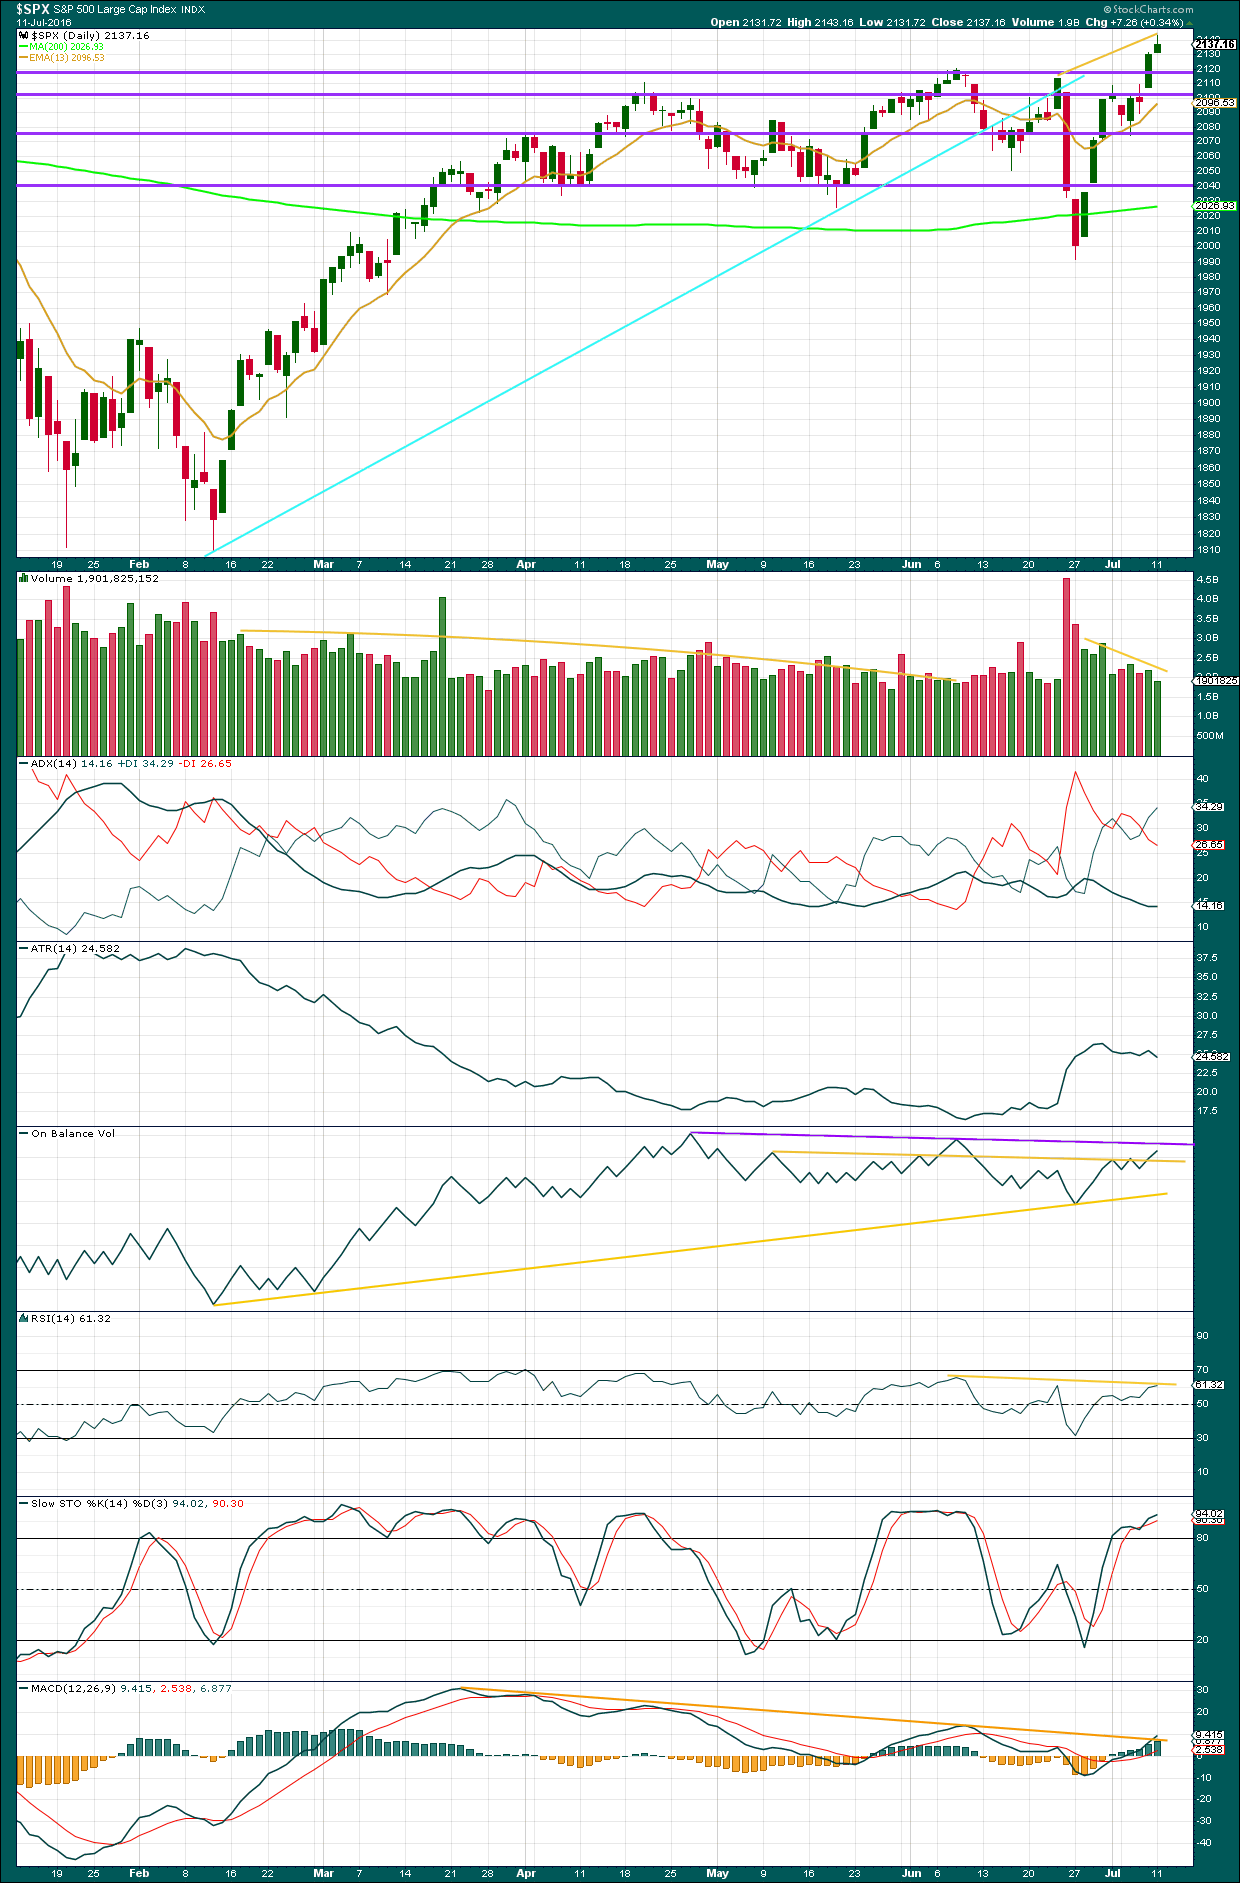
Overall, volume is declining as price is rising (yellow trend line on volume). This rise in price must still be suspicious. This supports the main daily wave count over the alternate.
Today’s candlestick has a small real body and a relatively long upper wick. Although the bulls were able to make a very important new all time high today, they couldn’t push price up very far and the bears rallied at the end of the session to bring price lower.
ADX today is essentially flat indicating no clear trend. ATR agrees as it is flat to declining. The trend is suspicious, so this slightly supports the main wave count over the alternate.
On Balance Volume today broke above an important trend line, now coloured yellow. There is a little room for OBV to move higher, so this should allow price to also move a little higher. OBV may be reasonably expected to find resistance at the purple line and now support at the yellow lines.
Despite a new all time high, RSI today has failed to make a corresponding new high. This divergence with RSI supports the main daily wave count over the alternate. Divergence with RSI is reasonably reliable. This is not the same as always, but it should be given more weight than divergence with most other oscillators.
The divergence noted up to yesterday with price and Stochastics has disappeared today. Stochastics is overbought, so it should be expected that with ADX and ATR indicating no clear trend price should swing lower and continue down until it finds support and Stochastics reaches oversold at the same time.
MACD still exhibits strong and persistent divergence with price. This upwards movement lacks momentum which supports the main wave count over the alternate. MACD today is beginning to break above its trend line.
VOLATILITY – INVERTED VIX MONTHLY CHART
Click chart to enlarge. Chart courtesy of StockCharts.com.
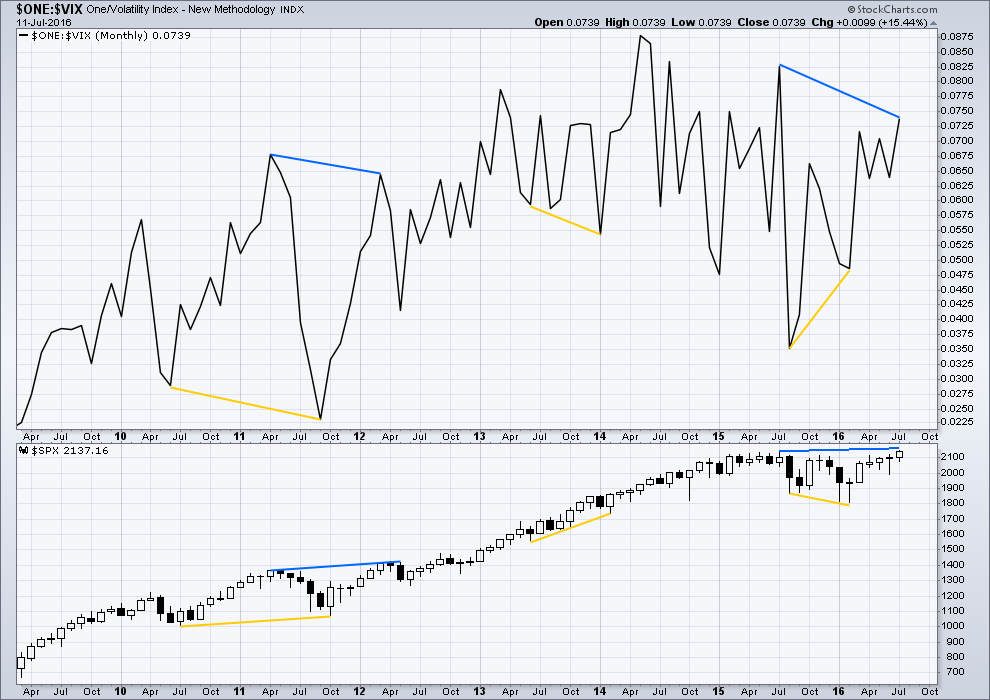
Inverted VIX has failed by a large margin to make a new high (latest blue lines) as price has made a new all time high today. This divergence indicates weakness in price; it is bearish. This supports the main wave count over the alternate.
VOLATILITY – INVERTED VIX DAILY CHART
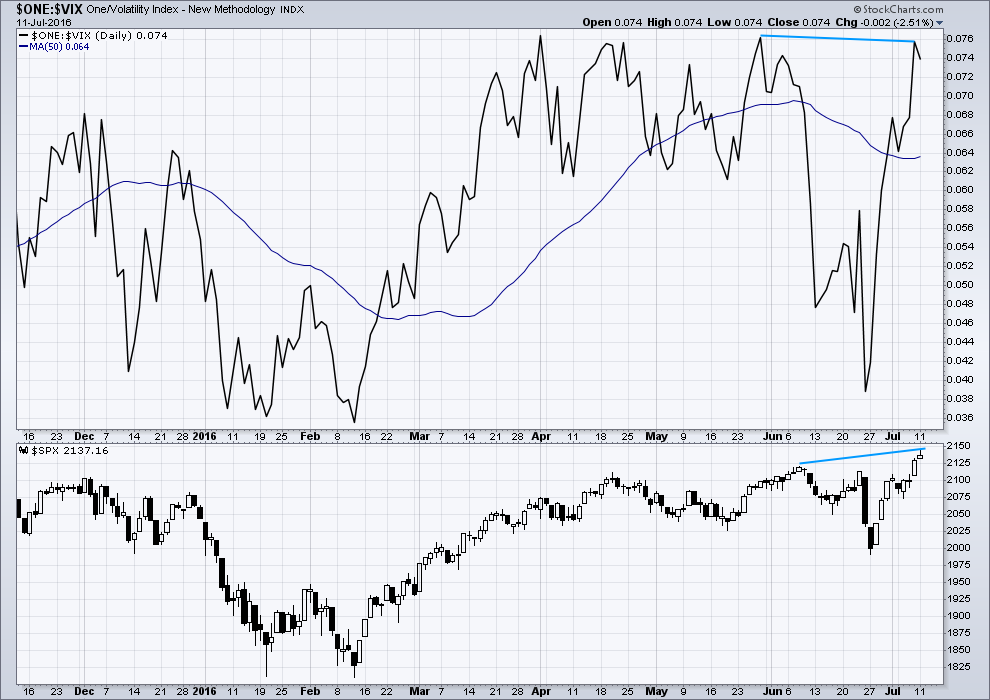
Click chart to enlarge. Chart courtesy of StockCharts.com.
VIX from StockCharts is inverted. As price moves higher, inverted VIX should also move higher indicating a decline in volatility which is normal as price moves higher. As price moves lower, inverted VIX should also move lower indicating an increase in volatility which is normal with falling price.
Along with multi month divergence between price and inverted VIX, there is also short term divergence (blue lines). This indicates weakness in price and supports the main daily wave count over the alternate.
BREADTH – McCLELLAN OSCILLATOR
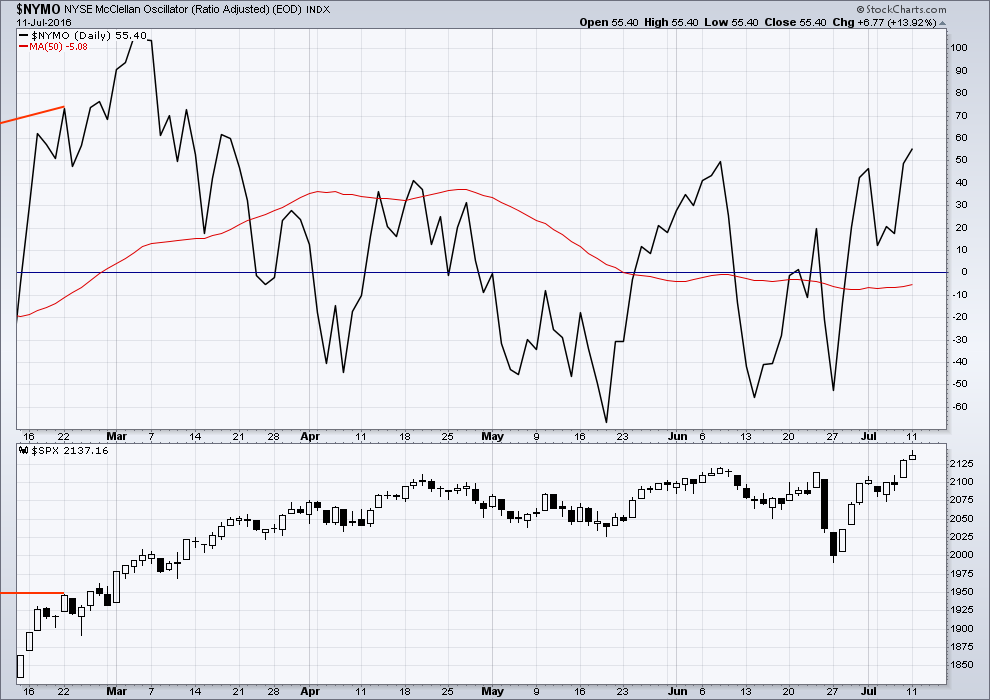
Click chart to enlarge. Chart courtesy of StockCharts.com.
There is no longer short term divergence between price and the McClellan oscillator. This upwards movement has some short term support from breadth.
However, I also subscribe to Lowry Research. They note that the market is currently characterised by a lack of breadth, it looks internally weak.
DOW THEORY
The last major lows within the bull market are noted below. Both the industrials and transportation indicies have closed below these price points on a daily closing basis; original Dow Theory has confirmed a bear market. By adding in the S&P500 and Nasdaq a modified Dow Theory has not confirmed a new bear market.
Within the new bear market, major highs are noted. For original Dow Theory to confirm the end of the current bear market and the start of a new bull market, the transportation index needs to confirm. It has not done so yet.
Major lows within the prior bull market:
DJIA: 15,855.12 (15th October, 2014) – closed below on 25th August, 2015.
DJT: 7,700.49 (12th October, 2014) – closed below on 24th August, 2015.
S&P500: 1,821.61 (15th October, 2014) – has not closed below this point yet.
Nasdaq: 4,117.84 (15th October, 2014) – has not closed below this point yet.
Major highs within the new bear market:
DJIA: 17,977.85 (4th November, 2015) – closed above on 18th April, 2016.
DJT: 8,358.20 (20th November, 2015) – has not closed above this point yet.
S&P500: 2,116.48 (3rd Nobember, 2015) – has now closed above this point on 8th June, 2016.
Nasdaq: 5,176.77 (2nd December, 2015) – has not closed above this point yet.
It is a reasonable conclusion that the indices are currently in a bear market. The trend remains the same until proven otherwise.
Elliott wave is a method that provides earlier indication of change than Dow Theory. At this stage, there is no bear wave count for the S&P500 which I have found. The bear market for the other indices is in doubt in terms of Elliott wave, but Dow Theory has not yet confirmed an end to the bear market and the beginning of a new bull market.
This analysis is published @ 12:07 a.m. EST on 12th July, 2016.

I must apologise for the late analysis today and yesterday.
This is taking me several hours of work to get done. And I could still do more!
It’s done now. Cesar will proof and publish shortly.
Thank you very much to all members for your patience.
Adjusted money base = all currency outside the Fed. It is such a voluminous amount, never promulgated before in history, no wonder our TA doesn’t work. Then add in of course all the other countries money pumping…
Yet it hasn’t let to inflation, all this printing money…. and it doesn’t seem to be flowing through the wider economy. It appears to be retained within the financial industry.
Or am I mistaken there Peter? You’d know about this better than I…
The inflation has been of a very specific kind- luxury real estate, art, and of course, equities in the form of hundreds of billions in stock repurchase programs…
Here’s an interesting read on how the S&P methodology has changed over the years. I can’t imagine that in the long term it would change the EW count much, particularly since the previous S&P high at 2134. There’s a part where it talks about a change within the last year but the article is old so that that change was in 2013.
“But, wait! There’s more! Last year, the S&P methodology was modified again to permit the inclusion of mortgage REITs. These special types of securities don’t actually represent equity ownership. They don’t even represent real estate ownership. Rather, they are bundles of debt portfolios – fixed income investments! Somehow, in the mind of Wall Street, it makes perfect sense to sell investors de facto bonds when they think they are buying stocks.”
http://www.joshuakennon.com/sp-500s-dirty-little-secret/
That’s why I subscribe to Lowrys Research. They measure Operating Companies Only within the S&P index, and measure how many of those are how far away from their ATH’s.
It’s a good measure of internal market strength.
And it’s another reason why I judged the bear wave count to have a higher probability. This market is internally weak. The rise in price is not supported by internal breadth. It’s just a few of the large caps pushing up price, or rather, buying is concentrated in a few large caps mostly.
Thanks Lara. I appreciate all the analysis and research along with the EW counts. One of these days, I will start doing counts, I just hate going outside my cozy, warm comfort zone.
So all they have to do as the earnings of real companies tank, is arbitrarily assign greater weighting to all this garbage and give it whatever value they want. This thing is a lot worse than any of us could possibly imagine. I think when it collapses people are going to be stunned with the rapidity. The whole thing is nothing but a house of rotten cards, and the Brexit plunge was just a dress rehearsal. Now not only am I worried about getting positioned when the whole thing starts to implode, one’s ability to exit even winning trades could end up being in jeopardy. What a mess!!
Yes, I am too worried about the ability to sell a Put option to the Market Maker under extreme conditions
I have to say I am
a bit surprised that anyone would need a zero hedge story to inform them that central banks have been dumping billions into equities. Granted that they have only recently begun to ‘fess up that this is what they have been doing, how is it possible that anyone observing price action in the market these past few years could not have come to that conclusion? Remember all those numerous instances in which we were all so sure that the market should start steep third wave declines?
Were we all delusional?
Did Lara get the TA wrong?
Did she get the wave counts wrong?
NO! NO! NO!
What we saw was a global criminal cartel so terrified of what would happen if the market took its natural course, that they were determined to keep prices propped up at any cost.
Did you really think all those times we were all so sure the market would head South based on all the TA signals and instead it did the exact opposite and headed North like a bat out of hell were mere co-incidence?!
We did not need Zero Hedge to tell us that Central Banks have been illegally intervening in equities markets and in fact have been doing it for years, admitted or not. All you had to do was pay attention to the way the market traded. Oh I know some disagree and will insist that they do not have that kind of power. Over the long term I certainly do agree with that viewpoint. Having said that, central banks are the sole reason that any equity market is trading at all time highs today. This is not due to the buying of regular investors, including institutional ones, and that’s the way it is! Things however, are going to change, and sooner than most think!
Okay, so I’m aware that many members here are still bearish. I’m aware some would be happy if I produced a bear wave count.
The problem is, any bear wave count I could come up with still needs a five up to complete from the low at 1,810 in February. And looking at this move up so far on the daily chart, trying to count that as a five either complete or close to complete looks very forced.
I think that would be forcing a count of what you want to see, and not fitting a count into what is actually there.
I could come up with this bearish wave count. But primary C still needs to complete as a five wave structure.
The end result is pretty much the same as the bull. A five up to complete, then followed by a devastating bear market.
The target is for primary C of a second zigzag to reach 0.382 of primary A.
Above 2,393.23 Super Cycle (b) would be longer than 2 X Super Cycle (a) so the idea should be discarded.
Very interesting — thanks for the hard work analyzing all possibilities. This adds to my reluctance to chase the final wave up of this market, be it bull or bear. Also, 2199 is an interesting target, as 2200 would probably be decently strong psychological resistance.
Interesting comment here as well as interesting article. As many here has speculated, there is now some evidence of what is happening. I found this comment fitting:
“While we remain deeply skeptical of the durability of such a policy-induced rally, unless there is a follow-through in terms of fundamentals, and in credit had already started to emphasize relative value over absolute, we suspect those with bearish longer-term inclinations may nevertheless feel now is not the time to position for them.”
Article and graphs are on zero hedge…
http://www.zerohedge.com/news/2016-07-12/mystery-who-pushing-stocks-all-time-highs-has-been-solved
Eventually the bankers will be the only participants at this rate.
but I would have expected a new ATH to get more players back in….
Lets see what volume does today.
It’s funny you mention only market buyers being the banksters. It highlights what for me will be the reason to get them so occupied with other more pressing matters that they will not have time to prop up the markets. When interest rates get to the point where they have to print 24/7 just to pay the interest on their debts, CBs will stop propping up the market. That ought to be really interesting!
Too bad the mystery is solved only after the ATH has reached. Meantime, another big green candlestick looking “weak” as we march higher and higher…
Anyone know what the ATH is on the greed index???
Extreme greed.
But an increase in volume today. Today was stronger than yesterday.
A few players in the market today…
You mean to tell me that you have actually been ignoring my voluminous commentary on bankster activity on the forum?! Say it ain’t so Joe…! 🙂
No mystery here…!
See Vix Graph at end of article:
http://www.zerohedge.com/news/2016-07-12/stock-panic-buyers-reach-extreme-greed
They stole my gag! 🙂
Haaa, that’s probably Verne doing all that hedging! 😉
They’ll soon need a gauge that goes to 11 (you’re welcome Spinal Tap fans 🙂 )
http://money.cnn.com/data/fear-and-greed/
Olga, I understand if you play Spinal tap that loud and press your ear against the wall…you can actually hear Central bankers giggling. Never done it..just saying.
thanks for the laugh Olga… needed that. These shorts I’m holding are p a i n f u l.
Dunno what happens after 100 – I can smell smoke….
Well I do feel like I’m running into a burning building.
Wearing a suit doused in gasoline.
CJ,
you are not the only one … shorts hurt at the moment …
I am intensely curious as to what ultimately happens when CBs relentlessly intervene in markets in an attempt to defeat natural market cycles and keep prices in a perpetual bull channel.
One thing I know for sure is that few folk are going to be selling this market in any kind of aggressive fashion. If the market begins to fall precipitously, it will not be because it is actively being sold. I think it will signal the limits of bankster legerdemain. That is the kind of market I am interested in shorting and the kind of inflection point I want to see…
Vern,
thank you for your comment! I do not have a great experience in trading, nevertheless your opinion perfectly matches my intuitive opinion: something is happening that may not be analyzed in terms of normal trading psychology. For sure we will witness something really amazing in a very few days… Hopefully something that will confirm my staying short on the SPX…
I think that for a market to keep going up, for a healthy sustainable bull market, it needs the participation of more than just bankers.
Eventually they may be the only ones participating in this market. Then when greed tips over to fear and fear takes hold a bear market will begin.
For now, there isn’t the selling pressure to bring price down.
The new ATH may bring more participants back into the market? Maybe that will be the key to finishing a weak third wave up.
Yet another clear impulsive wave down…here come the algos…are we looking at the death of EW theory??!! 🙂
At least VIX seems to think there is something to get excited about. Yet another day with market in the green, VIX in the green. Under normal circumstances this would be a huge red flag for bullish outcomes…
Keep an eye on interest rates. The bond market is the one entity that has the power to bring the equities market to heel, CB largesse notwithstanding. At between 40 and 50 T, the US bond market is at least 50% larger than all US equities markets combined, and the FED cannot jawbone yields at the outer edge of the curve. I went long TBT a few weeks ago and have been under water the entire time while everyone kept talking about how yields were headed into negative territory. Long term yields are stealthily on the move, and they will ultimately determine the markets’ fate, not the FED. I expect to be back at break-even, or very close to it, at the end of this week….
I will be looking for an oversold bounce on TLT after this second red candle under the upper BB and adding substantially to my short long bond position. Ignoring SPX.
Intermediate (b) is 1.38 x (a) at 2156.65
By way of illustration of some of the commentary lately from some folk I think know what they are talking about; here are the opening lines from this month’s missive from a publication from Bill Bonner that I subscribe to, the “Bill Bonner Letter”:
” BALTIMORE – Yesterday, the S&P 500 hit a new all-time high.
And the Dow is now less than 100 points below its record close. If you haven’t sold yet, dear reader, this may be one of the best times ever to do so.
Writing on the Wall
We welcome new readers to our monthly publication, The Bill Bonner Letter, with a simple insight: Markets are contrary, pernicious, and downright untrustworthy.
Just when the mob begins to bawl most loudly for stocks… the market sets its trap.
Longtime Diary sufferers will be quick to straighten out the record. We’ve warned that stocks have reached a peak several times over the last four years.
Each time, we thought we saw the writing on the wall… and each time, we were mistaken. We raised our Crash Alert flag.
But the poor ol’ Black and Blue just fluttered in the wind, as stock prices rose ever higher. Eventually, it became so tattered, we took pity on it, folded it up, and put it away.
In the interest of full disclosure, as well as reputation hygiene, we saw a bear market coming in 1999 and 2007, too.
We were right then.
But lately, we’ve either been dead wrong… or dead early. ”
I do have the OK from Agora to reproduce short portions for commentary! 🙂
dear lara as you wrote few days of downwards movement to end just below 1,991.68. can you explain why ?
because what i see the price break up megaphone pattern and normaly i think that its have to come down at 2140 ??? please explain again please
Because 1,991.68 would see intermediate (C) of primary 2 end just below intermediate (A). A truncation and very rare running flat would be avoided.
Lara,
Do you have any thoughts yet on what the next Bear market will look like in terms of depth and duration once this bill market completes? I am prepared to sit out the rest of this bull market (I am just not comfortable being long here).
Thanks again for all your analysis!
Peter
“I am prepared to sit out the rest of this bull market (I am just not comfortable being long here)”
Yer defo not on your own there Peter! 🙂
I expect that it may be devastating. When it arrives it should be clear in terms of wave structure, a big clear five down to start.
It should last several years. A Grand Super Cycle wave II should last over 10 years.
And like the Great Depression there will be a B wave recovering in there that will convince everyone that it’s over, right before a devastating C wave falls.
That’s my pick anyway. And as always, as you all know by now, I could be wrong.
I see 5 waves down on the 5 min chart and a corrective wave up. Going short here on SPX and risking todays high.
It almost seems as if there is an algo dedicated to buying five wave declines. I noticed this a few weeks ago and commented on the fact that you can no longer rely on that kind of signal to trigger trade entries. I believe this is all part of the price discovery destruction that is a consequence of relentless CB intervention in the markets. We are witnessing the break-down of usually reliable TA signals and it is making the market a very dangerous and unstable place even for experienced traders. I am waiting for them to loose control and that is not a matter of if, it is a matter of when. In the meantime, I would not rely on the usual trade triggers- they no longer work reliably…
You may be on to something there. Maybe we should join the algo. 🙂
Vern or anyone else…
I have been searching around for another take on EW as a solution to my issues.
Have you heard of this guy Eduardo Mirahyes and his EW take?
If you have, do you have any opinions?
I am reading some of his work but need more time to digest it.
I have heard of him and looked at a few of his charts. He is a very committed bear but I find his charts difficult to understand- he sees diagonals everywhere and they seem to be the basis of all his wave counts. There is something very strange going on with the current price action and lots of analysts I respect are reflecting that ambivalence in their commentary about how very unlikely these new highs seemed just a short while ago. The glaring divergence with transports are also commonly cited, as well as the ongoing low volume and weak momentum which are not characteristic of what should be the strongest portion of a third wave up. We are not the only ones who are bewildered. The idea of a paradigm shift and uncharted waters keeps coming to mind as I look at what is happening. I very much sympathise with Peter’s expressed desire to keep a respectful distance. I still think something quite ugly is about to unfold, but I just do not know how to quantify it in terms of EW theory or the aggressive bullish moves we have been seeing of late.
BTW, I never actually subscribed to Eduardo newsletter and the free stuff on his website is rather fragmentary when it comes to explaining his analytical approach.
I have to read this a few more times to get it… But some of what I gathered is that he was expecting this New AT High before the actual crash at Super Cycle Degree… he, according to one of his charts advised to go short at the close this Monday July 11th after the new highs were set. A crash is how all this will end, he say’s and charts.
He is calling his approach “The New Elliott”
He say Prechter doesn’t get his diagonal concepts. He says Prechter discarded Elliott’s A-B base pattern… Also say’s Prechter miscounted at Super Cycle & Grand degree.
“RN Elliott’s “A-B Base”, long discarded by Robert Prechter, has been reinstated as a key structure, and re-christened the a-b transition, to precede every reversal, regardless of direction. This transcending structure was long relegated to the “garbage heap”, of mere noise for decades.”
This a-b transition is the basis for all his large degree charting. He brings the Fed effect into this it as well and also some of Shiller’s valuation work and Mandelbrot’s Market fractal discoveries.
This is a good read… Read New-Wave Elliott Part 1 and Part 2… search for it… not sure I should be posting a link here. There is a ton of reports on the internet, to include the latest July 9th or 10th.
It’s a different view point… Calls it a “highly evolved Elliott Wave Principle which adds to the established version advanced and refined over 26 years.”
Yes I remember his criticism of Prechter’s alteration of that aspect of R.N. Elliott’s analytical approach and when you read Frost and Prechter’s work he is quite right. Prechter gives a reason for why he did this but I don’t remember what he said it was. I had forgotten about that aspect of what he said distinguished his approach from EWI.
I have no problem with you posting a link here. Link away.
Competition is healthy. If he’s got something to offer that I’m missing then post a link. I’ll look at it too.
Thanks, Lara… I was asking the board because I never hear of this guy before and wanted to see if anyone here knew him or heard of him. I am still trying to digest exactly what he is saying about that A-B- Base discarded by Prechter & Frost and his charts.
A few different links… Start with:
New Elliott Wave Part 1 (Revised 3-23-2016) http://exceptional-bear.com/resources/New-Wave+Elliott+Part+I+reviesed+March+24$2C+2016.pdf
New EW Part 2: http://www.exceptional-bear.com/resources/New+Wave+Ellioitt+part+2$2C+revised+Nov+2014.pdf
RN Elliott A-B Base: http://www.exceptional-bear.com/resources/Nature$27s+Law+revisisted.pdf
Stock Charts Public: http://stockcharts.com/public/1957888
https://www.linkedin.com/in/mirahyes
Then LinkedIn Profile with more links:
https://www.linkedin.com/today/author/mirahyes?trk=prof-sm
Lara,
I just read through this material for the 2nd time today. This time in a more deliberate manor. I highly recommend that you read the 3 reports in pdf format when you have available time. This Diag II (A-B Base) seems to hold a solution, if I understand this correctly.
I see that the linkedin material is no longer public. Need to be a linkedin member which I am but have not yet tried to access it that way.
Have a great day, Joe
Great observations Vern. Although I don’t think EW theory is dead, it is merely reflecting the reality that this thing is like having sex with a gorilla….it’s going to continue until the gorilla wants to stop.
Funniest thing I’ve read in a long time!!!
Maybe Leonardo DiCaprio could give us some insight into that particular matter…! 🙂
Maybe Virunga should be our mantra until this market starts to reflect some modicum of reality.
You should change nightclubs Gary (or drinks) 🙂
“The prior problem of how to see the downwards wave labelled primary wave W is resolved with this wave count. This movement looks like and fits perfectly as a zigzag; any wave count that tried to see it as an impulse did not look right.”
Hi Lara: Did you mean to say “labelled primary wave Y”?
Your humble editor, Ex Officio… 🙂
Remarkable. I guess we stay above the mean for a longer time frame.
I don’t think it’s remarkable that we are far above the mean and now likely to stay there for a couple of more years. From your own chart one can see that from 1930 to 1995, a period of some 65 years, we were only ABOVE the mean for about 15 years of that time (circled area). That means 75% of the time from 1930 to 1995 we have been below the mean.
Except that valuations are so high as well
Looking at the futures, the expectation is for the invalidation of the 2,146 target at the open today. When I consider high from Oct 2007 around 1547-1600 and drop into March 2008 to 666, I can see the following extensions for the bullish case
1. 2,225 -2,235 level representing 1.272 extension.
2. Depending on the momentum (and greed) next extension (1.618) will be at 2,335-2,337.
The 2146 is not an invalidation point, however, is it? Lara’s analysis states: “The common length for intermediate wave (B) is from 1 to 1.38 the length of intermediate wave (A), giving a range from 2,111.05 to 2,156.41.
The idea of a flat correction should be discarded when intermediate wave (B) exceeds twice the length of intermediate wave (A) above 2,230.42.”
I have to step away for a few weeks. Vacation soon… just starting early.
It’s also very hard to read the posts and the analysis at this time.
I just don’t understand a Bull Count at this time… It’s NOT logical, to me anyway! I know EW has rules and that is what the analysis say’s but… Something is NOT Right… doesn’t feel right. Maybe a solution will materialize other than what is currently above with some passing of time.
In the meantime, I have to figure out what to do with the situation I am sitting with… before the losses become really big losses. But that is my problem… just don’t want to compound it!
Good Luck all!
Have a great vacation Joe!
FWIW, I too have a nagging sense of unease about what I see developing. The waves are what they are but here is what I think could be afoot.
Everybody, and I mean EVERYBODY! is now bullish on the stock market as a result of the new ATH. Even those with bearish leaning recognize the significance of this new SPX high. Optimism will be universal. I expect the 2100 pivot to be soon retested and in my opinion that would be a opportune time to exit remaining short positions.
Here is what all the bullish masses are not taking into consideration: we are living in a world awash in economic and political instability, new SPX high or not. Many of us on this board have talked about exogenous shocks, and in my opinion waves cannot fully account for these kinds of events. I expect the mania to really take hold after the upcoming correction. I also expect, in the middle of the euphoria, a so-called black swan event of some kind to occur, and one could take one’s pick from any number of possible scenarios. The Hague decision today over the South China Sea and China’s defiant response being just one example.
I think this event, whatever it is, is going to result in a rudely truncated fifth wave, with Mr. Market accomplishing what he always does so well- ambushing the crowd.
Vern,
Time to go short will be when the PM bulls get whacked hard by the asset rotation. I see distribution on the NUGT and GDX front but maybe I am misreading the trading pattern over the last few days.
Thanks Vern… I will try.
It could certainly be that my targets are too high and my expectation for 16 to 23 months of overall upwards movement is too long.
We could have a truncated fifth. The end of Grand Super Cycle I and the start of Grand Super Cycle II.
I’ve been thinking Verne, all your musing about something not being right, a third wave down shouldn’t behave like that…. all along you were right.
When the bear arrives it should be very clear indeed.
Lowrys noticed a lack of selling pressure, price was falling of its own weight when it fell in the last months. The market was not overly bullish, but nor were the bears active.
When the market is ready to turn then selling pressure should come in to force price down.
For now, it’s rising on declining volume and so that is unsustainable. It should be fully retraced, but before that happens it can drift slowly higher for some time…..
Indeed! I expected a super cycle third wave down, even at smaller degrees to be relentless and breath-taking; I kept wondering why it wasn’t taking my (nor the banksters’, for that matter!) breath away…
Joe,
I am doing the same, stepping away for a bit. I hope you have a great vacation. I will be reading the blog now and then. But I just will not be actively participating in the conversations at least not to the level I have most recently. Like you, I am not sure what to make of the situation. So stepping back seems like a good idea. I have a vacation planned starting late next week with some of my family members including my eldest granddaughter. I am going to blank out the market and investing. Instead, I will invest myself fully into my family. I will relax, renew, and refresh. Then I can come back with a positive and confident disposition.
————————————————————————————————————–
Vern,
A black swan event certainly may happen. I have one EW analyst who has several targets for this next wave up. 2246 is the first and lowest of these. If it is correct, then we do not have too far to go. Hang in there and keep giving your commentary, it is very helpful to those on this blog.
—————————————————————————————————————
Olga,
It was nice to see your presence again yesterday. I have learned a great deal about EW and trading strategies from you. Thank you very much.
—————————————————————————————————————
Lara,
I know you feel bad about the recent developments. You do not need to apologize to me because you always warned us that there was the possibility of a bull count even though you did not have confidence in it. I am responsible for all my decisions and I alone am responsible. I hope you will soon be able to put this behind you and go forward with the excellent and confident analysis you have always provided. Your trading advice has also always been excellent. Let the water go under the bridge and focus on what is ahead of us. In my book, you will always be tops. Thank you always.
—————————————————————————————————————
To all the rest of my friends here, I am blessed and grateful to read your thoughts and comments. Always interesting and quite helpful. Like Olga has always encouraged us, it is best to separate our trading from our emotions. I look forward to many months and years together with you as we all prosper in whatever the market throw at us.
Blessings to you all. See you soon,
Rodney
All the best Rodney. Thank you so much for your kind words. The forum just won’t be the same without you, and Joe as well. I also will probably be scaling back my famous (infamous?!) stream-of-consciousness commentary and patiently waiting to see what Mr. Market has in store. I suspect he is not quite done with surprises.
I cannot think of a more glorious and profitable way to redeem precious time than to spend it with family! Have a wonderful time and I am hoping to do the same shortly with my family.
All the best Rodney – hope to see you back soon.
Rodney, You enjoy your vacation as well. Tuff for me to walk away completely when atm I am trapped in this mess… looking for a solution or exit.
Thank you very much Rodney. A break is a really good idea.
Be happy and refreshed. May your family all be well and healthy.
Actually, if you draw the neckline “less tight” you could calculate the target as 2137 + 327 = 2464. But I don’t know all the rules involved with head and shoulder calculations and where you draw the neckline etc but it does seem like this is a possibility.
Could we have a reverse Head and Shoulder completing after primary 2 is finished? Price could be calculated to around 2400 which would be very close to Lara’s Wave V target of 2500.
Lara,
Based on the fundamentals, my gut feeling is that a crash should still arrive soon. In other words, I am not done with a bear wave count yet. Would it be possible that 2134 is just one point but not the invalidating point and 2146 or a little higher perhaps can be the highest point in a new bear wave count? Would you please consider that possibility? Thanks!
Elliott wave rules are black and white.
If there has been a trend change at Super Cycle or Grand Super Cycle degree (the only degrees really which would allow a huge bear market at this time) then within them the new ATH means 2 moved beyond the start of 1.
The rule is violated. The wave count is invalid.
Now, the only way it could work would be to see the whole movement up from March 2009 as an almost compete (or just now complete) single or double zigzag.
My challenge to you is to make that work. In terms of a trend channel and subdivisions. Make it have the right look and subdivide properly.
I have spent considerable time on it. This does not mean a solution isn’t to be found, only that I could not find it today. If you find one, let me know.
Tomorrow.
I’m out of time today.
Tomorrow I’ll look at Nasdaq and RUT.
I don’t actually have a wave count for RUT, just classic TA. Will update Nasdaq count and FTSE counts in the next couple of days.
no problem! I mostly trade the RUT.
thanks Lara! much appreciated.
ThanQ 🙂
Hi Lara, I hope this is not too annoying of a request, but knowing the SPX is a bull market, can you please update the count for Nasdaq???
Thanks in advance 🙂
And RUT? I logged in FIRST tonight so i can make that one request!!!!!! ?
🙂
Will look at them tomorrow
I still have US Oil to do tonight
Lara, im curious what you see on RUT?
Peter has brought up divergence between the 2 indexes…
Do you see the same wzves count on rut? Do you mind sharing a pic of daily?
second?
First?