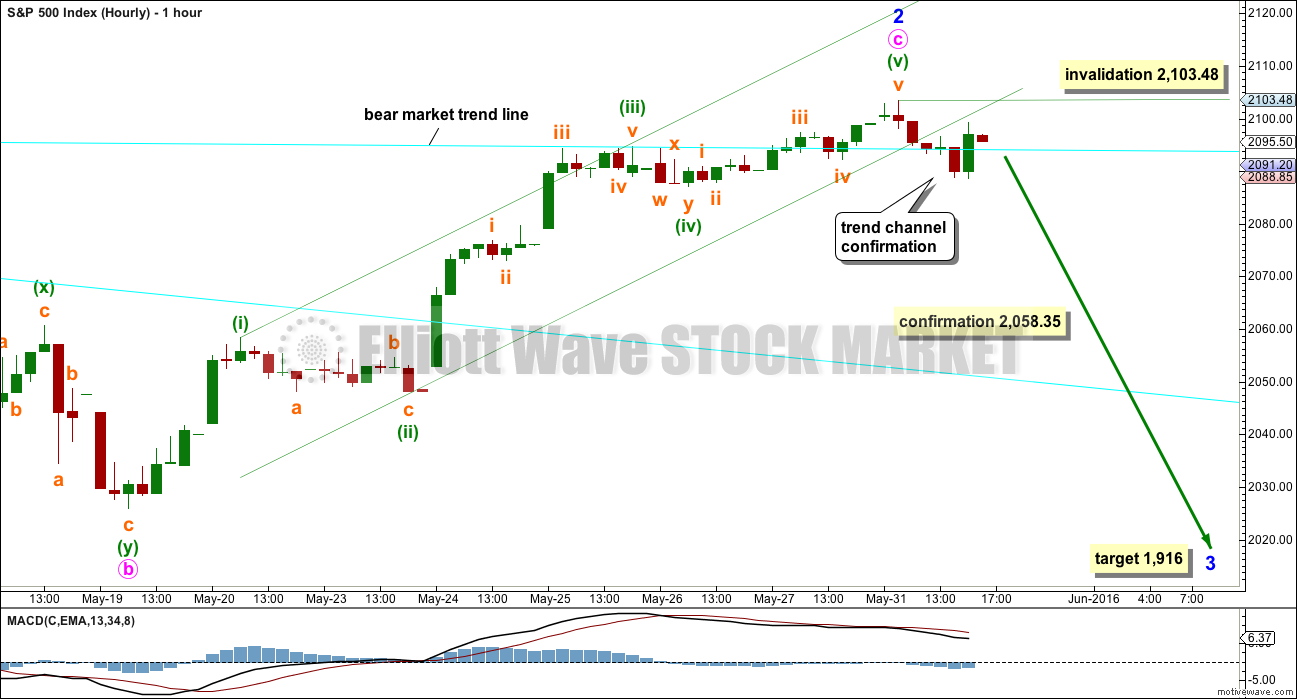
The target at 2,099 was slightly overshot at the start of today’s session, but price then turned down to breach the channel on the hourly chart.
So far price is behaving as expected and offering what looks like a perfect trade set up during today’s session.
Summary: The wave count now expects to see a third wave down. The short term target is now at 1,916. The long term target remains at 1,423. Risk should still be calculated at 2,111.05, but for the less adventurous it may now be set at 2,103.48. Persistent weakness in upwards movement is noticed and volume favours more downwards movement. This looks like a very good low risk high reward opportunity. Nothing is ever 100% certain though, so always manage risk: never invest more than 5% of equity on any one trade and always use a stop loss to protect your account.
To see last published monthly charts click here.
To see detail of the bull market from 2009 to the all time high on weekly charts, click here.
New updates to this analysis are in bold.
BEAR ELLIOTT WAVE COUNT
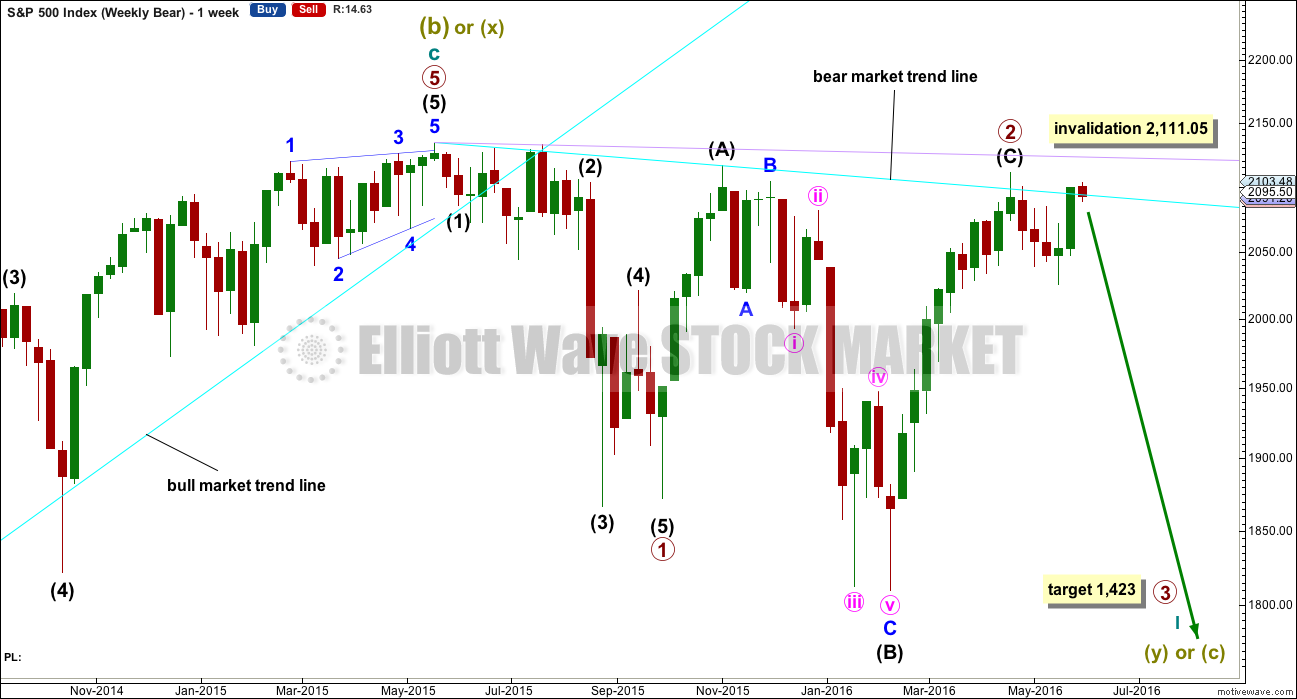
WEEKLY CHART
This bear wave count fits better than the bull with the even larger picture, super cycle analysis found here. It is also well supported by regular technical analysis at the monthly chart level.
Importantly, there is no lower invalidation point for this wave count. That means there is no lower limit to this bear market.
Primary wave 1 is complete and lasted 19 weeks. Primary wave 2 is over lasting 28 weeks.
An expectation for duration of primary wave 3 would be for it to be longer in duration than primary wave 1. If it lasts about 31 weeks, it would be 1.618 the duration of primary wave 1. It may last about a Fibonacci 34 weeks in total, depending on how time consuming the corrections within it are.
Primary wave 2 may be a rare running flat. Just prior to a strong primary degree third wave is the kind of situation in which a running flat may appear. Intermediate wave (B) fits perfectly as a zigzag and is a 1.21 length of intermediate wave (A). This is within the normal range for a B wave of a flat of 1 to 1.38.
Within primary wave 3, no second wave correction may move beyond its start above 2,111.05.
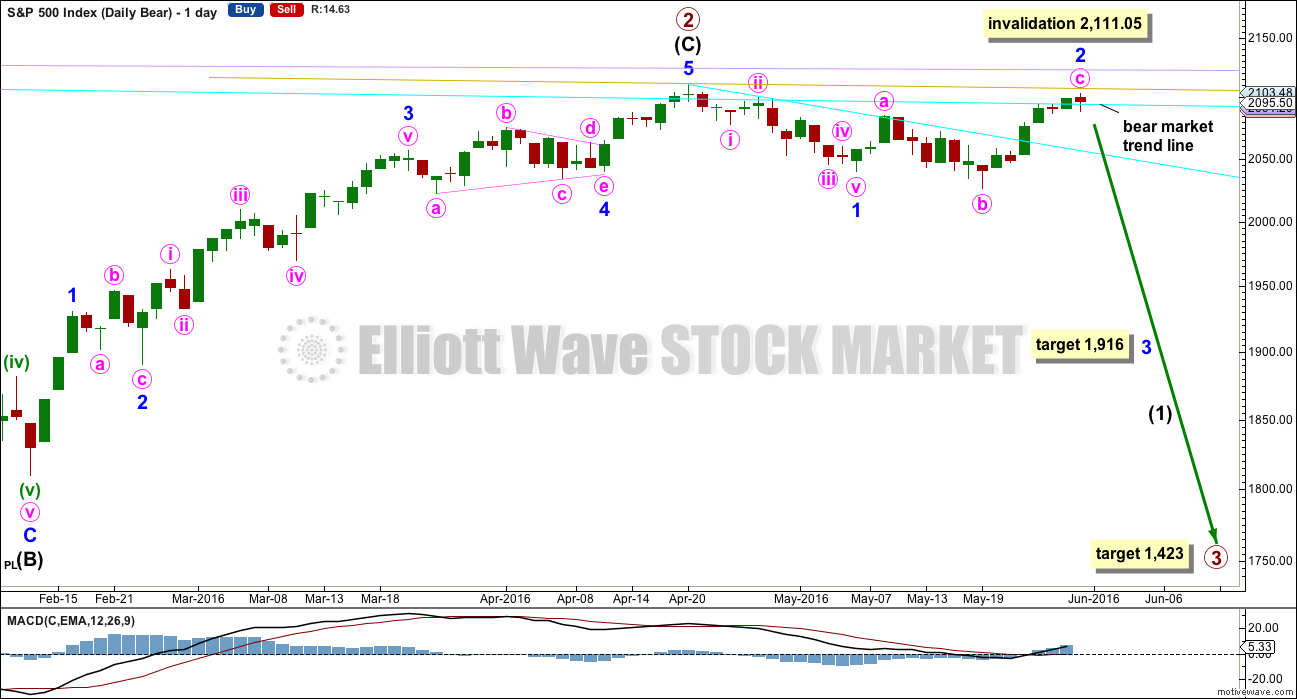
DAILY CHART
If intermediate wave (C) is over, then the truncation is small at only 5.43 points. This may occur right before a very strong third wave pulls the end of intermediate wave (C) downwards.
The next wave down for this wave count would be a strong third wave at primary wave degree. At 1,423 primary wave 3 would reach 2.618 the length of primary wave 1. This is the appropriate ratio for this target because primary wave 2 is very deep at 0.91 of primary wave 1. If this target is wrong, it may be too high. The next Fibonacci ratio in the sequence would be 4.236 which calculates to a target at 998. That looks too low, unless the degree of labelling is moved up one and this may be a third wave down at cycle degree just beginning. I know that possibility right now may seem absurd, but it is possible.
Alternatively, primary wave 3 may not exhibit a Fibonacci ratio to primary wave 1. When intermediate waves (1) through to (4) within the impulse of primary wave 3 are complete, then the target may be calculated at a second wave degree. At that stage, it may change or widen to a small zone.
Minor wave 2 fits perfectly as a very common expanded flat correction. Minute wave b is a 1.3 length of minute wave a, nicely within normal range of 1 to 1.38. Minute wave c is 4.08 points longer than 1.618 the length of minute wave a. Minute wave c has a clear five wave look to it on the daily chart.
At 1,916 minor wave 3 would reach 2.618 the length of minor wave 1. This is the appropriate ratio to use for this target because minor wave 2 is very deep at 0.9 the length of minor wave 1.
Notice that the bear market trend line has been overshot before at the high labelled primary wave 2, so it may be overshot again. A parallel copy of the bear market trend line is drawn in gold and placed on the high labelled primary wave 2. This line was almost touched with today’s high. At this time, this line may be the final line of resistance.
Minor wave 2 may not move beyond the start of minor wave 1 above 2,111.05. This is the risk to short positions at this stage.
If any members are choosing to enter short positions here, then manage risk carefully: Do not invest more than 3-5% of equity on any one trade and always use a stop loss to contain losses.
HOURLY CHART
Draw a channel about minute wave c using Elliott’s technique: draw the first trend line from the highs labelled minuette waves (i) to (iii), then place a parallel copy on the low labelled minuette wave (ii).
Minor wave 2 began the session by moving slightly higher, then price turned and breached the green channel containing minute wave c providing trend channel confirmation of a trend change. Now that there is some confirmation of a trend change the invalidation point at the hourly chart level may be moved lower. Within minor wave 2, no second wave correction may move beyond its start above 2,103.48.
When there is a clear five down on the hourly chart, then the invalidation point (and final risk) may be moved down also at the daily chart level. That cannot be done today.
Price turned for a throw back to find resistance at the lower edge of the trend line after the trend channel was breached. When price behaves like that it offers a low risk entry point to join the new trend, in this case down. Risk is lowered because entry is made after some confirmation of a trend change and stops may be set just above the prior high, in this case 2,103.48.
A new low below 2,058.35 would provide price confirmation of a trend change. This is the high of minuette wave (i) within minute wave c. A new low below 2,058.35 could not be a fourth wave correction within an impulse unfolding upwards because it may not move into first wave price territory.
At 1,916 now minor wave 3 would reach 2.618 the length of minor wave 4.
For position traders who prefer to hold a position for weeks or months, the final target of 1,423 may also be considered for short positions entered here. Minor wave 2 was a very deep and relatively time consuming expanded flat correction. When minor wave 4 arrives it may be a relatively quick and shallow zigzag. The S&P can behave a little like a commodity during big third waves of bear markets: momentum accelerates at the middle of a third wave and remains strong towards the end, forcing fourth wave corrections to be brief and shallow with final fifth waves ending on swift strong movement.
This does not mean that this is how the S&P will behave this time, but it does mean that the probability of it doing so is high.
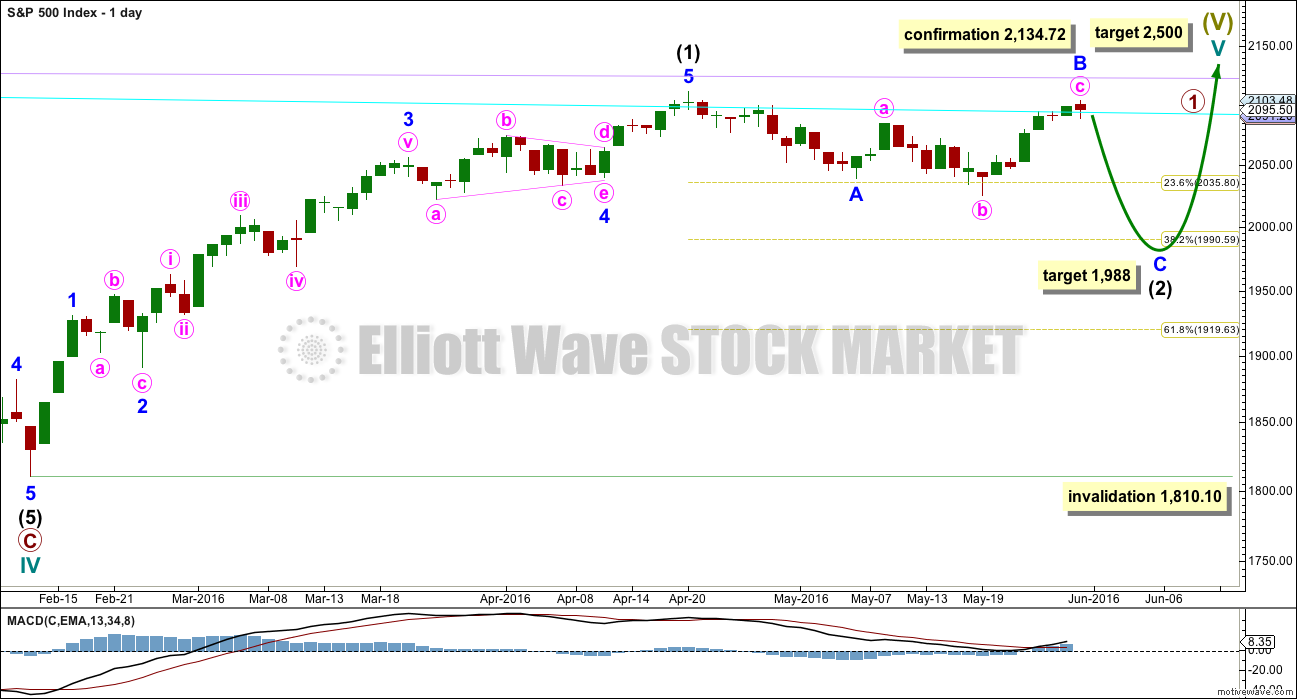
BULL ELLIOTT WAVE COUNT
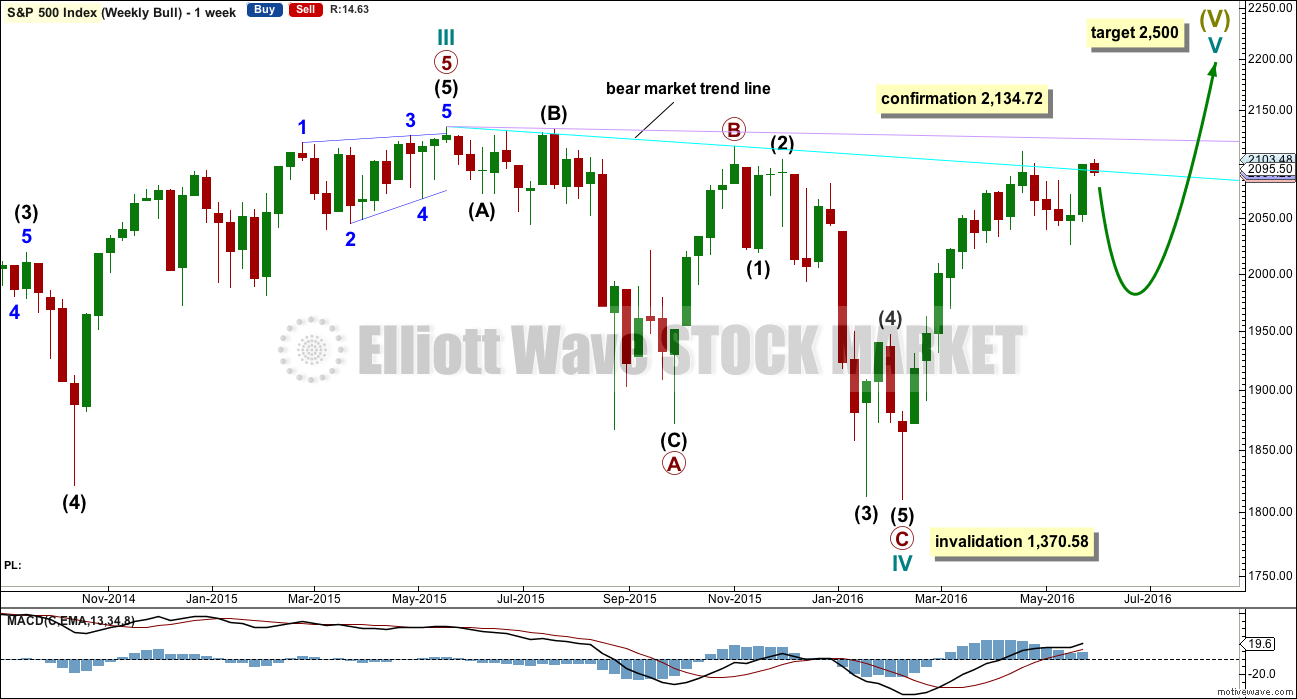
WEEKLY CHART
Cycle wave IV is seen as a complete flat correction. Within cycle wave IV, primary wave C is still seen as a five wave impulse.
Intermediate wave (3) has a strong three wave look to it on the weekly and daily charts. For the S&P, a large wave like this one at intermediate degree should look like an impulse at higher time frames. The three wave look substantially reduces the probability of this wave count. Subdivisions have been checked on the hourly chart, which will fit.
Cycle wave II was a shallow 0.41 zigzag lasting three months. Cycle wave IV may be a complete shallow 0.19 regular flat correction, exhibiting some alternation with cycle wave II.
At 2,500 cycle wave V would reach equality in length with cycle wave I.
Price remains below the final bear market trend line. This line is drawn from the all time high at 2,134.72 to the swing high labelled primary wave B at 2,116.48 on November 2015. This line is drawn using the approach outlined by Magee in the classic “Technical Analysis of Stock Trends”. To use it correctly we should assume that a bear market remains intact until this line is breached by a close of 3% or more of market value. In practice, that price point would be a new all time high which would invalidate any bear wave count.
This wave count requires price confirmation with a new all time high above 2,134.72.
While price has not made a new high, while it remains below the final bear market trend line and while technical indicators point to weakness in upwards movement, this very bullish wave count comes with a strong caveat. I still do not have confidence in it.
The invalidation point will remain on the weekly chart at 1,370.58. Cycle wave IV may not move into cycle wave I price territory.
This invalidation point allows for the possibility that cycle wave IV may not be complete and may continue sideways for another one to two years as a double flat or double combination. Because both double flats and double combinations are both sideways movements, a new low substantially below the end of primary wave C at 1,810.10 should see this wave count discarded on the basis of a very low probability long before price makes a new low below 1,370.58.
DAILY CHART
If the bull market has resumed, it must begin with a five wave structure upwards at the daily and weekly chart level. That may today be complete. The possible trend change at intermediate degree still requires confirmation in the same way as the alternate hourly bear wave count outlines before any confidence may be had in it.
Intermediate wave (2) may be an incomplete zigzag. Within the zigzag, minor wave B may now be a complete expanded flat. At 1,988 minor wave C would reach 1.618 the length of minor wave A. This ratio is used for this target because intermediate wave (2) should be expected to be relatively deep. If this target is wrong, it may not be low enough. The next likely target would be the 0.618 Fibonacci ratio at 1,920.
In the long term, this wave count absolutely requires a new high above 2,134.72 for confirmation. This would be the only wave count in the unlikely event of a new all time high. All bear wave counts would be fully and finally invalidated.
TECHNICAL ANALYSIS
WEEKLY CHART
Click chart to enlarge. Chart courtesy of StockCharts.com.
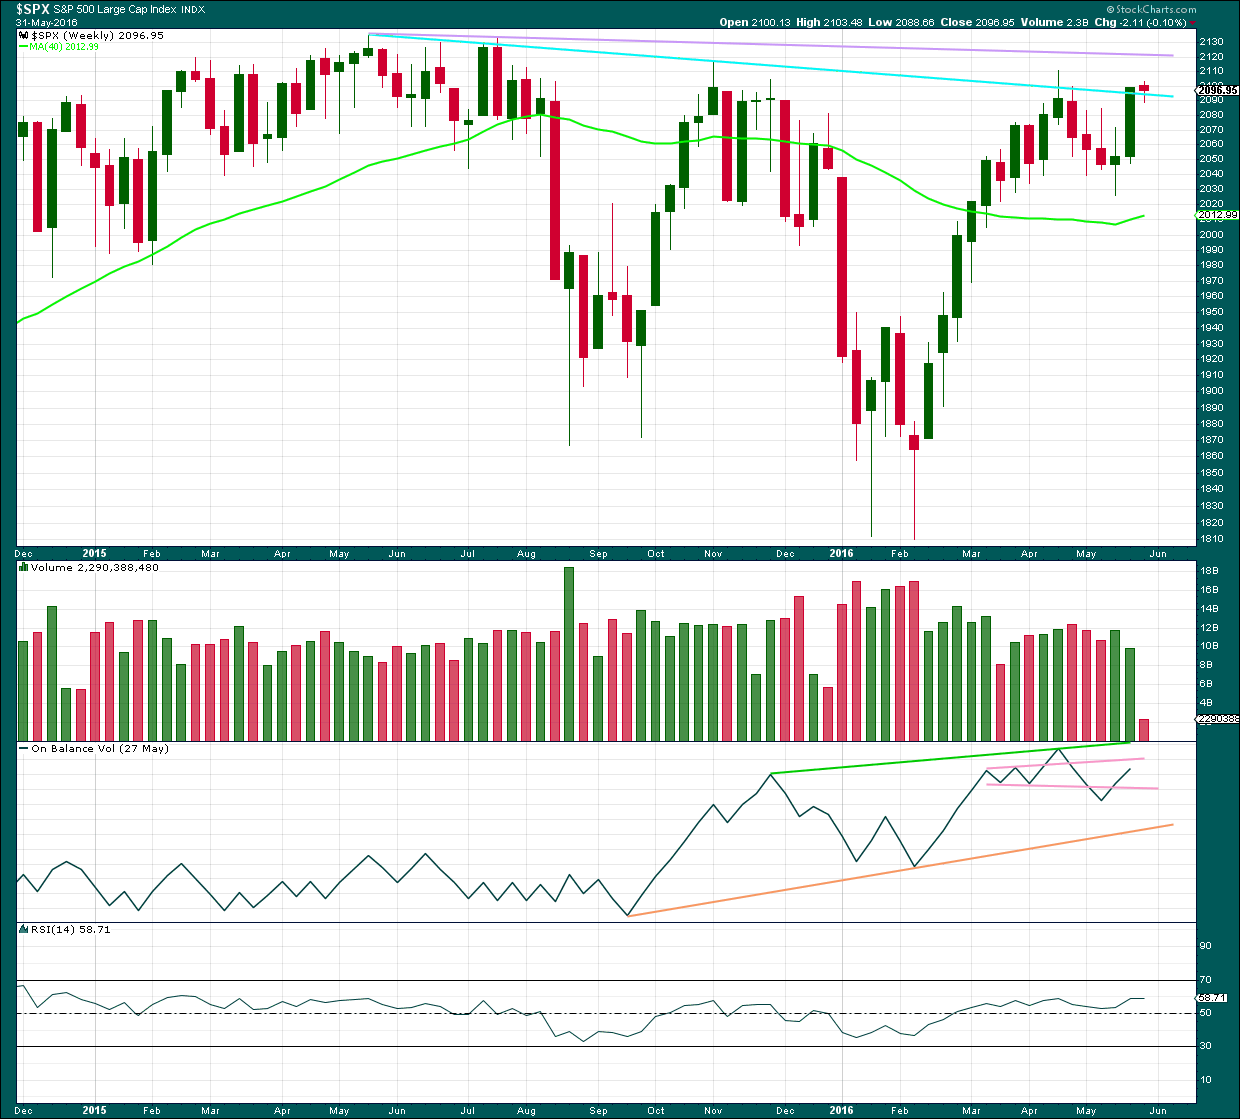
There is a bearish engulfing candlestick pattern at the last high. This has occurred at the round number of 2,100 which increases the significance. Volume on the second candlestick is higher than volume on the first candlestick, which further increases the significance. That it is at the weekly chart level is further significance.
Engulfing patterns are the strongest reversal patterns.
Now this pattern is followed by another red weekly candlestick. The reversal implications of the pattern are confirmed.
This is a very strong bearish signal. It adds significant weight to the expectation of a trend change. It does not tell us how low the following movement must go, only that it is likely to be at least of a few weeks duration.
There is also a Three Black Crows pattern here on the weekly chart. The first three red weekly candlestick patterns are all downwards weeks. The pattern is not supported by increasing volume and only the third candlestick closes at or near its lows; these two points decrease the strength of this pattern in this instance. That the pattern occurs at the weekly chart level increases its strength.
Last week completes a strong bullish candlestick, but it comes on declining volume. Price was not supported by volume although price managed to move substantially higher.
This pattern was seen back in July 2015 on this weekly chart. The week ending 13th of July, 2015, completed a strong bullish candlestick after a week immediately prior which completed a candlestick with a small real body and a long lower wick. The second candlestick there too came on declining volume. The following week managed to make a slight new high, but the advance of the bullish candlestick was fully retraced within two weeks.
The conclusion must be that this candlestick is bullish and would support more upwards movement. But the decline in volume is very concerning and indicates that if price does continue higher, it may not be by much.
On Balance Volume trend lines have been redrawn. OBV is constrained within two larger lines (green and orange). A break above the green line would be a strong bullish signal. A break below the orange line would be a strong bearish signal. OBV is constrained more short term between the two pink lines. The upper line may provide resistance; a break above it would be a weak bullish signal. The lower line has been tested and breached; this line is weak. A break below the lower pink line would be a weak bearish signal.
There is some long held divergence here between On Balance Volume and price. Between the last two major swing lows in price at the end of August 2015 and early February 2016, price made new lows but OBV made a higher low. This regular bullish divergence indicated the February low in price was weak. It was followed by a major upwards swing from price.
Now, from the major swing high for price in early November 2015 to the last major swing high in April 2016, price has made a lower high but OBV has made a higher high. Price cannot make a corresponding new high despite OBV making a new high. Price is weak. This hidden bearish divergence now supports the Elliott wave count.
DAILY CHART
Click chart to enlarge. Chart courtesy of StockCharts.com.
Volume data on StockCharts is different to that given from NYSE, the home of this index. Comments on volume will be based on NYSE volume data when it differs from StockCharts.
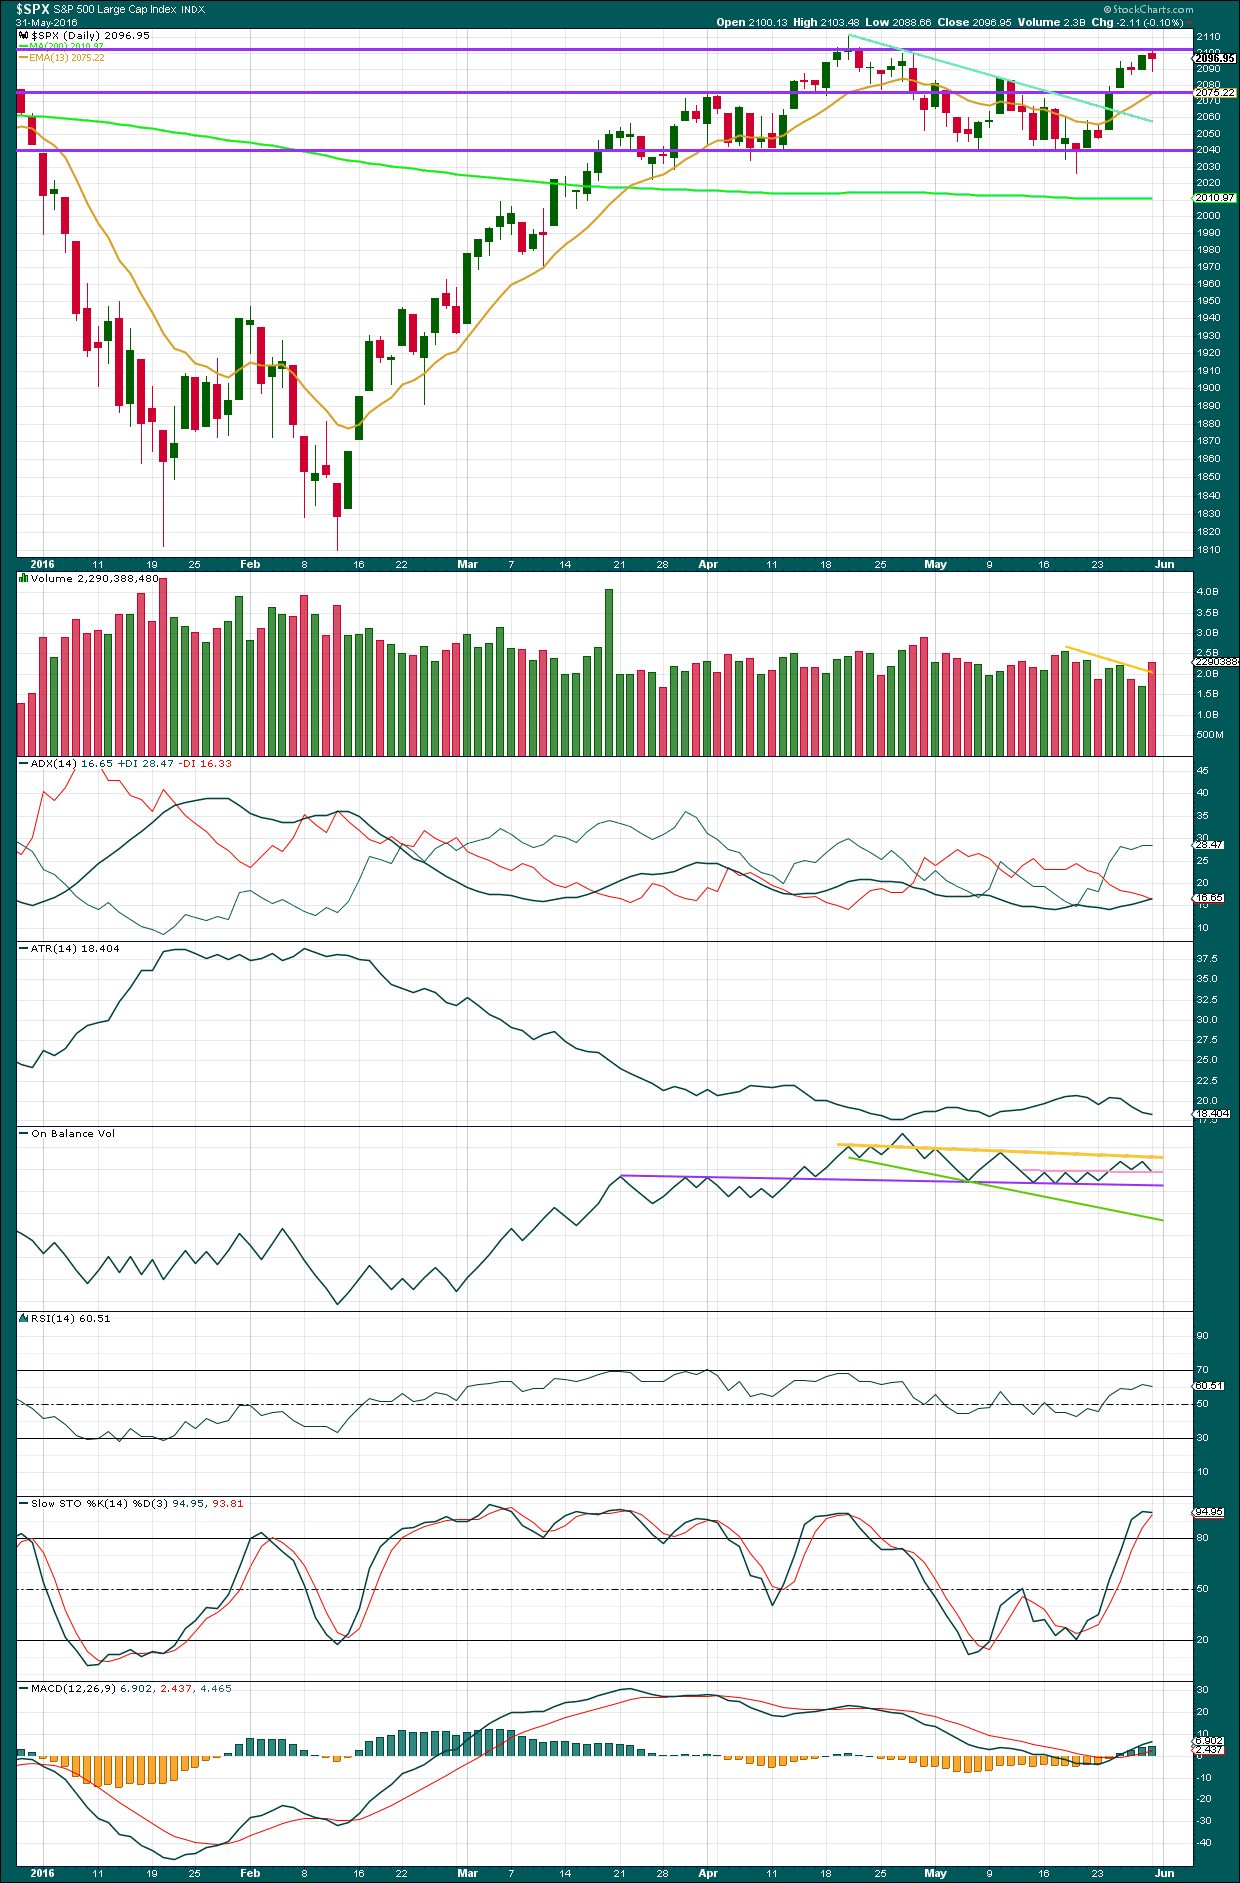
Today’s candlestick is a hanging man. This is a reversal pattern, but the bullish implications of the long lower shadow mean that it requires bearish confirmation with either an open below the real body of the hanging man or preferably a close below the real body.
Volume for today’s downwards day is higher. The fall in price was supported by volume. Volume for today is higher than the last five trading days.
Price looks like it has again found resistance about the round number pivot of 2,100, the purple horizontal resistance line.
ADX still indicates an upwards trend is in place. This indicator is lagging as it is based on a 14 day average.
ATR today is still declining, disagreeing with ADX. During the last rally of seven days, ATR overall declined which indicates the rally is more likely a bear market rally than part of a bull market. Declining ATR is normal for counter trend movements and not normal for a sustainable trend.
RSI is not extreme and exhibits no divergence with price.
Stochastics is overbought. If this rally is a countertrend movement, then it may end here or very soon.
On Balance Volume has come down to find support at the short pink trend line. This line has some significance as it is horizontal and has been tested a few times. This may provide some support to initiate a small bounce. There is not a lot of room for upwards movement though; OBV is finding resistance at the yellow line.
A break below the pink line would be a reasonable bearish signal from OBV. A break below the purple line would be a strong bearish signal.
A break above the yellow line would be a weak bullish signal from OBV. Weak because this line has been breached before yet OBV returned below it.
VOLATILITY – INVERTED VIX DAILY CHART
Click chart to enlarge. Chart courtesy of StockCharts.com.
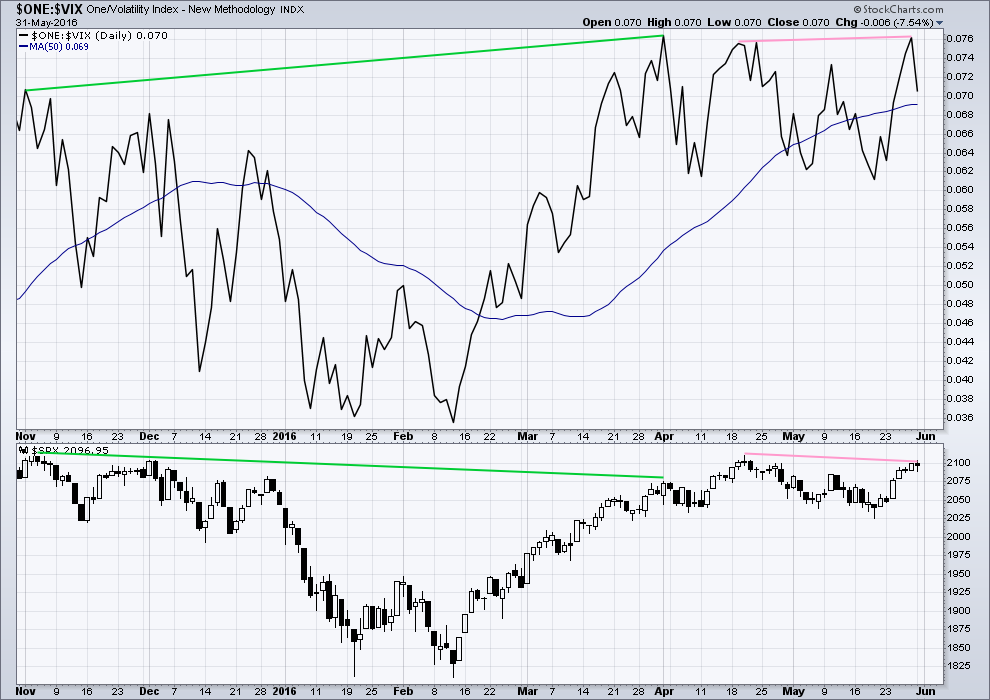
Volatility declines as inverted VIX climbs. This is normal for an upwards trend.
What is not normal here is the divergence over a reasonable time period between price and inverted VIX (green lines). The decline in volatility did not translate to a corresponding increase in price. Price is weak. This divergence is bearish.
There is now double negative hidden bearish divergence between price and VIX (pink lines). At the end of last week, VIX has made a new high above the prior swing high of 20th of April yet price has failed to make a corresponding new high. This indicates weakness in price. Volatility has declined below the point it was at on 20th of April, but this has failed to be translated into a corresponding rise in price.
BREADTH – ADVANCE DECLINE LINE
Click chart to enlarge. Chart courtesy of StockCharts.com.
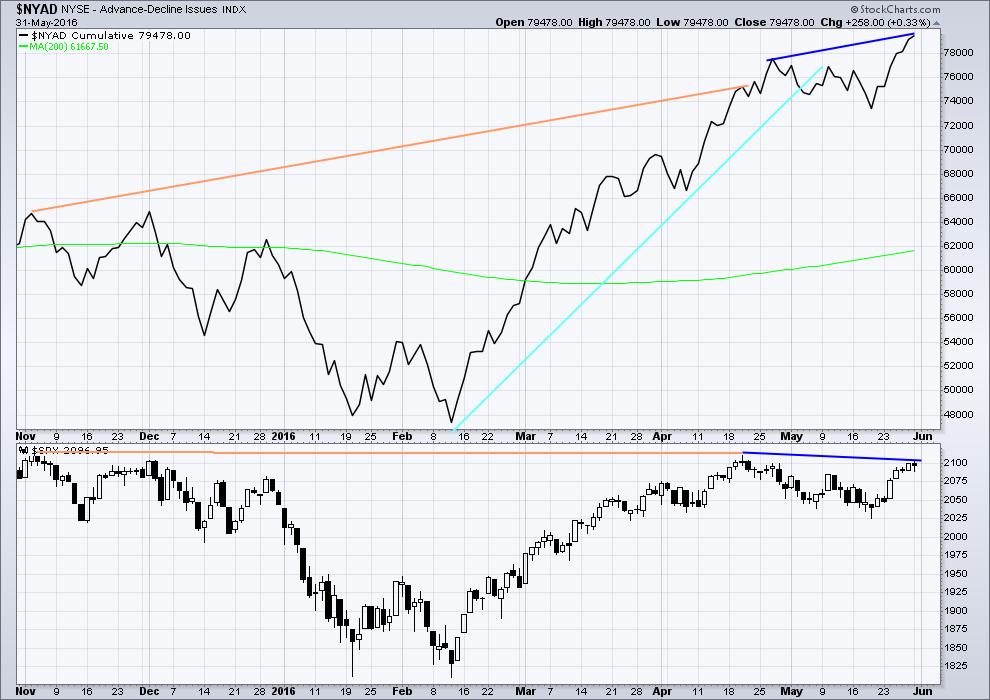
With the AD line increasing, this indicates the number of advancing stocks exceeds the number of declining stocks. This indicates that there is breadth to prior upwards movement.
From November 2015 to 20th April, the AD line made new highs while price far failed to make a corresponding new high. This indicates weakness in price; the increase in market breadth is unable to be translated to increase in price (orange lines).
The 200 day moving average for the AD line is now increasing. This alone is not enough to indicate a new bull market. During November 2015 the 200 day MA for the AD line turned upwards and yet price still made subsequent new lows.
The AD line is now declining and has breached a support line (cyan). There is breadth to downwards movement; more stocks are declining than advancing which supports the fall in price.
There is now double hidden bearish divergence between price and the AD line at the end of this week (dark blue lines). The AD line has made a new swing high above the prior high of 20th of April. This increase in breadth to upwards movement has failed to translate into a corresponding rise in price. Price has failed to make a new high above 20th of April. This indicates weakness in price.
Price today moved lower to complete a red daily candlestick yet the AD line moved upwards. The increase in market breadth today could not be translated into an increase in price. Price is weak. This divergence (although only daily) is bearish.
ANALYSIS OF LAST MAJOR BEAR MARKET OCTOBER 2007 – MARCH 2009
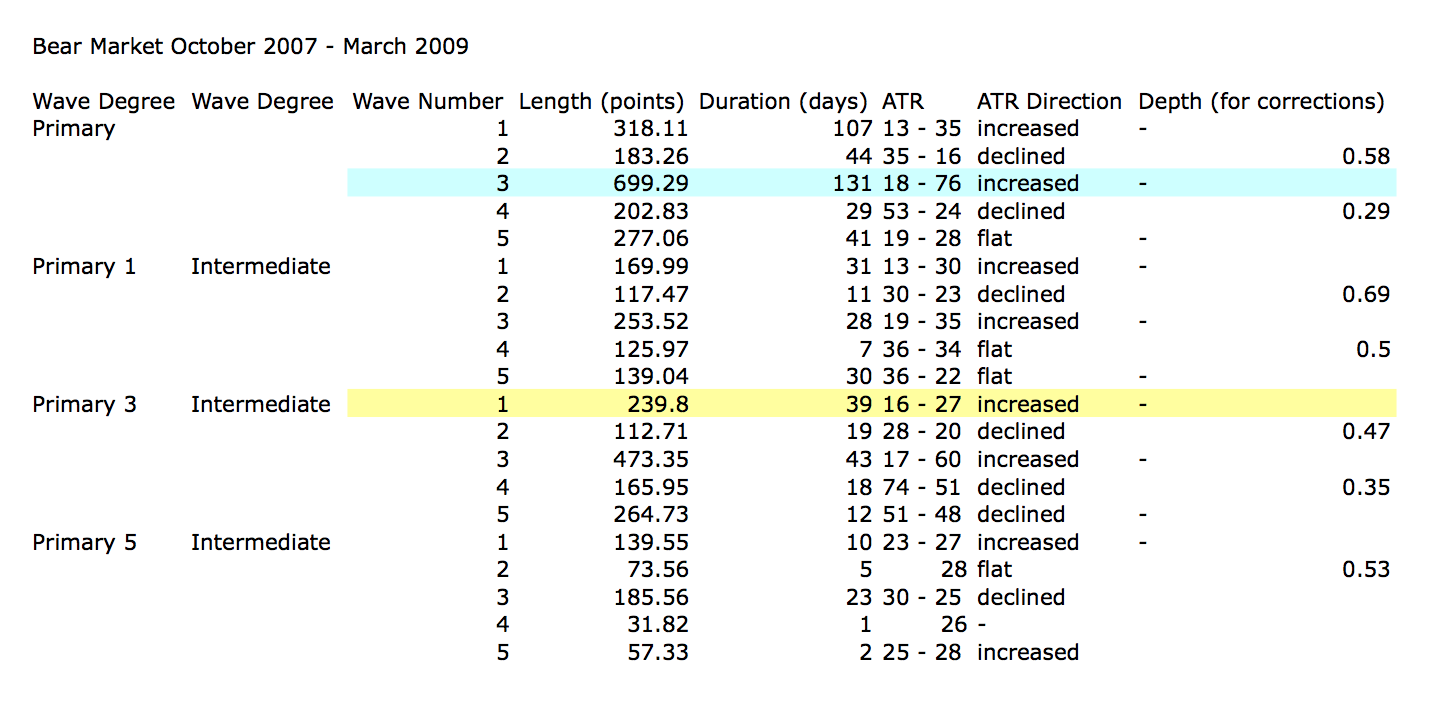
In looking back to see how a primary degree third wave should behave in a bear market, the last example may be useful.
Currently, the start of primary wave 3 now may be underway for this current bear market. Currently, ATR sits about 19. With the last primary degree third wave (blue highlighted) having an ATR range of about 18 to 76, so far this one looks about right.
The current wave count sees price in an intermediate degree first wave within a primary degree third wave. The equivalent in the last bear market (yellow highlighted) lasted 39 days and had a range of ATR from 16 – 27.
To see some discussion of this primary degree third wave in video format click here.
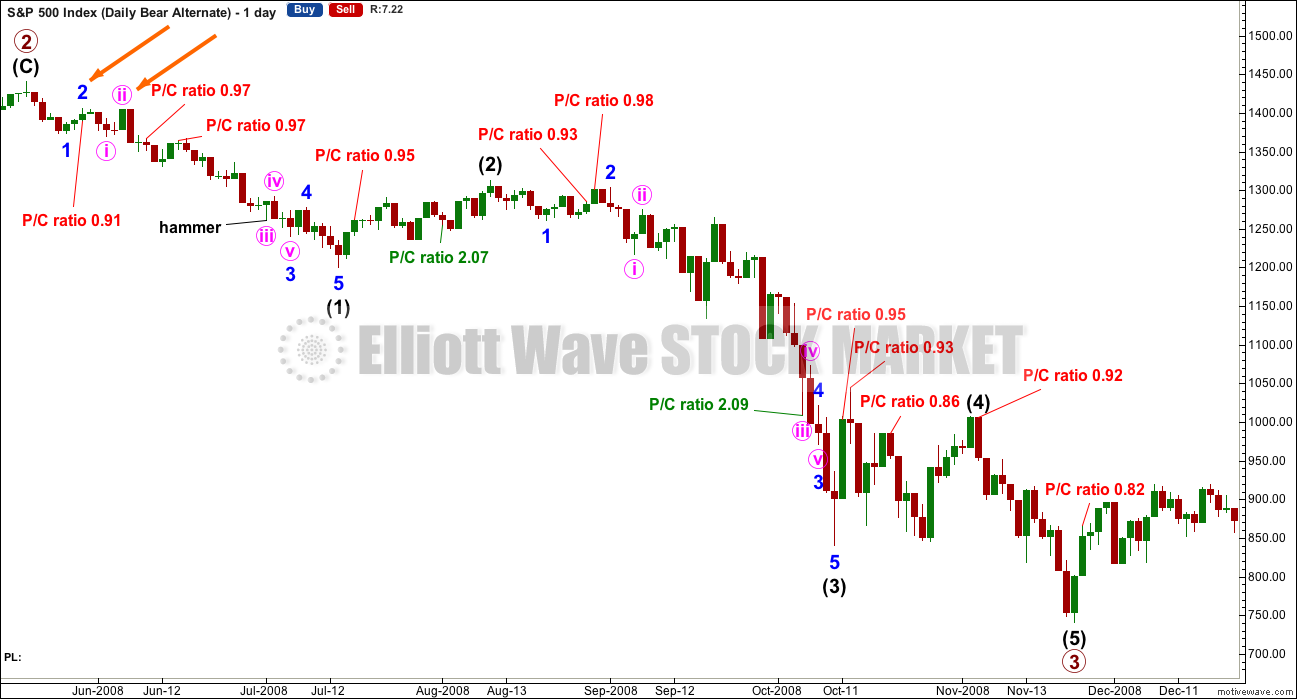
This chart is shown on an arithmetic scale, so that the differences in daily range travelled from the start of primary wave 3 to the end of primary wave 3 is clear.
Primary wave 3 within the last bear market from October 2007 to March 2009 is shown here. It started out somewhat slowly with relatively small range days. I am confident of the labelling at primary degree, reasonably confident of labelling at intermediate degree, and uncertain of labelling at minor degree. It is the larger degrees with which we are concerned at this stage.
During intermediate wave (1), there were a fair few small daily doji and ATR only increased slowly. The strongest movements within primary wave 3 came at its end.
It appears that the S&P behaves somewhat like a commodity during its bear markets. That tendency should be considered again here.
Looking more closely at early corrections within primary wave 3 to see where we are, please note the two identified with orange arrows. Minor wave 1 lasted a Fibonacci 5 days and minor wave 2 was quick at only 2 days and shallow at only 0.495 the depth of minor wave 1.
Minute wave ii, the next second wave correction, was deeper. Minute wave i lasted 3 days and minute wave ii was quick at 2 days but deep at 0.94 the depth of minute wave i.
What this illustrates clearly is there is no certainty about second wave corrections. They do not have to be brief and shallow at this early stage; they can be deep.
This chart will be republished daily for reference. The current primary degree third wave which this analysis expects does not have to unfold in the same way, but it is likely that there may be similarities.
Put / Call ratios are added from data published at CBOE. This ratio is the index ratio published, not the ratio specifically for the S&P500. It should be a reasonable indicator of sentiment. Only values above 2 and below 1, extremes, are noted. A low P/C ratio indicates more long positions than short, so it is interpreted as bearish, a contrarian indicator. A high P/C ratio indicates more short than long positions, so it is interpreted as bullish, a contrarian indicator.
There were two instances where the P/C ratio gave a bullish extreme above 2 during primary wave 3. One instance happened right at the end of the middle of the third wave. My conclusion is that the P/C ratio may be a reasonable sentiment indicator, but it is not to be taken definitively. It should be one piece of information weighed up alongside other information. Currently, the index P/C ratio is not extreme. Only extremes will be noted.
DOW THEORY
I am choosing to use the S&P500, Dow Industrials, Dow Transportation, Nasdaq and the Russell 2000 index. Major swing lows are noted below. So far the Industrials, Transportation and Russell 2000 have made new major swing lows. None of these indices have made new highs.
I am aware that this approach is extremely conservative. Original Dow Theory has already confirmed a major trend change as both the industrials and transportation indexes have made new major lows.
At this stage, if the S&P500 and Nasdaq also make new major swing lows, then my modified Dow Theory would confirm a major new bear market. At that stage, my only wave count would be the bear wave count.
The lows below are from October 2014. These lows were the last secondary correction within the primary trend which was the bull market from 2009.
These lows must be breached by a daily close below each point.
S&P500: 1,821.61
Nasdaq: 4,117.84
DJIA: 15,855.12 – close below on 25th August 2015.
DJT: 7,700.49 – close below on 24th August 2015.
Russell 2000: 1,343.51 – close below on 25th August 2015.
To the upside, DJIA has made a new major swing high above its prior major high of 3rd November, 2015, at 17,977.85. But DJT has so far failed to confirm because it has not yet made a new major swing high above its prior swing high of 20th November, 2015, at 8,358.20. Dow Theory has therefore not yet confirmed a new bull market. Neither the S&P500, Russell 2000 nor Nasdaq have made new major swing highs.
It is important to note here that traditional Dow Theory (using only DJT and DJIA) has confirmed a bear market and not confirmed the end of that bear market and the start of a new bull market. I would consider Dow Theory to be a solid and effective tool to determine overall market direction. This is another reason why I have little confidence in the alternate bullish Elliott wave count.
This analysis is published @ 06:02 p.m. EST.

The idea of updated British index. comments please easy language ):
Lara have a look at the Bearish Breakaway candle pattern, I think it fits the pattern for the last 6 trading days on the daily chart
I’m not familiar with a bearish breakaway pattern as it’s not in Nison’s book.
I found this from Bulkowski:
“Look for 5 candle lines in an upward price trend with the first candle being a tall white one. The second day should be a white candle with a gap between the two bodies, but the shadows can overlap. Day three should have a higher close and the candle can be any color. Day 4 shows a white candle with a higher close. The last day is a tall black candle with a close within the gap between the bodies of the first two candles.”
So I guess here the first candle of the pattern would be the tall green candle of 24th May. Day 2 would be 25th May, and it does have a gap. So far so good.
Day 3 would be the small red doji of 25th May and it doesn’t have a higher close. It has a slightly lower close than the prior day.
Day 4 is okay, a green candle with a higher close.
But day 5 isn’t a tall red candle and doesn’t have a close within the gap between the bodies of days 1 and 2.
So if we’re using Bulkowski’s definition I don’t think we have a bearish breakaway pattern.
Sorry John, I’m a stickler for rules and detail being right.
As I mentioned in a post few days back, I am coming to the conclusion that the expanded flat is the most common EW evidencing bankster shenanigans and sure enough, it looks like we have another one today. It seems to be we should be expecting to see this pattern at the end of every impulse as the banksters furiously fight this developing down-trend. The b wave move past the previous low is a very effective feint and it is hard to prepare for it, especially since I was not at all expecting minuette one down to end so quickly. I guess one has to simply adapt as Mr. Market shucks and jives his way to the downside! 🙂
If we have a bunch of expanded flats (and a running flat for primary 2) in second wave positions, then we may have quick shallow zigzags for fourth waves coming up.
Which is normal for a commodity like Gold, and how the S&P looks like it tends to behave in a bear market.
This huge sideways move has tested our patience, and I notice the deep second wave corrections testing members patience and making a few question the overall expected direction. Every time.
I think once we get to the middle of the next wave down things should start to accelerate. But for now its slow. A slow start offers an opportunity for us to get positioned.
Always look on the bright side 🙂
and I was off on a tangent there watching Eric Idle…
back to work!
Lara, can you insert a preliminary chart showing how you labeled the expanded flat?
Where are you saying the expanded flat begins ?
See below… 3:41PM… I think that’s it.
Joseph, thanks so much. I had missed it in all the dialogue.
Volume Hugely LOWER Today in SPX :
553.338 Million Today
898.706 Million Yesterday
Considering the BULK of the decline was in pre-market and the whole move up was during regular trading hours 9:35AM+… Volume is REALLY Bearish!
That supports the wave count. A green candlestick, lighter volume. I’ll be expecting a red candlestick tomorrow.
This market is looking to take away every last $$$ from the un-expecting!
Sometimes you just gotta step away from the five minute chart and look at the bigger picture… 🙂
I have to say though, if we do not see a gap down open sometime soon I am going to get just a teeny bit worried…!
And I mean a gap down that does not get immediately filled an hour later!
That’s why this move down must start during normal trading hours. They are buying the premarket dips just as they did today from 9:35AM on. That’s an easy manipulation for them.
Open flat to down 50 in the DOW and then move big lower through out the day to close at or near the low… do this for 3 to 6 days… then follow that with a big GAP and go lower.
That’s the recipe to break below 1810 in a powerful way once & for all!
According to according to a new analysis by the Economic Innovation Group, “fewer new businesses were created in the last five years than any other period since at least 1980…”It’s hard to put into scale the collapse of new business formation. We have no precedent for that rapid and steep of a decline. It will have a ripple effect in the economy.”
That is only half the story. The more salient studies have been showing that more large and small businesses have CLOSED SHOP, in the last ten years than in the previous 50. Now that is an amazing statistic!
Yes it is… indeed!
Agree 110% but this market is not linked and dictated by fundamentals or economic reality. Hence, difficult to say it will behave as the TA predicts in near and short terms.
Good point Ris. Considering all that is going on in the economy both global and domestic, US markets trading at these levels is beyond insane, but nonetheless here we are. It is one of the reasons I think those calling for a low painful grind to the bottom are wrong. I think when this thing blows, it is going to really blow. The kind of wrangling we saw in the markets today can lead us to believe that the banksters have a prayer in you know where of perpetually keeping this thing afloat. I don’t think they can.
It is only a matter of time before they will have to pay the piper…every one does…!
I don’t see any technicals that aren’t working.
Volume looks normal for a bear market, and so far from the ATH each rally (apart from this latest one) has been more than fully retraced.
Breadth looks normal for a bear market. VIX (as an indicator of sentiment) looks normal.
By “normal” what I mean is bearish divergence. Which so far has been followed by price.
We have a series of lower lows and lower highs from the ATH. The 200 day moving average is flat and up to now has been declining…
I’m just not seeing the problem here.
At market highs, particularly a huge B wave of an expanded flat (I’m talking about the ATH as the end of super cycle wave (b) now) you’d expect to see exactly what we are seeing: rising price on declining volume, divergence with MACD, divergence with RSI, On Balance Volume breaking below trend lines…. which is exactly what we see.
I think the problem here is perception, and that’s because the rise to the ATH may have been a B wave. Of a huge expanded flat.
I’m going to go over the monthly chart today in the analysis, writing that up now.
I think more patience is needed for the start of this next wave down.
I will again ask members to go back and look at the historic example I’ve provided of a primary degree third wave. Look at the daily candlesticks there in the first weeks. Notice the many small green daily candlesticks and doji. Notice how ATR was flat to slightly rising for a long time early on.
That wave didn’t pick up steam until the middle.
Lara,
If you recall that is why I had asked for timing projections. Not doubting the TA but when do we know it is approaching or has approached the middle.
Thanks Lara, very helpful as always….. Keep in mind the stock market psychology, greed in the primary motivator and most want the markets to head up all the time, it’s not until fear becomes the dominate sediment that we can see the big red candles. Just another piece of the puzzle 🙂
Oh and I would call it another Hanging man candle today on the daily
Sure Ris, that’s why I’ve offered a guide to how long primary 3 may be expected to last.
Time projections are harder than price. When I do make an estimate for time it will have less accuracy than price.
Price is hard enough to get right!
We need to let this wave have time to unfold. It won’t move down in a straight line and it will take its time. 31 or 34 weeks in total possibly, and we’re only now in week 6.
I have been also struck by the persistent absence of any real fear in the market. Even if I were inclined to be bullish, which clearly I am not, that alone would give me pause. It is clear that the remarkable series of new 52 week lows in UVXY now have some absolutely convinced, in classic normalcy bias fashion, that what has been, always will be…
I went short futures here at SPX 2100
Dow hit the 61.8% retracement now.
Lara, could this possibly be a wave 5, and 4th wave was what we saw from yesterday’s highs to today’s lows??
Possibly. The S&P does tend to breach its channels then turn around and continue in the same trend.
I do see it as highly unlikely though, which is why I haven’t charted it. The breach of the channel is so big, resistance about 2,100 is so strong and resistance at the bear market trend line is so strong.
As always, thanks for clarifying Lara 🙂
Good morning every body. So far this looks like it may be an expanded flat, I’ll label it at subminuette degree. Invalidation point on the hourly chart remains where it is.
Everything about this move today continues to look corrective. What is peculiar is that it should continue this long ahead of a strong third wave decline. My mental stop remains SPX 2100 on close….
The bulls are in firm control 3rd wave or not – there needs to be some long red candles…
Not necessarily.
Take a look at the historic primary 3 in the analysis. Look at ATR and look at the candles in the first weeks of that wave.
They weren’t foot long red. ATR was pretty close then to where it is now, about 20.
I totally agree, however today I got stopped out 3 times fishing for that short. Death by pin pricks….
FWIW some technical folks are seeing ramp into the June end before this market drops …waiting to closing to seek likely direction. Markets are going to remain irrational longer than anyone of us can remain financially strong playing short. It will continue to tempt with drop here and there but too much free money out there for manipulation.
interesting to hear Ris, thanks for the 411. I will keep this in mind.
MaClellan is saying this based on the NASDAQ strength and we are seeing the same as NASDAQ is first to bounce despite earning outlook being weak.
I remain firmly ensconced, albeit a bi cautiously, in my short positions.The weight of evidence points to today’s move as being corrective, trying to short side traders as it has been. The bears’ defense of the 2100 pivot, the small VIX divergence, and the decline in volume on a green print in my view keeps the bearish count viable.
Yeah. Position traders have to have an iron gut to sit through these whipsaws.
I still want to see a decisive fall away from the round number before I am comfortable sitting on my positions and letting them ride…
IWM is the clearest indication that the bull market is alive and…. as “well” as this sick puppy gets…
Others to follow maybe?
There is still “technically” a pattern pointing lower in the indices, but price is not confirming that…
Wouldn’t consider shorting SPX again until:
1) We break support (at 2070 for me)
2) We get between 2110-2135 (major resistance)
Could be another possible expanded flat. With yesterday’s low the beginning of wA, then today’s open was the then end of wB and now we are in wC to complete minute w2? retracing almost 76% of minute wave 1 down? I could be off in terms of wave degrees….
Any idea Olga?
…possible.
I have it like this….
Yep! Another example of a sneaky B wave moving past the low of the last impulse to befuddle the unwary. Quite in keeping with the character of Mr Market. I fully expect the next impulse down to once again complete intra-day, keeping both bulls and bears off-balance and wreaking havoc in trading accounts of all but the nimble! 🙂
I am a bit surprised to see minuette one over so soon. I was expecting some major extensions in minor three down. I would also have expected another UVXY 52 week low for a minuette two second wave. Of course it could go higher tomorrow….
The degree of labelling there could certainly be moved down one.
It may be only subminuette waves i and ii of minuette (i) complete.
That is still open to interpretation.
Very nice ending diagonal. Should all be quickly retraced tomorrow! 🙂
Thanks Lara!
The slope against the down-trend looks good enough to be a double zig-zag for a second wave. If that’s is the case, it should be done.
Final kiss to underside of 2100…
It’s 2:33PM… just about the outer end of my post below.
3rd time a charm???
Mr. Market wanted an actual deep kiss of that sexy 2100.
You sly dog… a 2nd deep kiss!
SLAP… SLAP… SLAP… NO MORE!!!
For anyone interested, can be viewed on Netflix:
Requiem for the American Dream
Documentaries, 2015, 72 minutes
Social & Cultural Documentaries
Iconic intellectual Noam Chomsky states his case for how the bulk of America’s wealth and influence has been transferred to the hands of a few. Highly recommended.
Okay Bernie!
Watched it. Awesome!
Thanks for sharing John.
You fit a 72 min thing into a 20 min viewing? Watched in Fast Forward? Did it sound like Alvin & the Chip monks?
watched at reg speed, fell asleep so had to watch it again. Maybe if it did sound like Alvin & the chip monks, I would have stayed awake the first time.
Sorry Joseph, should have said I’ve watched it “already”.
Thanking John for sharing as i am a fan of (some of) Chomsky’s ideas.
But then again i am also a fan of Tucker Max, so my opinions are not to be trusted.
It’s all good, we are all entitled to our opinions 🙂
yeah, directly due to govt. laws and policies. Cheer for the Austrian School of Economics to be valued again and then you’d see real growth, real wealth for all
Hells Bells…. Is that new high for today?
SPX following IWM per chance? Looks strong…
The wrangling continues. An SPX close above 2100 is my mental stop to exit all short positions. As a second wave in a third wave down at multiple degrees this one is starting to get a bit long in the tooth mho….
Yeterday’s upper wick high was 2099.23
Today’s high tagged just a few cents off of yesterdays high…
O.K. It looks like the banksters are done shaking the trees. I am sure a lot of cubbies were rattled by this morning’s price action and that is exactly what it was designed to do. Reloading and adding to short positions.
FWIW, you never ever let UVXY short sellers rattle you on a move into the red ahead of a third wave down….EVER! You make ’em pay by lowering your cost basis, not bitiching about being temporarily under water when a new downtrend had clearly been established. ‘Nuff said. It is really not for most folks, it’s just that simple.
2098.30 held so should be down from here,
I’m getting sick and tired of waiting for a third wave. Again this does not look impulsive! I think the Banksters have re-written the EW code!
Maybe… just maybe…it ain’t gonna happen?
Any one care to count up the months this third wave in SPX has been in the proposed making but yet to no avail?
We have apparently also had price confirmation on FTSE that we now *should* be in a third down… doesn’t look like it, even with 2 down days…all this in the face of Brexit 🙂
The fact of the matter is Stuart, there is ALWAYS a numbers that tells us the wave count we are looking at is wrong. All we can do as traders is consider the available technical indicators we are following and trade what we see. Ultimately it really does not matter whether you are bullish or bearish, price action is always right! 🙂
Agree 100% Verne, trade what you see, not what you seek.
Right now i’m long because price is moving UP, if 2080, then 2070 breaks, i’ll flip heavy short looking for downside. But for now bullish bias
Amazingly after the great gap down open we are slightly positive for the day…
I hope we don’t have another EOD melt up, because overall price action has been bullish.
EOD melt up right on schedule…
it’s interesting to me that the top 3 financials in the S&P, Wells Fargo-JP Morgan & Bank of America all have been rallying up hard after gap down at the open.
anyone else think that was it for today? nibbling back into my short position now..
It’s taking my short profits too, but it looks like it’s just bouncing against the resistance of the bear market trendline.
if the line holds, we should get a significant breakdown this afternoon….
~ 1:30- 2:30ish it should start… if not then tomorrow is another day.
Either you have confidence in the wave count or you don’t. If you do have confidence in the wave count, you lower your cost basis when the market rallies up in a corrective wave as it is doing to today and you simply remain patient until the market proves you wrong based on your stop loss. If you don’t have confidence in the wave count, you take you losses and exit your positions, not bitch about any trades you made when you had confidence in the wave count.
and EW is only to gain over 50% probability really, as to why I am always looking for alternative wave counts, and of course confirmations.
I have been noticing a periodic data freeze for a couple of min. at a time the last couple of hours… Anyone else experiencing this?
This has never occurred before that I can remember.
I noticed that too, was wondering about that.. !!
just got stopped out…sheez
Yep. Banksters on the prowl so I am keeping an eye on ’em….I don’t like wrangling around the pivots. It is never a good sign for the bearish case if it goes on for long.
Also the top of this morning’s gap – third tag, and now it’s been punched through to the upside.
Dang it – not a good sign. Hate to see that nice gap completely recovered and back in uptrend. Hope to see some long red candles in breakdown mode.
Hear that sucking sound?
That is money that is being sucked into the market since 9:35AM this morning!
Money Blown???
Suckers!!!!!!
I feel like the sucker…UVXY perpetually red. Maybe I ought to do all of you a favor and short UVXY
Serious, shorting UVXY has to be the most sure fire trade going.
UVXY erodes as reliably as the sun comes up in the morning. An easy 10% a month, if not a lot more. On any kind of spike it would be a fast money maker but really, you couldn’t lose longer term regardless of when you go short – because this thing kills itself over time. Some brokerages (IB for example) restrict shorting UVXY – anyone have the info on this?
That’s why the Pros massively short every VIX based ETF’s and every 3 X’s Short ETF! They have been for years.
They will only permanently lose money on the P3 down of Lars’s Bear Count down to 1423 target!
UVXY is a very hard trade to be profitable on… you have to time it just right! Price erosion is much more than 3 X’s short ETF’s on a stock index.
It could be the gap down this morning was micro five of sub-min one, and now sub-min two up underway…
Does look like a 1,2 carried over from yesterday.
DO we get a 3 or another 1,2?
Looks like the gap was tagged and down from here…
Joesph – didn’t the daily 50ma crossover the weekly 200ma now with the price action last week and this week? Sure looks like it did.
typed weekly, meant daily….too much coffee.
More times than not those crosses fail and are meaningless… the 1st one last August had some meaning because it was after a multi-year uptrend. This one has zero meaning.
That is one of the tec. tools I fully understand and have been looking at/using since 1980.
The true MA’s as I have listed below used in conjunction with Lara’s Bear Count will be very powerful… Not going to try and convince you!
But we have an excellent opportunity to view the result’s this time in real time. So all will have to wait & see and analyze for yourselves.
To follow up on MA…. The SPX WK 50 will be crossing over with the SPX WK 200 for the 1st time since March 2011 and that in conjunction with Lara’s Bear Count will be extremely powerful.
Something else for all you to watch and analyze for yourselves. They are converging & will cross in the not two distant future.
Then the monthly cross over will confirm the Grand Supercycle Bear Count.
Daily Dow Jones. It feels like I’m beating a deadhorse….but H&S pattern is still in play. Would like to see it break that neckline to the downside. Just bounced off the line too.
Fully Short with some stops and willing to take a bit of pain
Would just love a bit more momentum to create a buffer but there is a great oppurtunity and time to add to this I suppose. Would be great to walk away and come back in a couple of months!!
Update to Key SPX Simple Moving Averages as of today for what we are waiting for:
2067.82 50 Day MA
2001.14 100 Day MA
2010.98 200 Day MA
==================
2024.13 50 WK MA
2031.80 100 WK MA
1845.50 200 WK MA
1810.10…. well you all know what this is. Break this now, this time… and its down to
the 200 Month MA.
1822.44 50 Mo MA
1487.99 100 Mo MA
1353.84 200 Mo MA… By the time we get down here this may be at or near the
Bear Count Target of 1423 ….. See, it all fits the big picture….
THIS TIME!
If you notice… a break of the SPX 2000 round number now breaks all the Daily and two of the Weekly Simple Moving Averages with the 1845.50 200 WK MA within striking distance!
could be in a wave 4 here
Probably sub-min three down underway with gap down micro one, and now two up…
that’s what I have also, just not sure is sub-min 2 is complete yet
In that case the gap down this morning would probably have to be an X wave of a double combination of some sort. The gap down was fairly deep…
Now the lowest prices in 5 days except for the 1st 10 min 5 days ago. That includes today in the 5.
C’mon bears, get those claws out!
I know we have a veritable plethora of bearish signals but I am keeping in mind SPX’s tendency to fall out of its bull channels only to clamber back in and continue its upward march for a day or two longer. I took some short term profits at the low yesterday and will be once again looking for possible volatility divergence with any higher price movement. Futures hinting the upward correction may not be quite done and I suspect it could subminuette two. I am expecting that a third wave down at multiple degrees should have a strong signal by way of overnight futures so I am keeping short term powder dry until either momentum or price indicates yesterday’s lows will be taken out. Those banksters are very sneaky fellows.
The banks continue to jettison IB staff with GS announcing another round of layoffs of senior employees…we are in a stealth recession I believe.
Edit: Futures just took a dive lower so maybe I spoke too soon!
Several big upward price spikes in SPY premarket, so I wouldn’t be surprised to see some upward attempt at a claw back. Maybe more chop before the drop. Healthy drop at the open…
Attempt to rally will fail… Time for market to show it’s hand!!!!
During regular trading today… I expect a Niagara type move.
To what degree that remains to be seen.
They will try to fill the opening gap from this morning….
Expanded flat unfolding for minuette 2?
Not the kind of gap that needs to be filled as the open overlaps with yesterdays trading range.
Achieved price spike target 209.84 SPY -buying some puts here.
any idea on how long it would take to get to 1916 for wave 3 down on Spx?
My initial guess would be possibly a Fibonacci 21 or 34 days.
That’s a rough idea only though. Minor 1 lasted 12 days (no Fibonacci number) and minor 2 lasted 16 days (no Fibonacci number and no Fibonacci ratio to 12). So minor 3 may not exhibit a Fibonacci number in duration.
I would expect it to be longer in duration than minor 1 though, by quite a lot. Third waves usually show their subdivisions and are extended in price, which means they extend in time too.
Thanks Lara.
FWIW, RUT beat its april high today
so that takes the 1-2 setup off for the RUT
I believe RUT is in a different EW count than S&P….Perhaps Lara could do a RUT update, hint, hint 🙂
RUT did not close above that last April 27th high though; daily candle pattern is very bearish too.
FWIW i view Russell as the clearest indication that the bull market is alive and “well”, (and ergo this current phase in the market is just a temporary correction we are enduring before higher highs across the board…)
IWM made a new high over the April top today… SPX yet to do so, but I won’t be in the least surprised to see this soon… I WAS surprised by the recent strength in the SPX index however, as i originally expected it to temporarily top in the 80’s before a pullback.. guess i was wrong….
But, not as wrong as i was that time i shorted the SPX at the end of February expecting it to honor my chosen analysis and trade plan.
Re: SPX futures, and those daily candles, yesterday (and so far today) to me say, “upside is a coming boys…we understand y’all need to be completing a fifth before yer wave two pullback, and heck, dem bears can’t even break and hold the first level of minor support…LOL!”
Not sure why that sentence had a Southern accent… maybe it’s because i just watched City Slickers again? Any hoo…
Now that IWM is proving itself as the top stud of the US indices, I’m looking for others to follow, meaning SPX 2110-2135 before any sort of meaningful pullback… And as per original post, not below 1950 (convincingly and/or for any length of time) when it does eventually pull back in a meaningful way.
And yes i know there is still “technically” a pattern pointing lower, but price is not confirming that to these eyes…
Very early analysis tonight. Thanks
Thank you for the analysis early enough US east coast time to read it tonight.
First! 🙂
Woo Hoo!
nice Verne,, you win the footlong today,, courtesy of Lara.