More downwards movement was expected for Thursday’s session, which is what happened.
Summary: The main wave count expects to see downwards movement accelerate in the next week or so as a third wave unfolds. The first short term target is at 1,988. The long term target remains at 1,423. Risk to short positions is now at 2,071.88. The alternate hourly wave count today has a reasonable probability with some support from classic technical analysis. Be warned: tomorrow may print a green candlestick. If that happens, it presents an opportunity to add to short positions.
To see last published monthly charts click here.
To see how each of the bull and bear wave counts fit within a larger time frame see the Grand Supercycle Analysis.
To see detail of the bull market from 2009 to the all time high on weekly charts, click here.
New updates to this analysis are in bold.
BEAR ELLIOTT WAVE COUNT
WEEKLY CHART
This bear wave count fits better than the bull with the even larger picture, super cycle analysis found here. It is also well supported by regular technical analysis at the monthly chart level.
Importantly, there is no lower invalidation point for this wave count. That means there is no lower limit to this bear market.
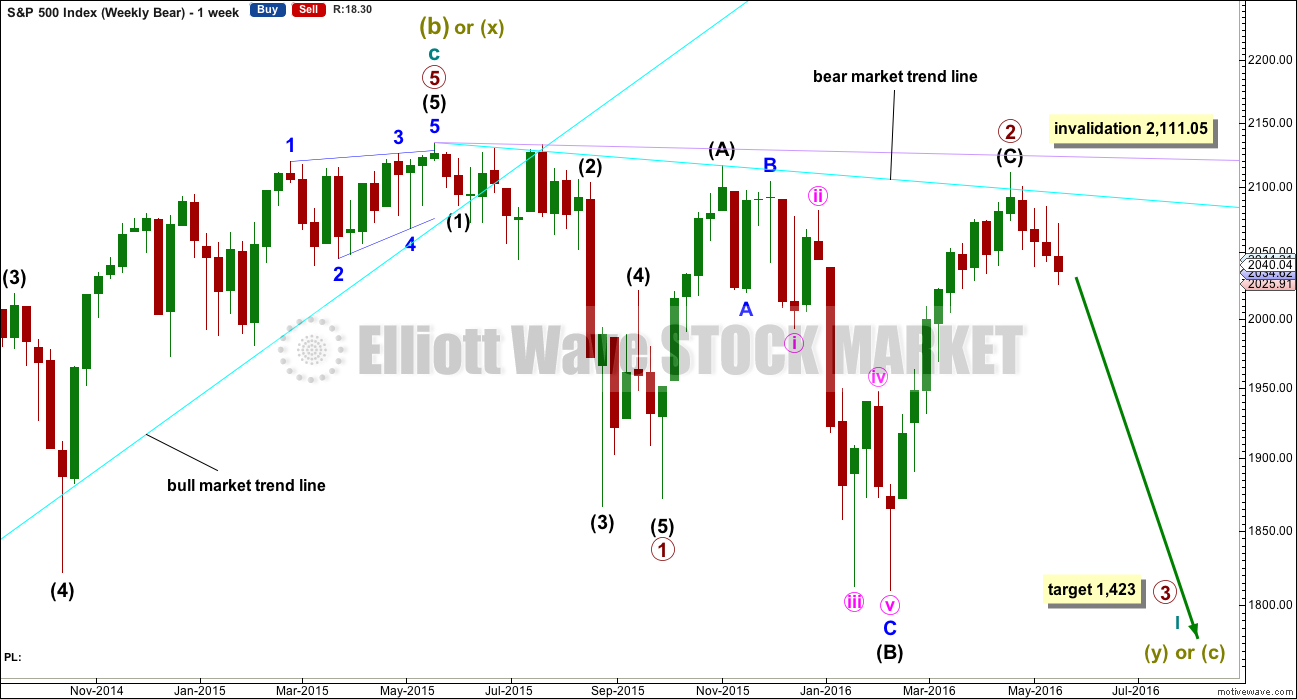
Primary wave 1 is complete and lasted 19 weeks. Primary wave 2 is over lasting 28 weeks.
An expectation for duration of primary wave 3 would be for it to be longer in duration than primary wave 1. If it lasts about 31 weeks, it would be 1.618 the duration of primary wave 1. It may last about a Fibonacci 34 weeks in total, depending on how time consuming the corrections within it are.
Primary wave 2 may be a rare running flat. Just prior to a strong primary degree third wave is the kind of situation in which a running flat may appear. Intermediate wave (B) fits perfectly as a zigzag and is a 1.21 length of intermediate wave (A). This is within the normal range for a B wave of a flat of 1 to 1.38.
Within primary wave 3, no second wave correction may move beyond its start above 2,111.05.
DAILY CHART
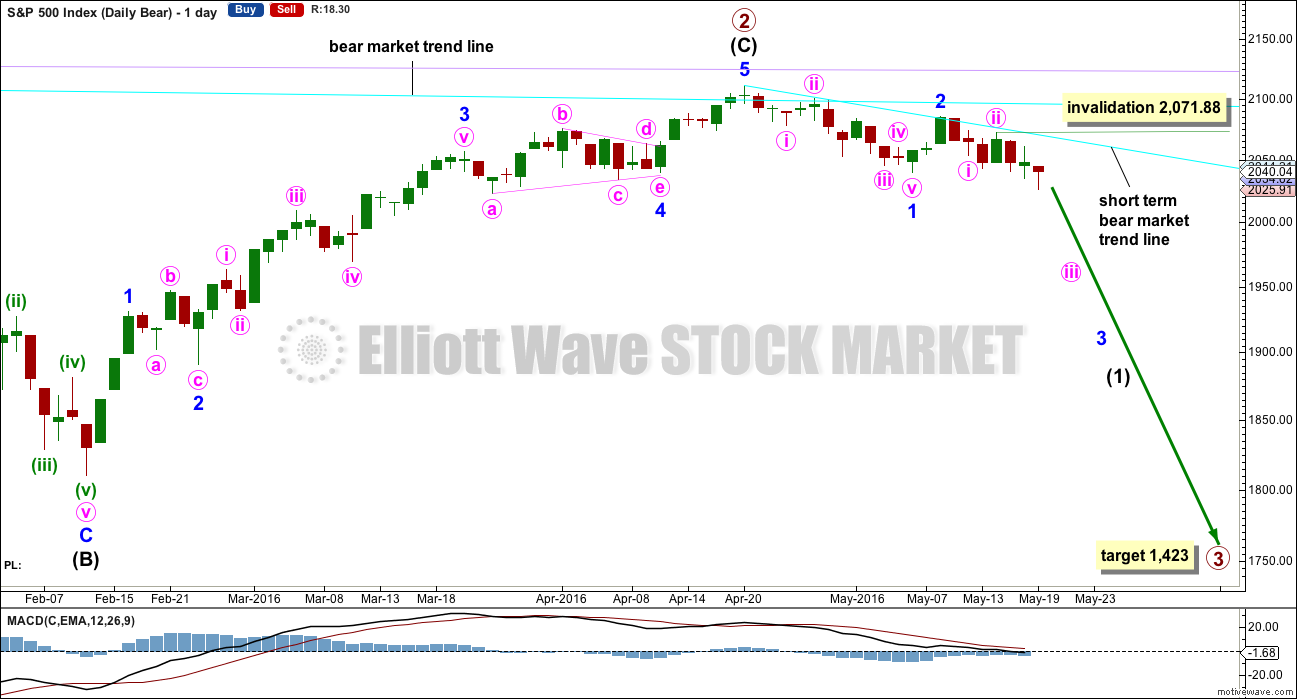
If intermediate wave (C) is over, then the truncation is small at only 5.43 points. This may occur right before a very strong third wave pulls the end of intermediate wave (C) downwards.
The next wave down for this wave count would be a strong third wave at primary wave degree. At 1,423 primary wave 3 would reach 2.618 the length of primary wave 1. This is the appropriate ratio for this target because primary wave 2 is very deep at 0.91 of primary wave 1. If this target is wrong, it may be too high. The next Fibonacci ratio in the sequence would be 4.236 which calculates to a target at 998. That looks too low, unless the degree of labelling is moved up one and this may be a third wave down at cycle degree just beginning. I know that possibility right now may seem absurd, but it is possible.
Alternatively, primary wave 3 may not exhibit a Fibonacci ratio to primary wave 1. When intermediate waves (1) through to (4) within the impulse of primary wave 3 are complete, then the target may be calculated at a second wave degree. At that stage, it may change or widen to a small zone.
At this stage, it looks slightly more likely that minor wave 3 is underway considering On Balance Volume at the weekly chart level, resistance at the short term cyan trend line, and structure at the hourly chart level.
At this stage, it looks extremely likely that minor wave 2 was over on 10th of May, lasting just two days and 0.63 the length of minor wave 1.
A short term bear market trend line is added from the high of primary wave 2 to the first small swing high of minute wave ii in cyan. This trend line is about where price is finding resistance. It is copied over to the hourly chart and the daily technical analysis chart.
The invalidation point is moved lower today. With the short term bear market trend line holding and two days in a row which managed to make new lows below the end of minor wave 1, it looks like minute waves i and ii are also complete. Within minute wave iii, no second wave correction may move beyond the start of its first wave above 2,071.88.
MAIN HOURLY CHART
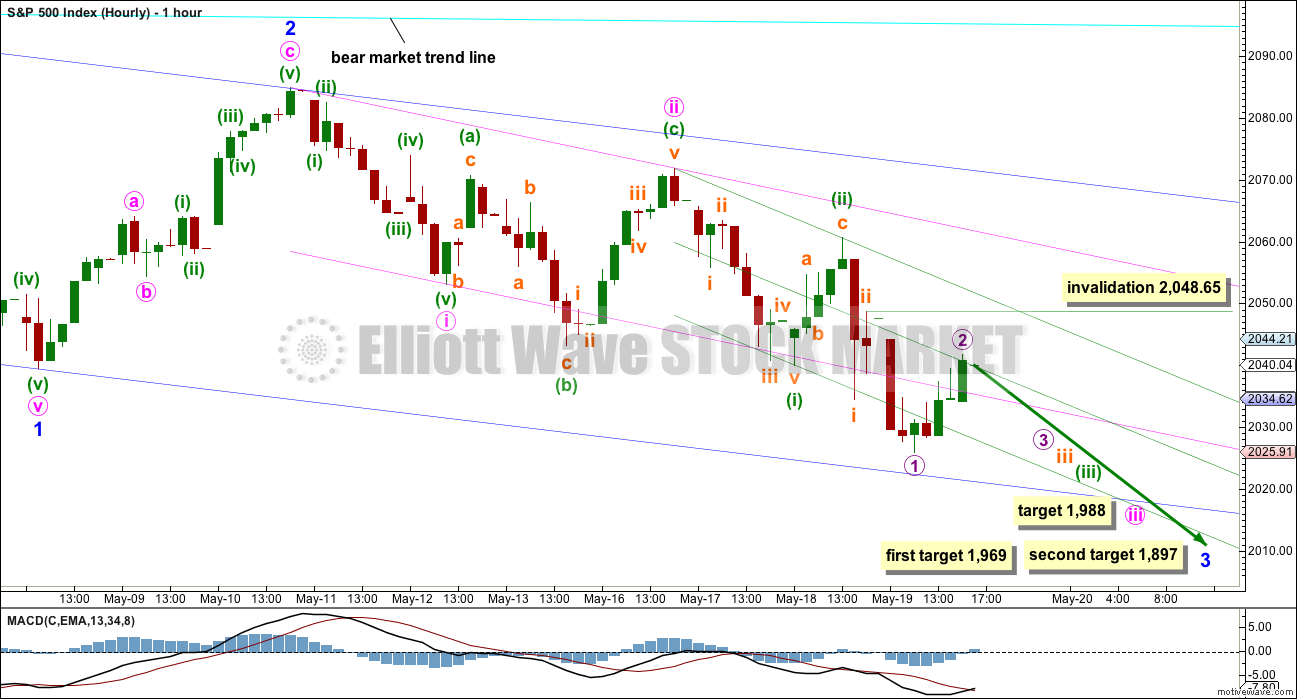
It is my judgement today that this main hourly wave count has about a 65% probability, with the alternate hourly wave count the remaining 35% probability.
Within minor wave 3 downwards, there are now five overlapping first and second waves. This indicates a winding up of potential energy, which may be released in explosive downwards movement as the middle of the third wave down unfolds. This may now happen very soon, either tomorrow or early next week.
This whole structure is still within intermediate wave (1) of primary wave 3 downwards.
So far within minor wave 3 price has not managed to break below and stay below support of any of the three base channels drawn here.
Draw a base channel about each first and second wave at minor, minute and minuette wave degrees. Draw the first trend line of a base channel from the start of the first wave to the end of the second wave, then place a parallel copy on the end of the first wave. The following third wave should have the power to break below support of these base channels. Along the way down, upwards corrections should find resistance at the upper edge of each base channel.
Minuette wave (ii) is very likely complete as a deep 0.64 zigzag. Now that minuette wave (ii) is complete any further corrections should find resistance at the upper edge of the green base channel drawn about minuette waves (i) and (ii).
As the lower edge of each base channel is breached, then it should provide resistance for any throwbacks.
Along the way down, corrections present an opportunity to join the trend at a good price. Price today could not reach up to touch the upper edge of the green base channel. It could only get halfway (a midline is added). This may now be where upwards corrections at this stage find resistance. If price breaks below the lower pink line tomorrow, then look for that line to provide resistance to a small upwards correction. That may offer another good entry point to add to short positions.
At 1,988 minute wave iii would reach 2.618 the length of minute wave i.
The targets for minor wave 3 remain the same. At 1,969 minor wave 3 would reach 1.618 the length of minor wave 1. If price gets to this first target and the structure is incomplete, or if price keeps falling through this first target, then the second target will be used. At 1,897 minor wave 3 would reach 2.618 the length of minor wave 1.
The small correction of micro wave 2 may move higher tomorrow. Although, if it does, then it will be more disproportionate to subminuette wave ii one degree higher, so it is most likely to be over at today’s high. If it does continue, then it may not move beyond the start of micro wave 1 above 2,048.65.
If price breaks above 2,048.65, then use the alternate hourly wave count below.
ALTERNATE HOURLY CHART
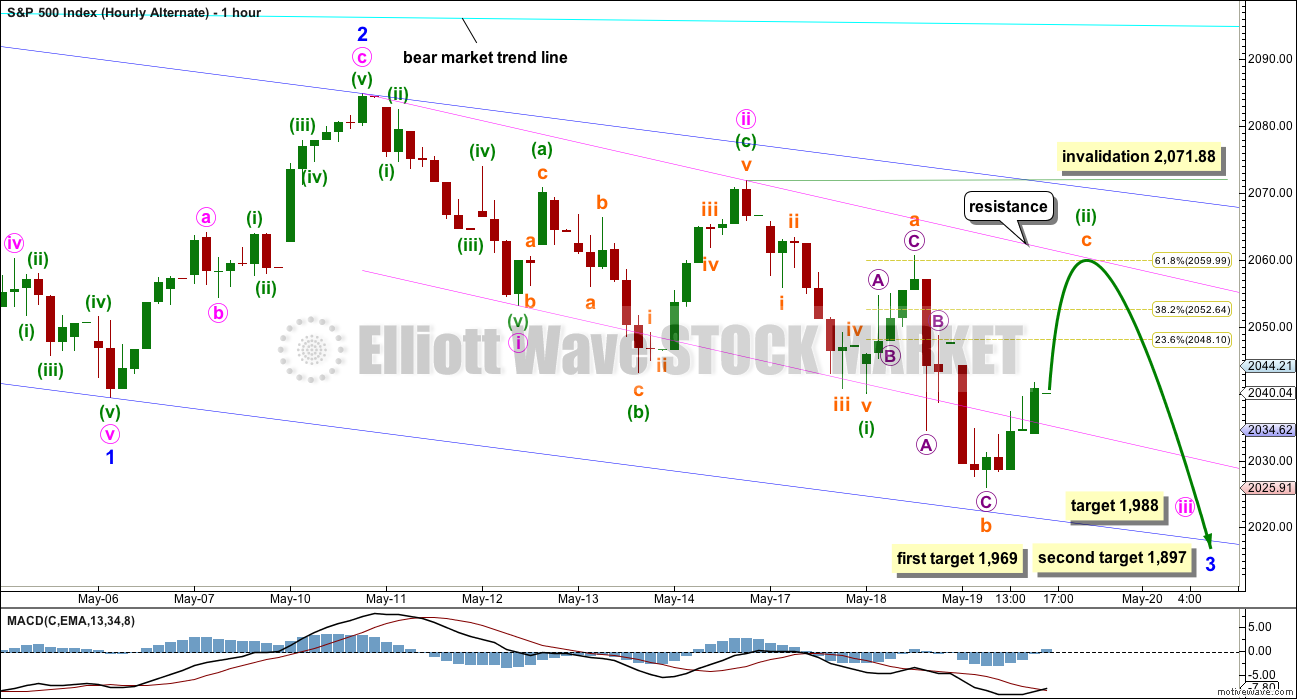
What if minuette wave (ii) is not over? Downwards movement labelled subminuette wave b now fits as a zigzag, and it would be a 1.75 length of subminuette wave a. This is longer than the common range of 1 to 1.38 but within the allowable conventional maximum of 2.
If minuette wave (ii) is incomplete, it may be an expanded flat, repeating the structure of minute wave ii one degree higher.
The target is removed. For this alternate, tomorrow, the upper pink trend line should be used. It would be most likely that subminuette wave c would move at least slightly above the end of subminuette wave a at 2,060.61 to avoid a truncation. It may just be able to do this and remain within the pink channel.
The short and mid term targets are exactly the same for this alternate.
Minuette wave (ii) may not move beyond the start of minuette wave (i) above 2,071.88.
BULL ELLIOTT WAVE COUNT
WEEKLY CHART
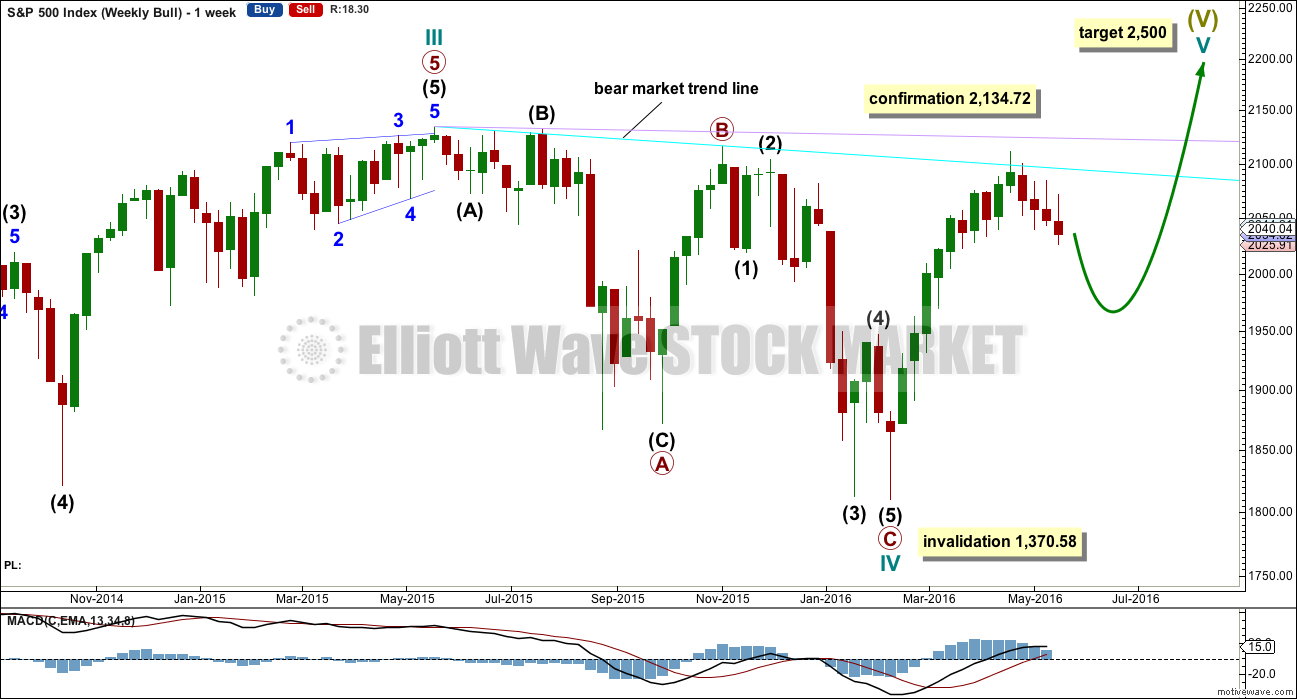
Cycle wave IV is seen as a complete flat correction. Within cycle wave IV, primary wave C is still seen as a five wave impulse.
Intermediate wave (3) has a strong three wave look to it on the weekly and daily charts. For the S&P, a large wave like this one at intermediate degree should look like an impulse at higher time frames. The three wave look substantially reduces the probability of this wave count. Subdivisions have been checked on the hourly chart, which will fit.
Cycle wave II was a shallow 0.41 zigzag lasting three months. Cycle wave IV may be a complete shallow 0.19 regular flat correction, exhibiting some alternation with cycle wave II.
At 2,500 cycle wave V would reach equality in length with cycle wave I.
Price remains below the final bear market trend line. This line is drawn from the all time high at 2,134.72 to the swing high labelled primary wave B at 2,116.48 on November 2015. This line is drawn using the approach outlined by Magee in the classic “Technical Analysis of Stock Trends”. To use it correctly we should assume that a bear market remains intact until this line is breached by a close of 3% or more of market value. In practice, that price point would be a new all time high which would invalidate any bear wave count.
This wave count requires price confirmation with a new all time high above 2,134.72.
While price has not made a new high, while it remains below the final bear market trend line and while technical indicators point to weakness in upwards movement, this very bullish wave count comes with a strong caveat. I still do not have confidence in it.
The invalidation point will remain on the weekly chart at 1,370.58. Cycle wave IV may not move into cycle wave I price territory.
This invalidation point allows for the possibility that cycle wave IV may not be complete and may continue sideways for another one to two years as a double flat or double combination. Because both double flats and double combinations are both sideways movements, a new low substantially below the end of primary wave C at 1,810.10 should see this wave count discarded on the basis of a very low probability long before price makes a new low below 1,370.58.
DAILY CHART
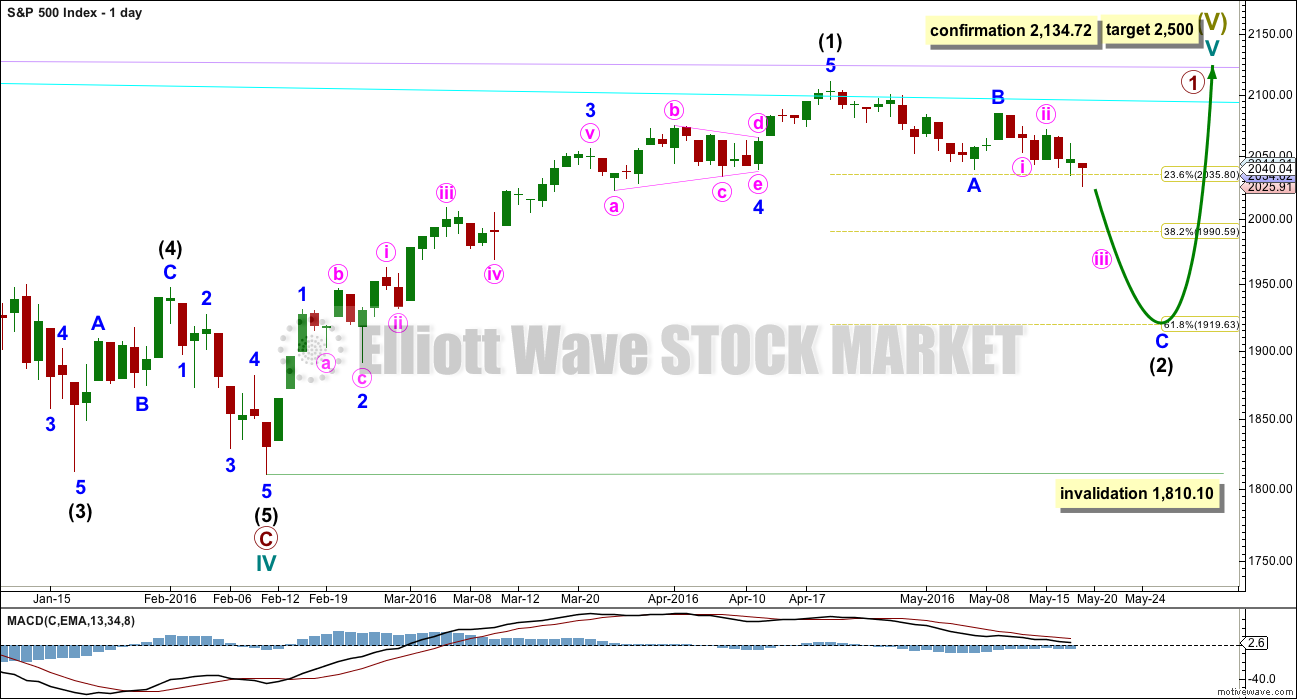
If the bull market has resumed, it must begin with a five wave structure upwards at the daily and weekly chart level. That may today be complete. The possible trend change at intermediate degree still requires confirmation in the same way as the alternate hourly bear wave count outlines before any confidence may be had in it.
If intermediate wave (2) begins here, then a reasonable target for it to end would be the 0.618 Fibonacci ratio of intermediate wave (1) about 1,920. Intermediate wave (2) must subdivide as a corrective structure. It may not move beyond the start of intermediate wave (1) below 1,810.10.
In the long term, this wave count absolutely requires a new high above 2,134.72 for confirmation. This would be the only wave count in the unlikely event of a new all time high. All bear wave counts would be fully and finally invalidated.
TECHNICAL ANALYSIS
WEEKLY CHART
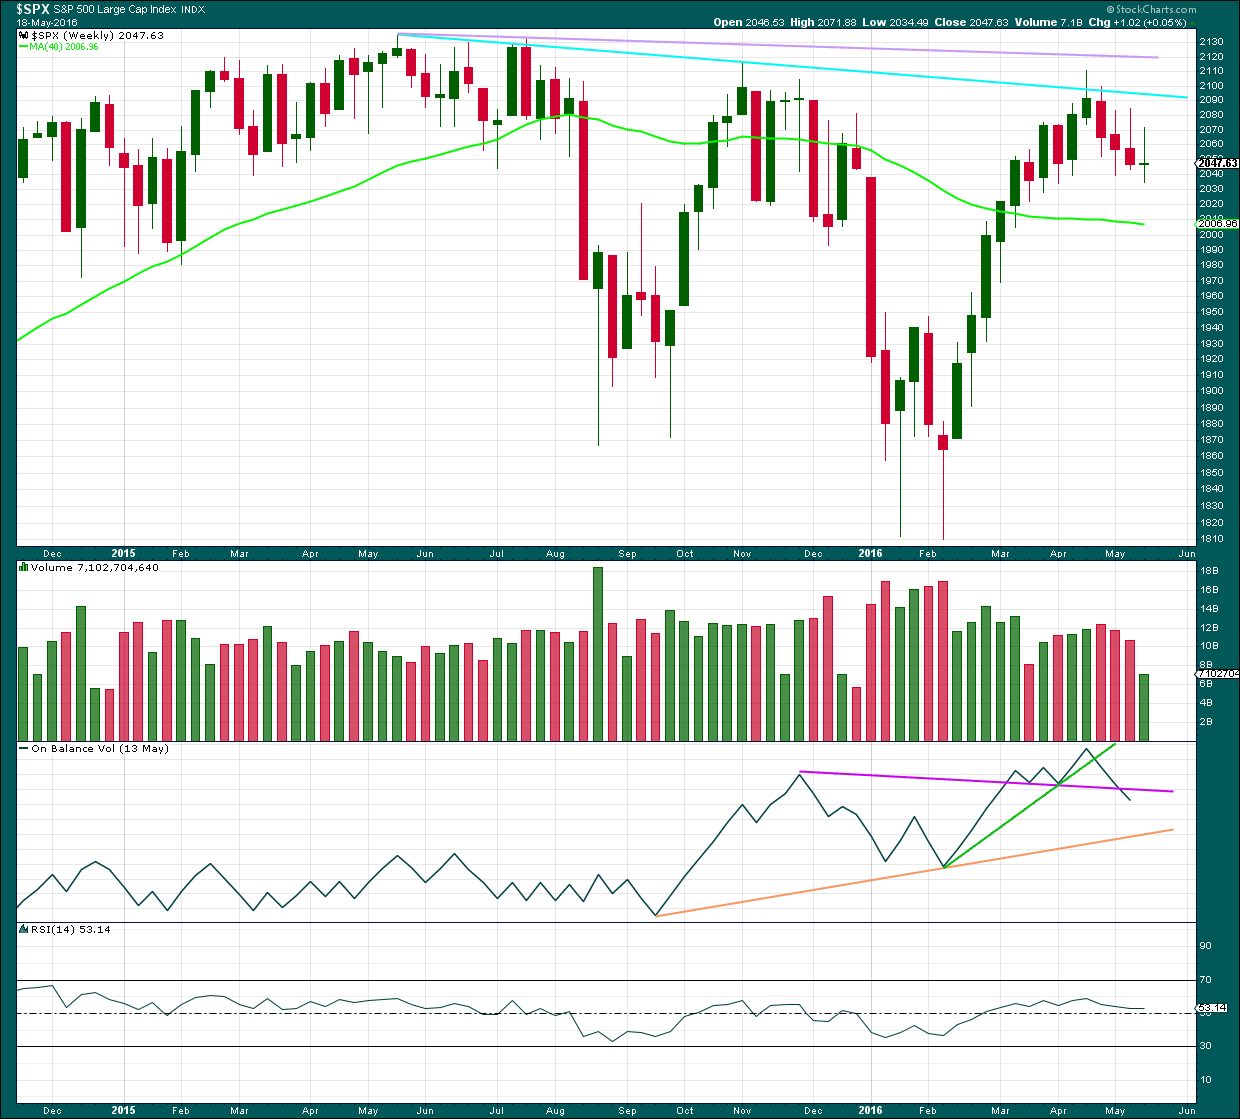
Click chart to enlarge. Chart courtesy of StockCharts.com.
There is a bearish engulfing candlestick pattern at the last high. This has occurred at the round number of 2,100 which increases the significance. Volume on the second candlestick is higher than volume on the first candlestick, which further increases the significance. That it is at the weekly chart level is further significance.
Engulfing patterns are the strongest reversal patterns.
Now this pattern is followed by another red weekly candlestick. The reversal implications of the pattern are confirmed.
This is a very strong bearish signal. It adds significant weight to the expectation of a trend change. It does not tell us how low the following movement must go, only that it is likely to be at least of a few weeks duration.
Last week’s candlestick has a long upper shadow and is again red which is bearish.
Thank you to our member John for pointing out there is also a Three Black Crows pattern here on the weekly chart. The first three red weekly candlestick patterns are all downwards weeks. The pattern is not supported by increasing volume and only the third candlestick closes at or near its lows; these two points decrease the strength of this pattern in this instance. That the pattern occurs at the weekly chart level increases its strength.
There is another bearish signal from On Balance Volume this week with a break below the purple line. This does not indicate which hourly wave count is correct, but it does add weight to a downwards trend.
DAILY CHART
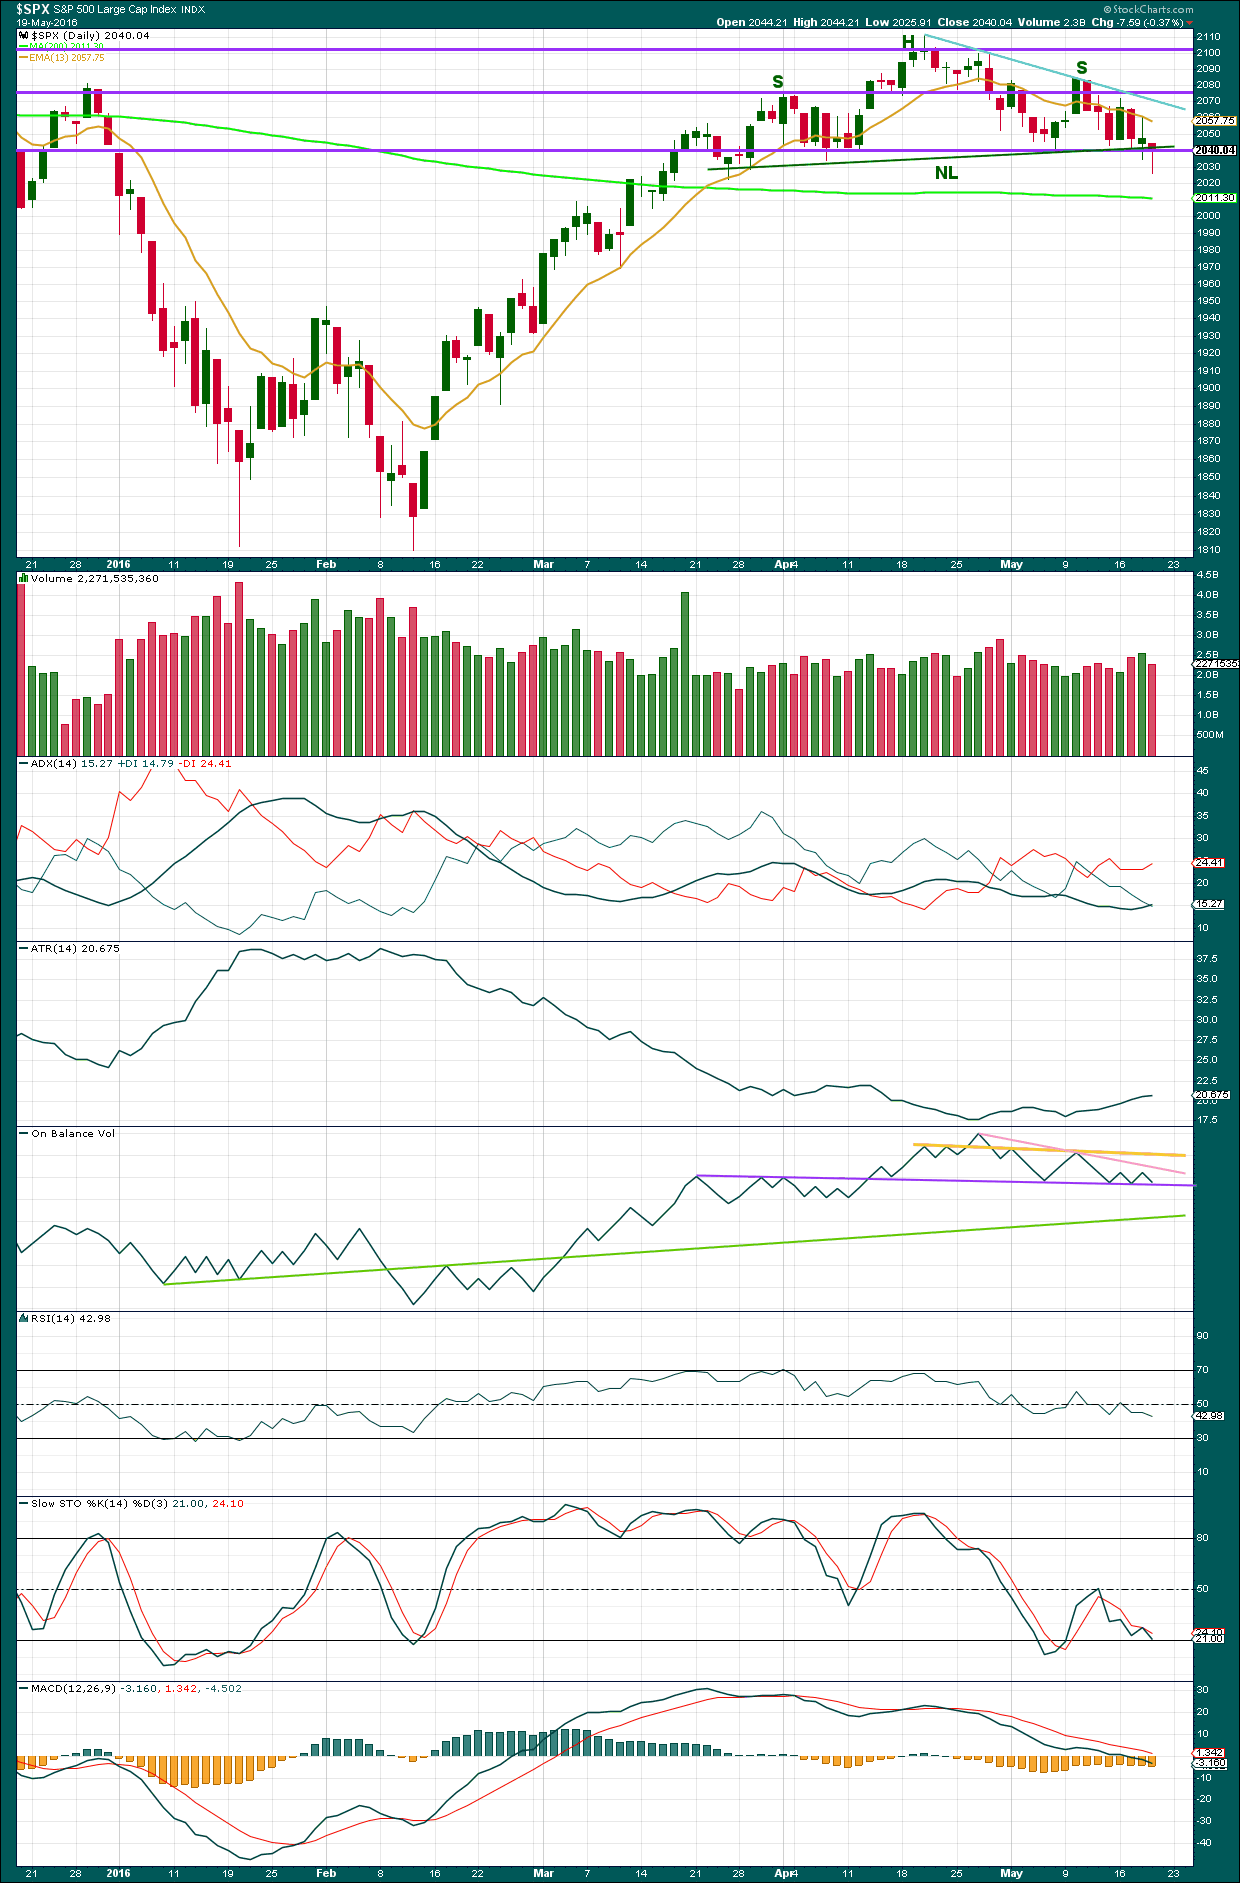
Click chart to enlarge. Chart courtesy of StockCharts.com.
Volume data on StockCharts is different to that given from NYSE, the home of this index. Comments on volume will be based on NYSE volume data when it differs from StockCharts.
Today’s candlestick completes a hammer pattern. This comes after some decline and warns that the trend may reverse. A trend reversal does not mean from down to up but may also mean only from down to sideways.
Hammer candlestick patterns in downwards trends often work to show a low, but not always. Recent examples of hammers not working can be found for 24th September, 2015, 28th April, 2015, and 9th December, 2014. Members would be able to find more going back further. The point is they often work, but often is not the same as always. It is a warning. It is not definitive.
Today’s session also comes with lighter volume. The fall in price was not supported by volume today giving some cause for concern.
For these two reasons the alternate hourly Elliott wave count must be understood to be entirely possible. Risk to long positions is calculated today at 2,071.88. There is a very real risk that tomorrow may see a green daily candlestick as price moves higher to end the week.
Price is testing support at the neck line of the head and shoulders pattern, but is unable to stay below this point. That two new lows in a row have been made below the neckline indicates that support will give way soon. Price may bounce up a little first though before coming back and breaching support.
If price bounces up, then expect very strong resistance at the short term bear market trend line drawn here in blue.
ADX is increasing today indicating the market is trending. The trend is down. ATR agrees as it too is trending. There is little doubt about the downwards trend, so analysis is currently focussed on identifying small bounces along the way: when may they turn up and how high they may go.
On Balance Volume is finding support again at the purple trend line. This line has been tested several times. This may provide support again today for another bounce up tomorrow. The lower pink line is removed. A new pink line is drawn across the last highs on OBV. If OBV turns up tomorrow, it may find resistance initially at the pink line. If that is breached, then it should find final resistance at the yellow line.
There is almost but not quite divergence between price and RSI today: price made a lower low below the low of 13th May and RSI has also made a lower low but just barely. RSI is still close to neutral. There is still plenty of room for price to fall.
Stochastics today exhibits divergence with price: price today made a new low below the prior low of 6th May while Stochastics made a higher low. This is regular bullish divergence and indicates underlying strength. This divergence supports the alternate hourly wave count over the main hourly wave count.
VOLATILITY – INVERTED VIX DAILY CHART
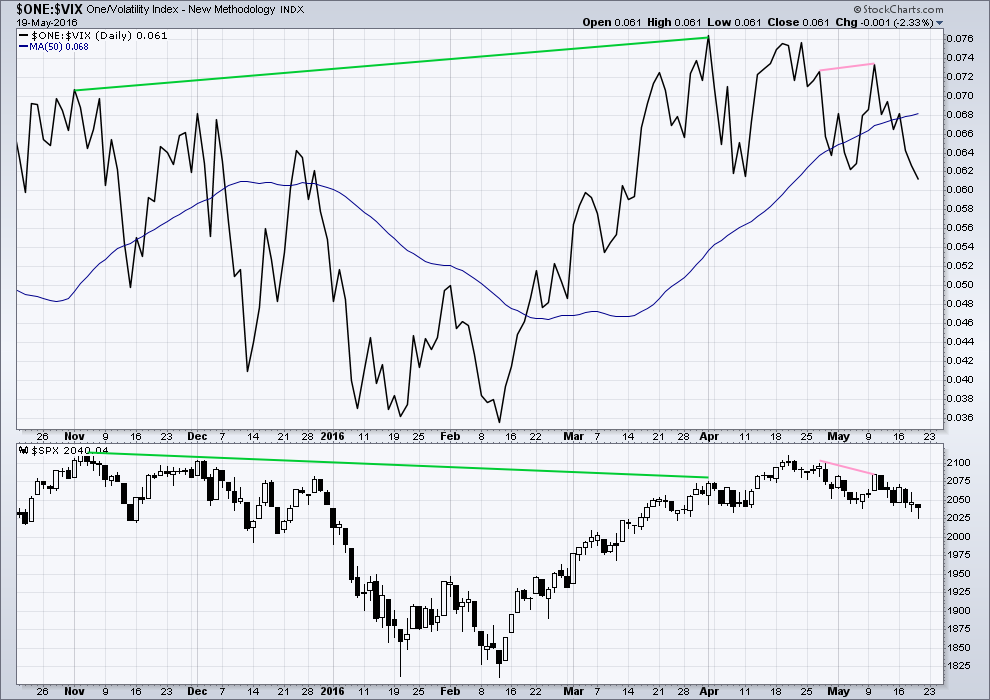
Click chart to enlarge. Chart courtesy of StockCharts.com.
Volatility declines as inverted VIX climbs. This is normal for an upwards trend.
What is not normal here is the divergence over a reasonable time period between price and inverted VIX (green lines). The decline in volatility did not translate to a corresponding increase in price. Price is weak. This divergence is bearish.
The slight bullish divergence noted yesterday between inverted VIX and price has disappeared and did not lead to an upwards day for Thursday’s session. This is an illustration of why divergence should be noted as a warning, but it is not definitive. It must be weighed up with all other pieces of information.
BREADTH – ADVANCE DECLINE LINE
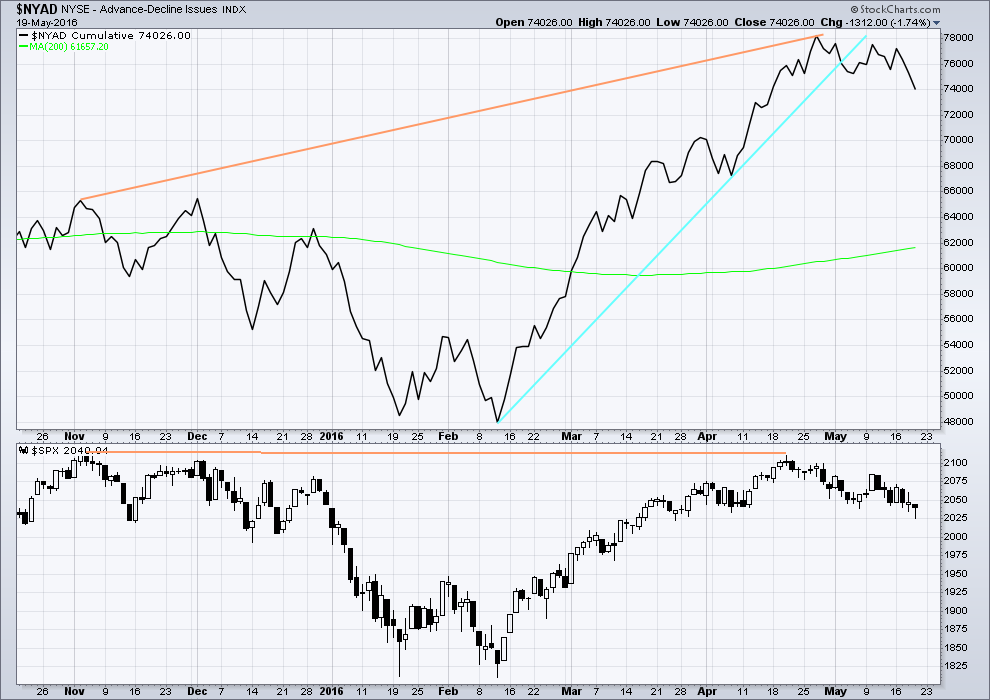
Click chart to enlarge. Chart courtesy of StockCharts.com.
With the AD line increasing, this indicates the number of advancing stocks exceeds the number of declining stocks. This indicates that there is breadth to prior upwards movement.
From November 2015 to 20th April, the AD line made new highs while price far failed to make a corresponding new high. This indicates weakness in price; the increase in market breadth is unable to be translated to increase in price (orange lines).
The 200 day moving average for the AD line is now increasing. This alone is not enough to indicate a new bull market. During November 2015 the 200 day MA for the AD line turned upwards and yet price still made subsequent new lows.
The AD line is now declining and has breached a support line (cyan). There is breadth to downwards movement; more stocks are declining than advancing which supports the fall in price.
The bullish divergence noted yesterday disappeared also for the AD line and did not yield a green daily candlestick for Thursday’s session. Again, this is an illustration of why divergence should be noted as one piece of evidence; on its own, it is not definitive.
ANALYSIS OF LAST MAJOR BEAR MARKET OCTOBER 2007 – MARCH 2009
In looking back to see how a primary degree third wave should behave in a bear market, the last example may be useful.
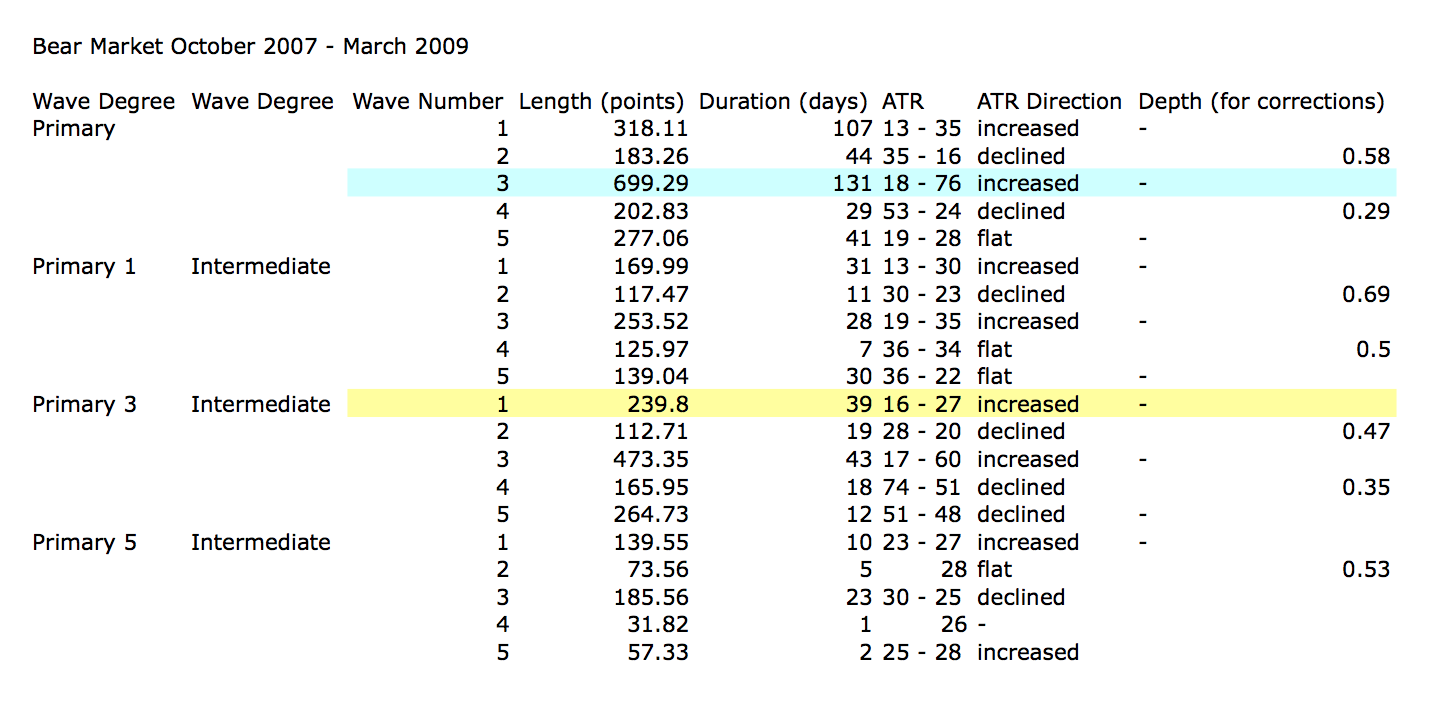
Currently, the start of primary wave 3 now may be underway for this current bear market. Currently, ATR sits about 19. With the last primary degree third wave (blue highlighted) having an ATR range of about 18 to 76, so far this one looks about right.
The current wave count sees price in an intermediate degree first wave within a primary degree third wave. The equivalent in the last bear market (yellow highlighted) lasted 39 days and had a range of ATR from 16 – 27.
This chart is shown on an arithmetic scale, so that the differences in daily range travelled from the start of primary wave 3 to the end of primary wave 3 is clear.
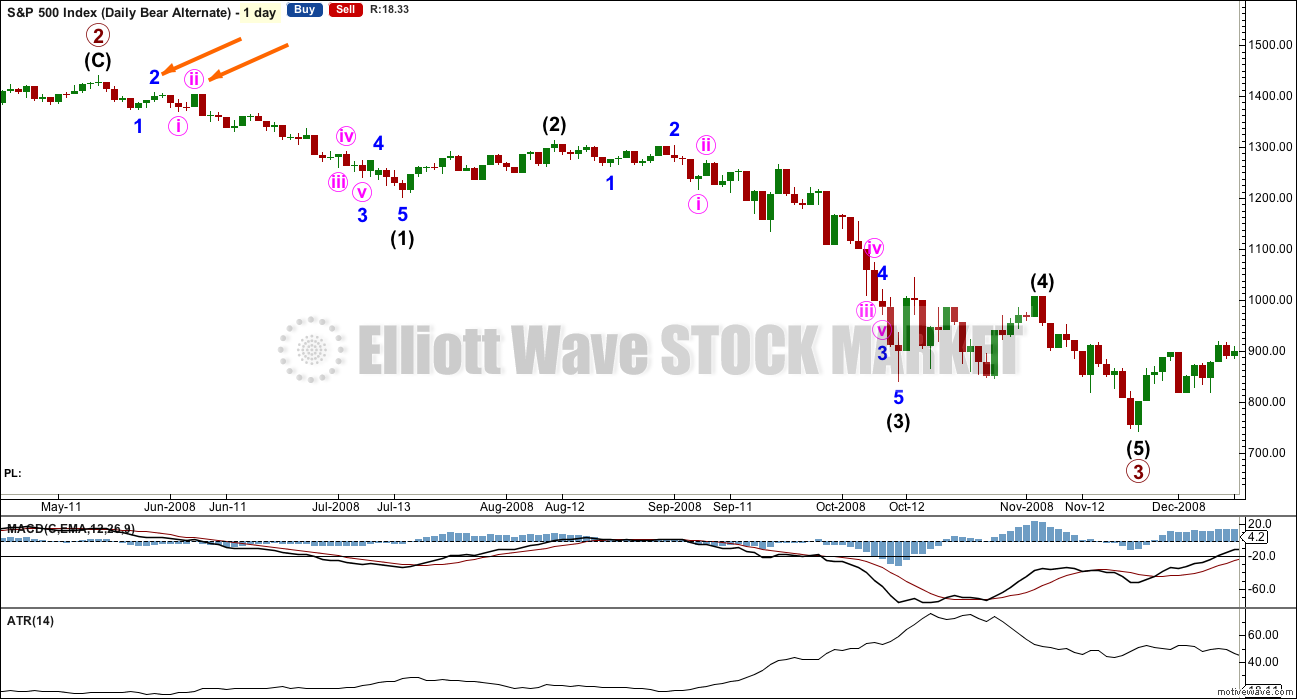
Primary wave 3 within the last bear market from October 2007 to March 2009 is shown here. It started out somewhat slowly with relatively small range days. I am confident of the labelling at primary degree, reasonably confident of labelling at intermediate degree, and uncertain of labelling at minor degree. It is the larger degrees with which we are concerned at this stage.
During intermediate wave (1), there were a fair few small daily doji and ATR only increased slowly. The strongest movements within primary wave 3 came at its end.
It appears that the S&P behaves somewhat like a commodity during its bear markets. That tendency should be considered again here.
Looking more closely at early corrections within primary wave 3 to see where we are, please note the two identified with orange arrows. Minor wave 1 lasted a Fibonacci 5 days and minor wave 2 was quick at only 2 days and shallow at only 0.495 the depth of minor wave 1.
Minute wave ii, the next second wave correction, was deeper. Minute wave i lasted 3 days and minute wave ii was quick at 2 days but deep at 0.94 the depth of minute wave i.
What this illustrates clearly is there is no certainty about second wave corrections. They do not have to be brief and shallow at this early stage; they can be deep.
This chart will be republished daily for reference. The current primary degree third wave which this analysis expects does not have to unfold in the same way, but it is likely that there may be similarities.
DOW THEORY
I am choosing to use the S&P500, Dow Industrials, Dow Transportation, Nasdaq and the Russell 2000 index. Major swing lows are noted below. So far the Industrials, Transportation and Russell 2000 have made new major swing lows. None of these indices have made new highs.
I am aware that this approach is extremely conservative. Original Dow Theory has already confirmed a major trend change as both the industrials and transportation indexes have made new major lows.
At this stage, if the S&P500 and Nasdaq also make new major swing lows, then my modified Dow Theory would confirm a major new bear market. At that stage, my only wave count would be the bear wave count.
The lows below are from October 2014. These lows were the last secondary correction within the primary trend which was the bull market from 2009.
These lows must be breached by a daily close below each point.
S&P500: 1,821.61
Nasdaq: 4,117.84
DJIA: 15,855.12 – close below on 25th August 2015.
DJT: 7,700.49 – close below on 24th August 2015.
Russell 2000: 1,343.51 – close below on 25th August 2015.
To the upside, DJIA has made a new major swing high above its prior major high of 3rd November, 2015, at 17,977.85. But DJT has so far failed to confirm because it has not yet made a new major swing high above its prior swing high of 20th November, 2015, at 8,358.20. Dow Theory has therefore not yet confirmed a new bull market. Neither the S&P500, Russell 2000 nor Nasdaq have made new major swing highs.
This analysis is published @ 10:36 p.m. EST.

I am guessing the Options Expiration day yesterday had a strong influence on what happened which is virtually nothing. I am guessing that next week the short term down trend will resume and continue the longer term downtrend.
One source I checked has said the SPX 50 week moving average has cross beneath the 100 week moving average. My chart show them as essentially equal. But it will cross this next week, if in fact it has not yet happened. The last time this occurred was in 2008. It was followed by a +40% decline in the SPX in less than a year. The time before that was at the bursting of the internet bubble during 2001. It resulted in a +40% decline over the next year.
The quicker line on the weekly MACD has now turned down. I believe it will cross the slower line soon. The weekly MACD is above zero. I believe it will turn lower and go well under zero. The last two times it has done this we saw ~270 point drop (late August 2015) and a ~310 point drop(January 2016). We are about 80 points into the current decline meaning we have at least another 200 points to the downside directly ahead. The Nov. & Jan. declines were about 14 weeks each. We are about 4 weeks into the beginning of this decline.
Of course this is projecting past events and sequences etc into future events. No one knows for sure. I cannot predict the future. But it seems to me the odds favor a repeat over something entirely different. I think by the end of July the worldwide markets, financial, and social conditions will look dramatically different than today. We have to wait to see. But that is what helps make all this so interesting.
Lots of buying power went into the markets on Thursday and Friday. The move up starting Thursday morning was very steady showing deliberate and persistent buying. MM were aiming for around a 2050 close an were fighting tooth and nail to achieve it an did. Moday’s action will be critical to short term prospects. Some of those long positions could be unwound next week, but the short term trend seems to me higher…
If you missed it there is a must read article on the makeup of the S&P500. In short how it is not really a nice variety of 500 stocks like you’d think it would be. Link is: http://www.marketwatch.com/story/i-dissected-the-sp-500-and-this-is-what-i-found-2016-05-09
The chart I’m posting is the monthly SPX (the OHLC bars) compared to the Russell 2500 index (R2500, the blue line). You can see what has been happening to the broader market….and once you read the MarketWatch article everything makes more sense. I was asking why the SPX is holding up so strong compared to the ever declining FTSE, Nikki, China’s indexes, world equity ETF’s, and now even the Dow Jones in the last week, etc…
Nothing new here from my perspective and why I am a big believer of Market Cap vs Total Revenue as a valuation metric. No company should be valued long term at more than 1.5 to 2 times Revenue. They always go back to this level. It’s just a matter of when.
This is why I believe the deflationary cycle is accelerating… but not many see it yet!
Let the cleansing begin! In EW terms a Grand Supercycle Bear Market!
Yet Primary wave IV is not over yet – will go well into summer/fall of 2017 as I posted about 2 weeks ago. I respectfully disagree with lara on this point (weekly chart). Only exception is if there is a large quick drop like a 1987 type to provide some corrective relief. So Primary V is coming still long term.
Sorry, I don’t see this as a bull count. I have to respectfully disagree with your view. The real fundamentals don’t support a bull count. The borrowing to buy back shares and fudge EPS game is over! Free cash flows will decline rapidly from here. Revenue continues to decline & margins have maxed and will also decline rapidly from here.
Too many people ignore the debt equation or just don’t understand it. Debt = Public + Private. The world is going to experience what Deflation really is. Unfortunately it will be grand educational experience for most & one for the ages.
This is my view also…. No disrespect to anyone else.
We all know that when this thing unwinds it wont be pretty, but i don’t think that happens for another few years yet… I simply see this as a correction on the way to 2500.
Its opposing views that make a market 🙂
I guess you guys just don’t understand IT!
That’s okay, I am not here change anyone’s mind. I only post that as more of a warning. My view is shared by very few people and very few understand what I am saying.
Thats a place where I have been before… so I am just fine with that. I am 57 yrs old… so my view is based in some experience & in history. History??? Well that is a subject very few study or care about these days.
I expect taking out the February lows will be the event that forces folk with a bullish view to re-think their position. Another major bounce there will keep the bullish case alive I think, but I am not expecting that to happen. If this is a GSC top one would expect bullish sentiment to persist even after the turn. The SPX 2500 target seems to have firmly planted itself in the minds of quite a few individuals; not sure exactly why that is considering the many techincal red flags.
Even the other guys think we just completed minor two of a final intermediate five up to finish the advance from 2009.
Yea, I read that. He has certainly changed his tune He has already called the end of that 5 three times since 2012.
So I am to believe we are in intermediate 2 of 5 from the Fed low.
Sorry, not me. I am probably going to cxl everything soon over there.
I think the argument for the bullish case is facing some very serious macro-economic headwinds in the guise of that accelerating deflationary cycle. It is quite remarkable how some big items are being totally ignored and.or dismissed by the financial press. Things like the PR default, the meltdown in Venezuela, and the Saudis now having to resort to paying government contractors with I.O.Us.
At any rate I am hoping we see a real impulse down next week. This meandering is looking too much like consolidation if continues much longer. I was really expecting a strong impulse down from the bear market trend-line at around 2059…
Position traders are going to be fine no doubt. For option traders like me and with the size of my lots, I have to be nimble, to say nothing about being directionally right within a session or two at the most. I cannot treat my short term trades like medium and long term ones unfortunately.
71% Bullish up from 3 weeks ago 70%…
http://www.barrons.com/public/page/9_0210-investorsentimentreadings.html
IF I remember correctly… the high Bullish on this index was 84% in the April-June 2015 period. So not far off the high! This one I have been viewing for years. It doesn’t bounce around like all these others… so I give it high reliability rating. We are still at a highly bullish sentiment reading.
VIX agrees with you. There is no fear in the markets. That is a bit scary.
I thought I sort of understood the VIX… But the lack of fear or to put another way… the lack of the VIX expecting any market risk whatsoever in the price. This is very shocking to me. Could they have found another outlet?
I wish I had noticed VIX did this yesterday but I did not. The disconnect between UVXY and VIX continues and although UVXY did sport a long upper wick, it got nowhere near its upper BB. Long lower wicks on SPX continue to be a reliable indication of at least a short term change in market direction. These three in conjuction were I think a cautionary note for the short term bearish case. Be careful on the short side…signals in the market are becoming more erratic. Taking profits quickly will be my approach going forward. Have a great weekend everybody…
Rodney did give a heads up about VIX at the upper BB yesterday and I wanted to acknowledge that. Good call Rodney. It probably had not punched through when you posted but clear was worth keeping an eye on.
I think I have the solution in EW terms.
Looking forward t the analysis. Our highly anticipated third waves are once again proving elusive! 🙂
I thought about saying “I told you so.” But I don’t like to be that person. In the heat of the battle, these things can slip our notice.
The chart pattern I am viewing for VIX, UVXY and TVIX is a rounded bottom. The left side (decline) of the pattern is complete and the right side (rally) is underway. How long it will take is uncertain but it looks like a couple of months or more. I do not know how reliable classical charting patterns are with VIX and its derivatives. But I am finding since it is based upon volatility rather than price, it is an unusual animal.
I am still confident my positions will be liquidated for a profit. But I have learned an awful lot in the last two months. I clearly jumped the gun on this one and played the longer term trend with the wrong instrument. Education can be costly.
My goal is to be out and SOH for Intermediate 2 since it may be a shallow retracement. Have a great weekend.
Definitely a great lesson about not being so over-confident in the wave count that we ignore real-time signals regarding price action. I know quite a few traders (including me)were lulled by the confirmation from the neck-line break and were even expecting a re-test. Those long lower wicks with steady buying after an impulse down in this market environment means scoop profits off the table. I will be keeping that in mind going forward. Feel entirely free to invoke “I told you so”, for you certainly did. I will be paying closer attention in the future…..now, where is that third?! 🙂
Vern,
It appears that market has the inside track as so far it has pretty much choosen the low probability alternative more often than high probability one. I suspect the moment EW shows high probability of a bull run, markets will go south. Like I have said before professionals have access to same TA plus tons of money through FED to manipulate the markets. So far other prediction for 3 weeks before drop in on track. SOH
They definitely have the ability to negate short term sell signals, especially in co-ordination with the banksters and that is exactly what I think happened Thursday and Friday. As someone has noted, they cannot stop the larger trend so the attempted manipulation has much more implications for short term traders..I agree with Rodney the current leg down is most likely not done…
Noting though the Dow Jones has confirmed the breaking of the neckline of the head and shoulders on a daily chart.
I am not sure what you mean by DJI confirming the break as it broke the neckline before SPX did. SPX subsequently broke, then re-took the neckline, so as of now there is no confirmation but rather a false break-down on the part of SPX. DJI remains below the neckline but that has yet to be fully confirmed by SPX. I suspect DJI will return to test the break next week before a co-ordinated decline with SPX.
Good morning every body.
The main is invalidated and the alternate hourly confirmed. Obviously.
The question now, is subminuette c over? Is minuette (ii) a rare running flat or will it continue higher to complete as a common expanded flat?
The size of the downwards movement from todays high makes me think it’s over. This looks now a bit too big to be a correction within subminuette c.
But the S&P’s proportions just aren’t always nice looking. So now I’m over to the 5 minute chart to take a look…
It could be done.
My bet would be on it’s being done. If it is, then this is a running flat, we may see some pretty good downwards movement next week.
Now to look for an alternate…..
What else could be happening here?
Could C be an ending diagonal with 3 waves up from low and 3 waves down with third wave up to follow through on Monday?
Also volatility ended at low of day.
Yep. No divergence with price and the reason I exited my short term trades. I expect the bounce will continue Monday and offer a better entry point…
no, it doesn’t look at all like an ending diagonal
K. My bad. Lol.
No worries Daniel, there are no bad questions or suggestions here. Just ideas.
SPX climbed back above neckline and held it today which was unexpected so it looks as if that break-down was a head-fake. DJI remains below but markets’ divergence makes the near term picture a bit fuzzy imo…
I believe I read somewhere that running flats are most common prior to strong 3rd waves, basically it is a truncation resulting from the immense price pressure in the direction of the upcoming 3rd wave. Is that true?
Entirely possible. That’s what I’m considering today.
Price came right up to the bear trend line noted on the chart for the alternate and reversed but the reversal seemed to lack the conviction of a third down at multiple degrees; it seemed corrective. Action in both VIX and UVXY pointing to higher prices on Monday imo…
My short term position had a stop at UVXY 13.00 but I decided to play it safe and exited early as we could again violate that level on Monday…
Exited spread trade at the close. Market neutral short term. Too much uncertainty near term. Have a great weekend all!
5min chart looks like we’re zooming up to a new high into the close.
Insanity in full force as markets are pumped higher despite the fundamentals. This is unreal and worse than the internet and housing bubble..
Yes Sir… Pure Insanity!
This is a great example of bankster muscle affecting short term market price action. Too many folk, especially on the airwaves were yapping about the HS pattern, ususally a good sign that a commonly touted event would not eventuate. The breakdown appears to be false in SPX so if that is the case, it means DJI will also reclaim that neckline next week to resolve the intermarket divergence. While a third could still be on deck, things looking a bit more bullish short term to me. The failure of the round numbers to fall this week at the advent of a third down may have been another clue missed about near term price action.
Bulls vs. Bears into the close… decent volume
2040 close would be a nice way to get this weekend started.
Bankster deep pockets on display today. It was impressive how they re-took some important pivots, especially in SPX. Time for caution on the near term short side I think….
Nuclear war over UVXY 14.00…
Is this move down from 2058.35 micro B of subminuette c? If so then we would need a micro C up from wherever micro B ends to complete minuette ii…
Anyone have an idea?
Thinking one more move up to about 2062.
Or micro 4 of subminuette C, and we need a 5th wave up to complete minuette ii?
Thats what I am favoring.
Food for thought. Is the top from April 20th down to yesterday a double zigzag? Enlarged SPX daily chart shown. I should add I’m looking to go short at 2061 area today or Monday.
Yeah – I saw that also…
I hadn’t given it much regard as the wave B in the second zig zag exceeds the length of its A wave. I know there is no specific rule about that but Lara has stated a few times that there should be (as per the single zig zag rule) so I assumed it was quite low probability (I haven’t checked the sub divisions on 5min).
I may well have got the wrong end of the stick there though (I’m sure Lara will clear it up later 🙂 )
Sorry I got that wrong – the second zig zag does break the zig zag rule imo – (it was X waves I was thinking of).
So I think that idea is invalid but would appreciate Lara to confirm or otherwise.
Also may be fitting into a zigzag – any three – flat….which is a double three overall.
If so count would remain as shown in the chart I posted.
The second structure in the double would technically be a flat (so the subdivisions of A would need to be checked, it must be a three).
Which means the whole structure would technically be a double combination; zigzag – X – flat.
Combinations should be sideways moves, this has a clear slope, it’s not sideways. It looks all wrong.
I don’t think the possibility should be very seriously considered. It breaks not EW rules, but it looks all wrong.
I see your point. That is good news as it gets us closer to the larger market drop,
Irregular b waves can be 1.15 x Wave a
Or, 1.25 x Wave a
Oh you mean an expanded flat? I thought you were counting it as a zig zag as your original post stated double zig zag.
I need to go out so don’t have time to look at a flat possibilty in detail (just had a quick glance and I’m struggling to see 5 waves in the C of the flat – lots of overlapping).
No doubt Lara will take a look at it and let us know.
Have a great weekend folks 🙂
Trying to determine what exactly is the count from the April high down until yesterday. If it is a larger A down lasting ~30 days now, then today begins a larger B up heading towards possibly 2000, 2110 on the SPX, I don’t want to get stopped out 10 times shorting the market.
If you find anything that fits then please do share!! Have a great weekend Peter 🙂
Let’s close that freakin’ gap shall we…?
I can’t believe some SOB MM just tried to intimidate me over that last order…come and take it….!! 🙂
Yep. it was that new divergent UVXY low…
A few technical and fundamental analysts are suggesting that the SPX will remain range bound until late June. It would be interesting to know if such a scenario has been assessed from an Elliott Wave perspective –and whether that seems reasonable.
Adding another 250 contracts to spread trade. Cost basis 0.05 per contract.
Each dollar over 15.00 in UVXY give a 20X ROI
Risk in addition to outlay, is 150.00 per contract if UVXY below 12.00 at end of next week, and position held to expiration…
SPX Volume well ahead of yesterday at this time 12:30PM…
But it’s options expiration day. So???
Since this whole move occurred overnight and in the 1st 30 min today (9:30-10) looks like distribution volume.
actually the whole move has happened intraday. SPX opened at 2041.88 currently at 2056.39
Futures had most of the move up before the market opened.
1st 3 min SPX at 2049.35…. 1st 6 min 2051.21… 1st 22 min 2054.86
That 1st 3 min… all that was due to the overnight futures move.
You think people entered new orders in the 1st 3 min… no-way all existing orders.
You should look for CNBC’s Implied Open… that is accurate 95% of the time 2-5 min in as the shares open for trading & settle out from the overnight futures move.
I have come to hate very rare running flats. It’s the ultimate “Will they or won’t they,” or “Should I stay or should I go?”
added to shorts near 2059…playing my cards hoping that trendline holds.
Price erosion starting to kill my short positions in triple short ETF’s even though I entered at a much higher SPX price. I am about to go underwater on all my existing positions.
I need this P3 to breakdown big within the next few weeks so that I can exit all before the next major bounce. After that I will have to trade actively.
Unfortunately, it looks like that’s the name of the game until intermediate three down arrives. The kinds of whipsaws we are seeing from all the aggressive algo trading means you have to scoop profits out of this market sooner rather than later. It is quite strange to see these lower degree corrections moving so far and taking up so much time but this is the nature of a trend that is being vigorously resisted.
Approaching resistance for the ALt Hr Bear upper pink line at 2061.09 (this 11AM hour)…
SPX doji on 1 min at 2059 but no impulse down yet…gap at 2040.15 will tell the tale…
Doesn’t this need to go higher to satisfy options MMs? At least to 2060 round number, if not to 2066 max pain?
No… 2050, 2025 or 2000 is where most of the opens are… IMO
Or if you go the other way… 2075, 2100
spy 206 is max pain, we have surpassed, and now hovering under.
UVXY should make a higher low above 13.65 with this final wave I I think. Bounce back above 14.00 today very low risk entry imo…
Bnaksters have to make a cash dump if they want to avoid a truncation…
Reloading Unicorn bullish spread. Sold next week expiration 12/13.50 bull spread for credit of 0.55 per contract. Bought next week expiration 15.00 strike calls for 0.57 per contract. Cost basis to enter position 0.02 per contract. Contingency order to exit positions with UVXY close below 13.00.
I think we have one more wave up after this fourth…
Olga – how do I get the technical studies, such as RSI and others, to appear as a histogram on IB platform instead of just a line? Continuing thanks for ‘training’ me.
Sorry Peter – not got a clue about that one (I have only ever used a line).
Maybe do a search on Google??..
FWIW, Maclellan folks are suggesting bullish bias if S&P goes over 2066 today based on bears inability to force markets down.
“Strong Summation Index promises higher highs”
https://www.mcoscillator.com/learning_center/weekly_chart/strong_summation_index_promises_higher_highs/
Poss short term action and roadmap. The small degree 1, 2 might be labelled in the wrong place – the 2nd wave is very small but the upwards move from the low to ‘1’ fits as an impulse.
Base channel (purple) might put a cap on any advance (albeit I expect price will readh 2060+ to avoid a truncation).
Hi Olga,
Here are /ES lines I am following on the 4H with Ichimoku as well as a reference.
Jim
Lara,
Thanks for taking the time to make the video today along with the normal written commentary. Patience is a virtue in all of life including equity trading. Quick In an out intraday trading can produce seriously good profits as demonstrated by several of your members. But if you are like me and do not want to be connected to the computer screen all day every day, then patience must be commensurately greater. Thanks for the reminder.
Looks like the alternate may be in play with the open being around 2048. Expiration seems to bring the stock market to locations where most people lose money, maybe 2050 is that number?
It’s very likely price will reach up to at least 2060.54 now, in to avoid a truncation imho.
That doesn’t mean it has to close that high though.
Good news is that there is only one count now (atm!)
two in a row
Same for me doc