A little upwards movement was expected to begin the session but did not happen. Price moved lower as the larger trend expected.
Summary: The probability that the upwards wave is over and the next wave down has begun is very high indeed. If the bear wave count is right (and it is supported by technical analysis), the target for primary wave 3 is at 1,423. Tomorrow, and also possibly the following day, may see a counter trend correction for a small fourth wave unfold. When it is complete, then this may be an opportunity to join the downwards trend.
To see last published monthly charts click here.
To see how each of the bull and bear wave counts fit within a larger time frame see the Grand Supercycle Analysis.
To see detail of the bull market from 2009 to the all time high on weekly charts, click here.
New updates to this analysis are in bold.
BEAR ELLIOTT WAVE COUNT
WEEKLY CHART
This bear wave count fits better than the bull with the even larger picture, super cycle analysis found here. It is also well supported by regular technical analysis at the monthly chart level.
Importantly, there is no lower invalidation point for this wave count. That means there is no lower limit to this bear market.
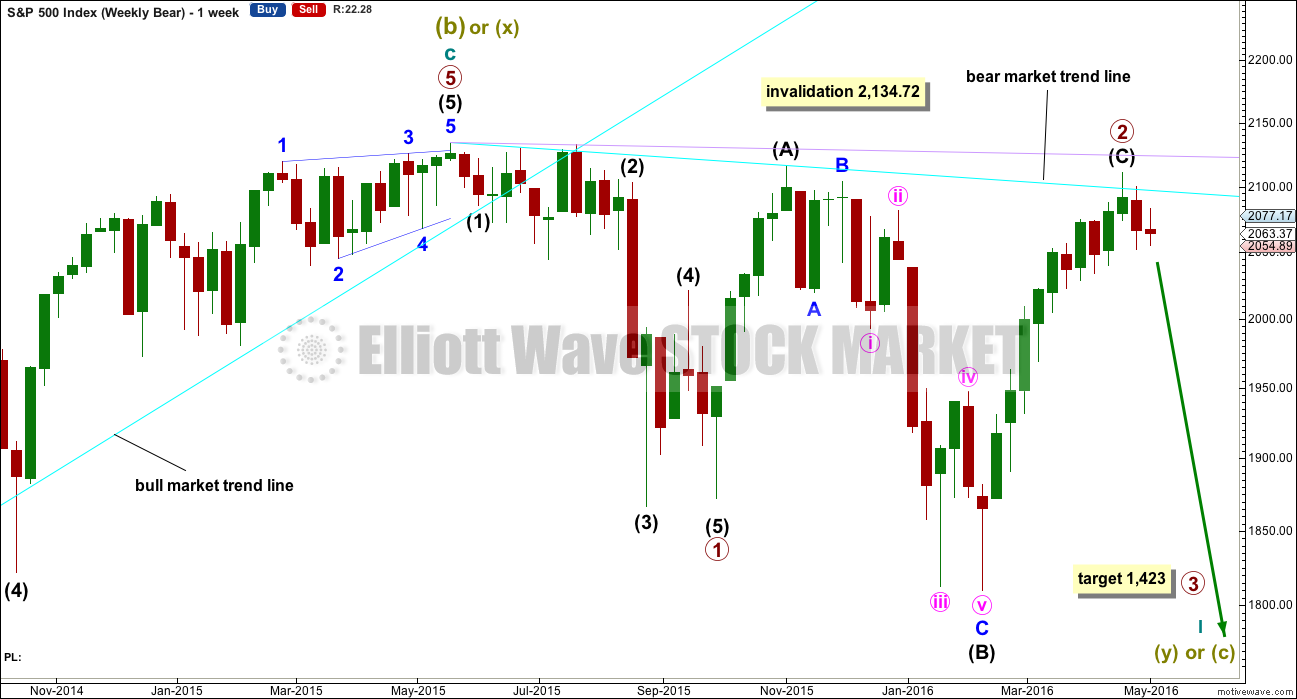
Primary wave 1 is complete and lasted 19 weeks. Primary wave 2 is either over lasting 28 weeks, or it may continue for another one or two weeks.
The long upper shadow on last week’s green weekly candlestick is bearish. Last week completes a bearish engulfing candlestick pattern.
Primary wave 2 may be complete as a rare running flat. Just prior to a strong primary degree third wave is the kind of situation in which a running flat may appear. Within primary wave 2, intermediate wave (A) was a deep zigzag (which will also subdivide as a double zigzag). Intermediate wave (B) fits perfectly as a zigzag and is a 1.21 length of intermediate wave (A). This is within the normal range for a B wave of a flat of 1 to 1.38.
It is possible but highly unlikely that primary wave 2 could yet move a little higher. If it does, then intermediate wave (C) should end above 2,116.48 to avoid a truncation. Primary wave 2 would then be a very common expanded flat.
Primary wave 2 may not move beyond the start of primary wave 1 above 2,134.72. When there is some price confirmation that primary wave 2 is over, then the invalidation point may be moved down to its end. Price is the ultimate determinator. This is the risk while we do not have final price confirmation.
DAILY CHART
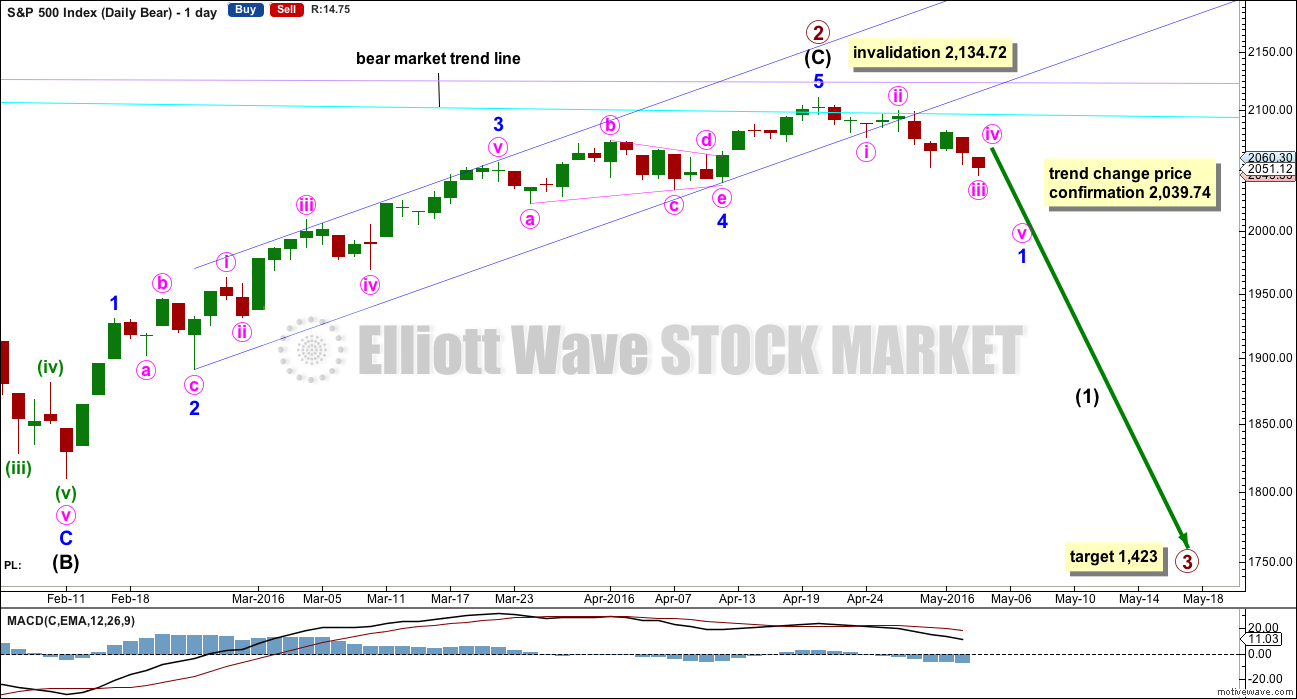
If intermediate wave (C) is over, then the truncation is small at only 5.43 points. This may occur right before a very strong third wave pulls the end of intermediate wave (C) downwards. Price confirmation of a trend change would come with a new low below 2,039.74.
The next wave down for this wave count would be a strong third wave at primary wave degree. At 1,423 primary wave 3 would reach 2.618 the length of primary wave 1. This is the appropriate ratio for this target because primary wave 2 is very deep at 0.91 of primary wave 1. If this target is wrong, it may be too high. The next Fibonacci ratio in the sequence would be 4.236 which calculates to a target at 998. That looks too low, unless the degree of labelling is moved up one and this may be a third wave down at cycle degree just beginning. I know that possibility right now may seem absurd, but it is possible.
Alternatively, primary wave 3 may not exhibit a Fibonacci ratio to primary wave 1. When intermediate waves (1) through to (4) within the impulse of primary wave 3 are complete, then the target may be calculated at a second wave degree. At that stage, it may change or widen to a small zone.
Draw the channel about the impulse of intermediate wave (C) using Elliott’s second technique: draw the first trend line from the ends of the second to fourth waves at minor degree, then place a parallel copy on the end of minor wave 3. Minor wave 5 may have ended midway within the channel. The channel is now breached decisively at the daily chart level. This provides some reasonable confidence in a trend change.
Because expanded flats do not fit nicely within trend channels, a channel about their C waves may be used to indicate when the expanded flat is over. After a breach of the lower edge of the channel, if price then exhibits a typical throwback to the trend line, then it may offer a perfect opportunity to join primary wave 3 down. At this stage, price may not move high enough to touch the dark blue trend line. It may find strong resistance at the cyan bear market trend line which is now just below 2,100. It looks like the typical throwback to resistance was quick and completed on the 28th of April.
Within minor wave 5, no second wave correction may move beyond the start of its first wave below 2,039.74. A new low below 2,039.74 could not be a second wave correction within minor wave 5, so at that stage minor wave 5 would have to be over. This would confirm a trend change.
Primary wave 1 lasted 98 days (not a Fibonacci number). Primary wave 2 may have lasted 140 days.
HOURLY CHART
Labelling for short term movement has been changed today. The final target and expectations remain the same. This labelling fits with MACD.
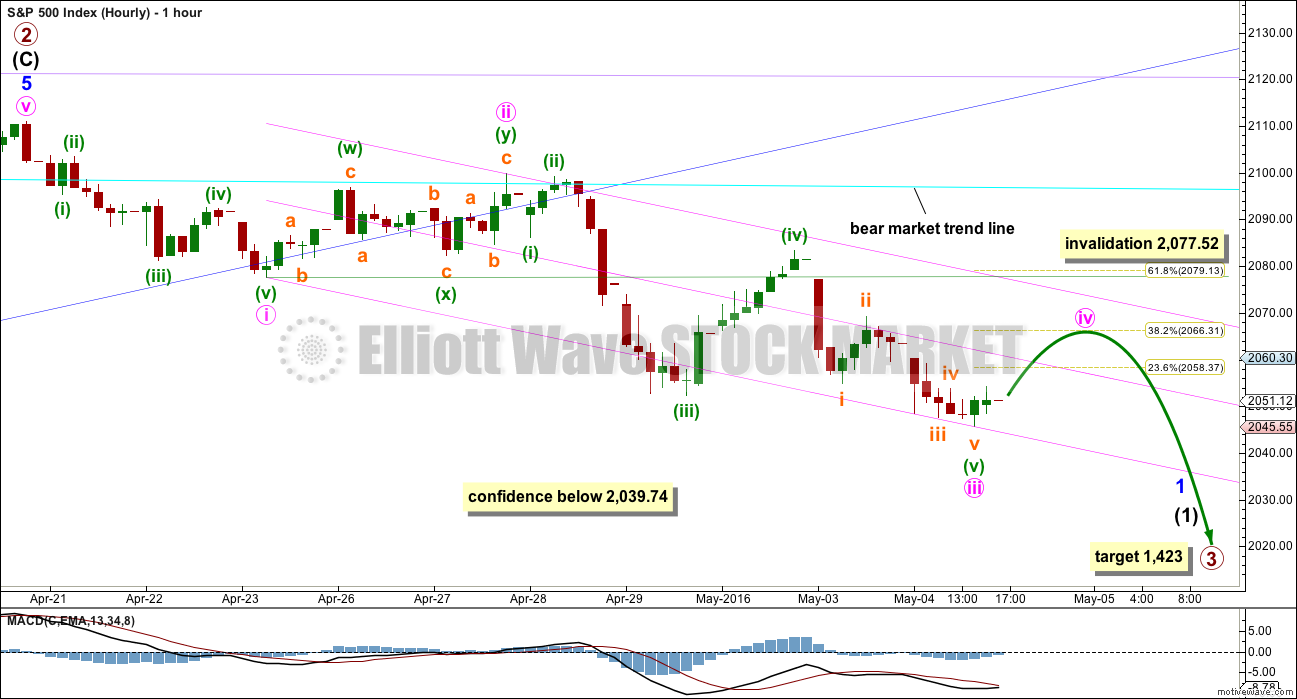
Minute waves i, ii and now iii may be complete within minor wave 1. Minute wave iii is just 0.09 points longer than 1.618 times the length of minute wave i. Minute wave iii shows an increase in momentum beyond minute wave i, and the strongest part is the middle of the third wave.
A channel drawn using Elliott’s first technique sees the middle of the third wave overshoot the lower edge. This looks typical. The upper edge of the channel may show where minute wave iv finds resistance.
Minute wave ii was a deep 0.67 double zigzag correction. Given the guideline of alternation, minute wave iv may be expected to be more shallow and a sideways type of correction such as a flat, combination or triangle. Minute wave iv may not move into minute wave i price territory above 2,077.52.
Stops may be set just above this invalidation point at this stage. The end of minute wave iv may offer another opportunity to join the downwards trend.
The most likely target for minute wave iv is the 0.382 Fibonacci ratio at 2,066.
Minute wave ii lasted for two days producing two small green daily doji. Minute wave iv may be expected to last one or two days to maybe produce one or two doji or small green candlesticks.
ALTERNATE HOURLY CHART
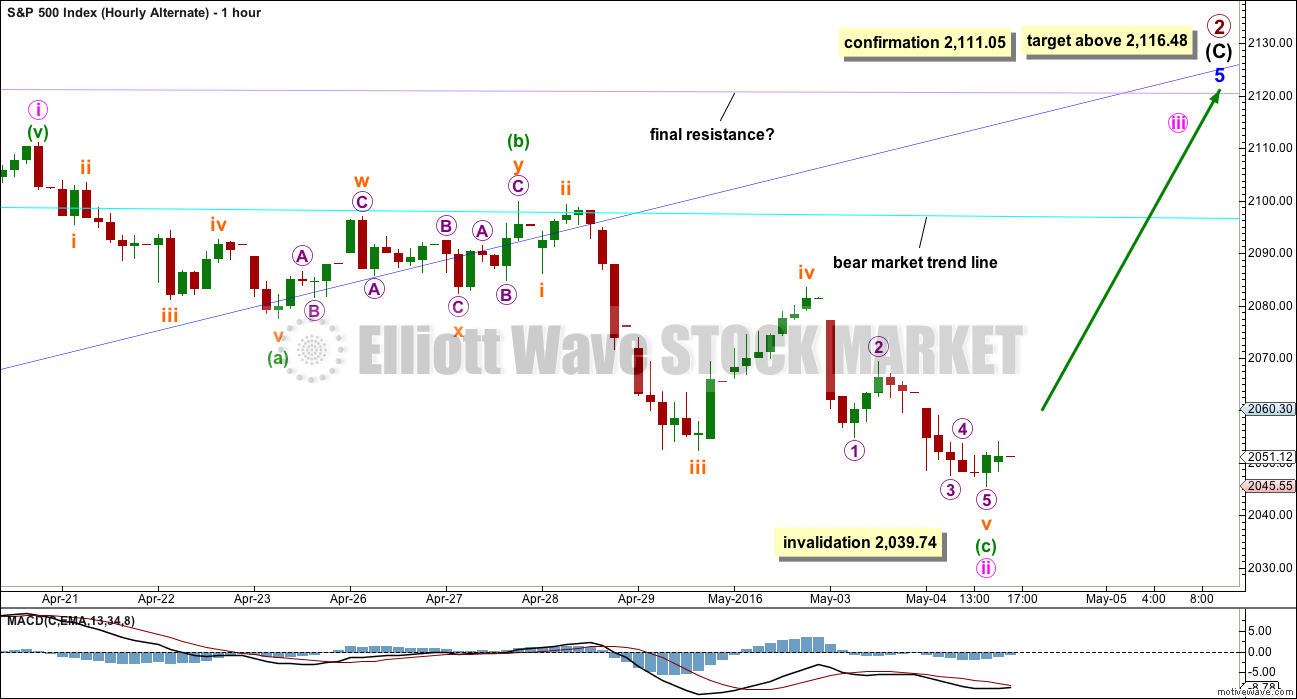
It is still just possible that primary wave 2 may not be complete. Intermediate wave (C) may yet be able to move above 2,116.48 to avoid a truncation and a rare running flat.
The degree of labelling within minor wave 5 is moved down one degree. The upwards wave to the last high may be only minute wave i within minor wave 5.
Minute wave ii may not move beyond the start of minute wave i below 2,039.74.
Labelling within minute wave ii is changed today. It will fit as a single deep zigzag. This resolves some problems the prior labelling had. The problem of the strong breach of the dark blue channel remains however. If minor wave 5 is incomplete, that channel should not be so strongly breached.
Within minute wave ii, minuette wave (c) is just 0.09 points longer than 1.618 the length of minuette wave (a).
This wave count requires a new high above 2,111.05 for confirmation. Classic technical analysis has reduced the probability of this wave count. The probability is low. Low probability is not the same as no probability; this wave count still illustrates the risk to any short positions here.
At this stage, a new high above 2,077.52 would invalidate the main hourly wave count and provide some confidence in this alternate.
BULL ELLIOTT WAVE COUNT
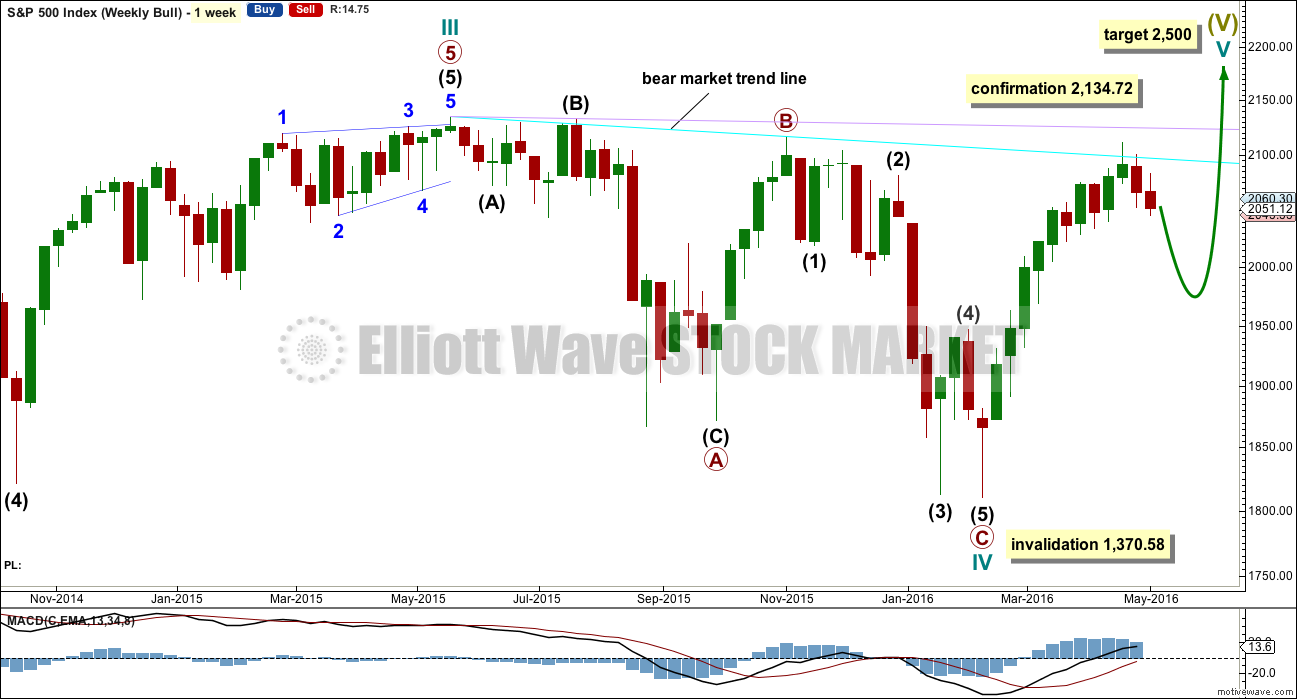
WEEKLY CHART
Within primary wave C downwards, intermediate wave (2) is seen as an atypical double zigzag. It is atypical in that it moves sideways. Double zigzags should have a clear slope against the prior trend to have the right look. Within a double zigzag, the second zigzag exists to deepen the correction when the first zigzag does not move price deep enough. Not only does this second zigzag not deepen the correction, it fails to move at all beyond the end of the first zigzag. This structure technically meets rules, but it looks completely wrong. This gives the wave count a low probability.
This part of the structure is highly problematic for the bull wave count. It is not possible to see cycle wave IV as complete without a big problem in terms of Elliott wave structure.
Cycle wave II was a shallow 0.41 zigzag lasting three months. Cycle wave IV may be a complete shallow 0.19 regular flat correction, exhibiting some alternation with cycle wave II.
At 2,500 cycle wave V would reach equality in length with cycle wave I.
Price remains below the final bear market trend line. This line is drawn from the all time high at 2,134.72 to the swing high labelled primary wave B at 2,116.48 on November 2015. This line is drawn using the approach outlined by Magee in the classic “Technical Analysis of Stock Trends”. To use it correctly we should assume that a bear market remains intact until this line is breached by a close of 3% or more of market value. In practice, that price point would be a new all time high which would invalidate any bear wave count.
This wave count requires price confirmation with a new all time high above 2,134.72.
While price has not made a new high, while it remains below the final bear market trend line and while technical indicators point to weakness in upwards movement, this very bullish wave count comes with a strong caveat. I still do not have confidence in it.
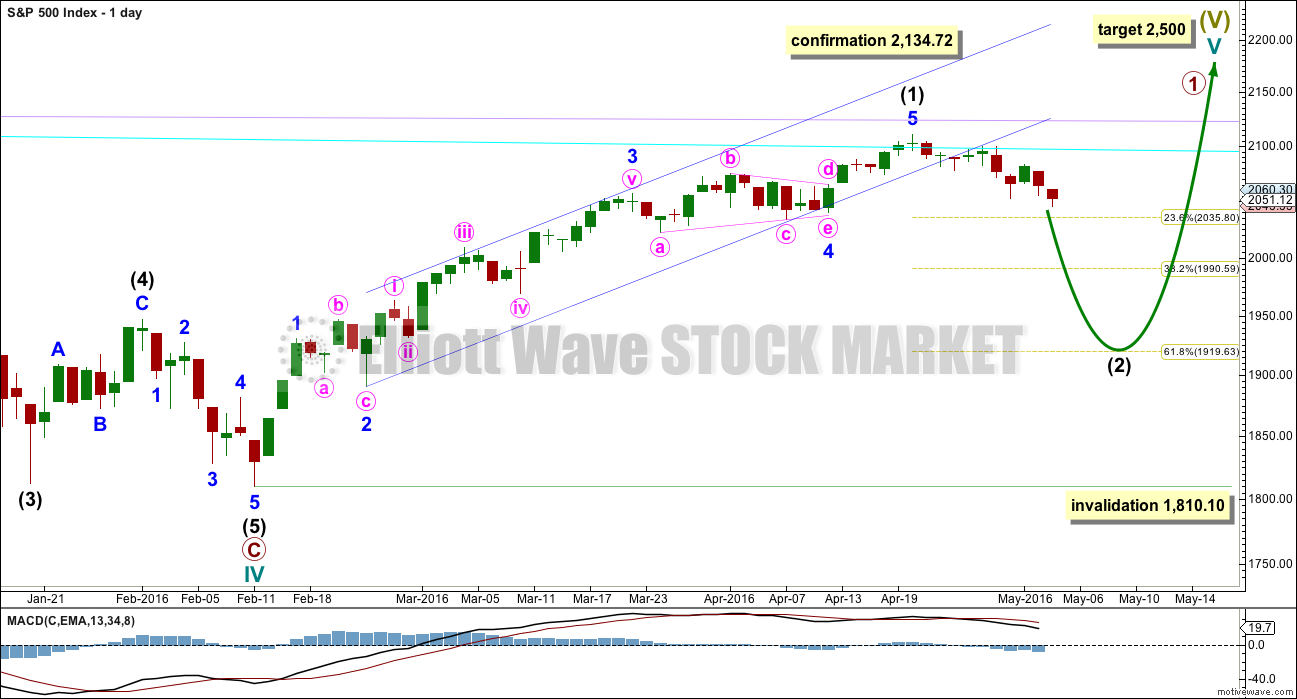
DAILY CHART
If the bull market has resumed, it must begin with a five wave structure upwards at the daily and weekly chart level. That may today be complete. The possible trend change at intermediate degree still requires confirmation in the same way as the alternate hourly bear wave count outlines before any confidence may be had in it.
If intermediate wave (2) begins here, then a reasonable target for it to end would be the 0.618 Fibonacci ratio of intermediate wave (1) about 1,920. Intermediate wave (2) must subdivide as a corrective structure. It may not move beyond the start of intermediate wave (1) below 1,810.10.
In the long term, this wave count absolutely requires a new high above 2,134.72 for confirmation. This would be the only wave count in the unlikely event of a new all time high. All bear wave counts would be fully and finally invalidated.
TECHNICAL ANALYSIS
WEEKLY CHART
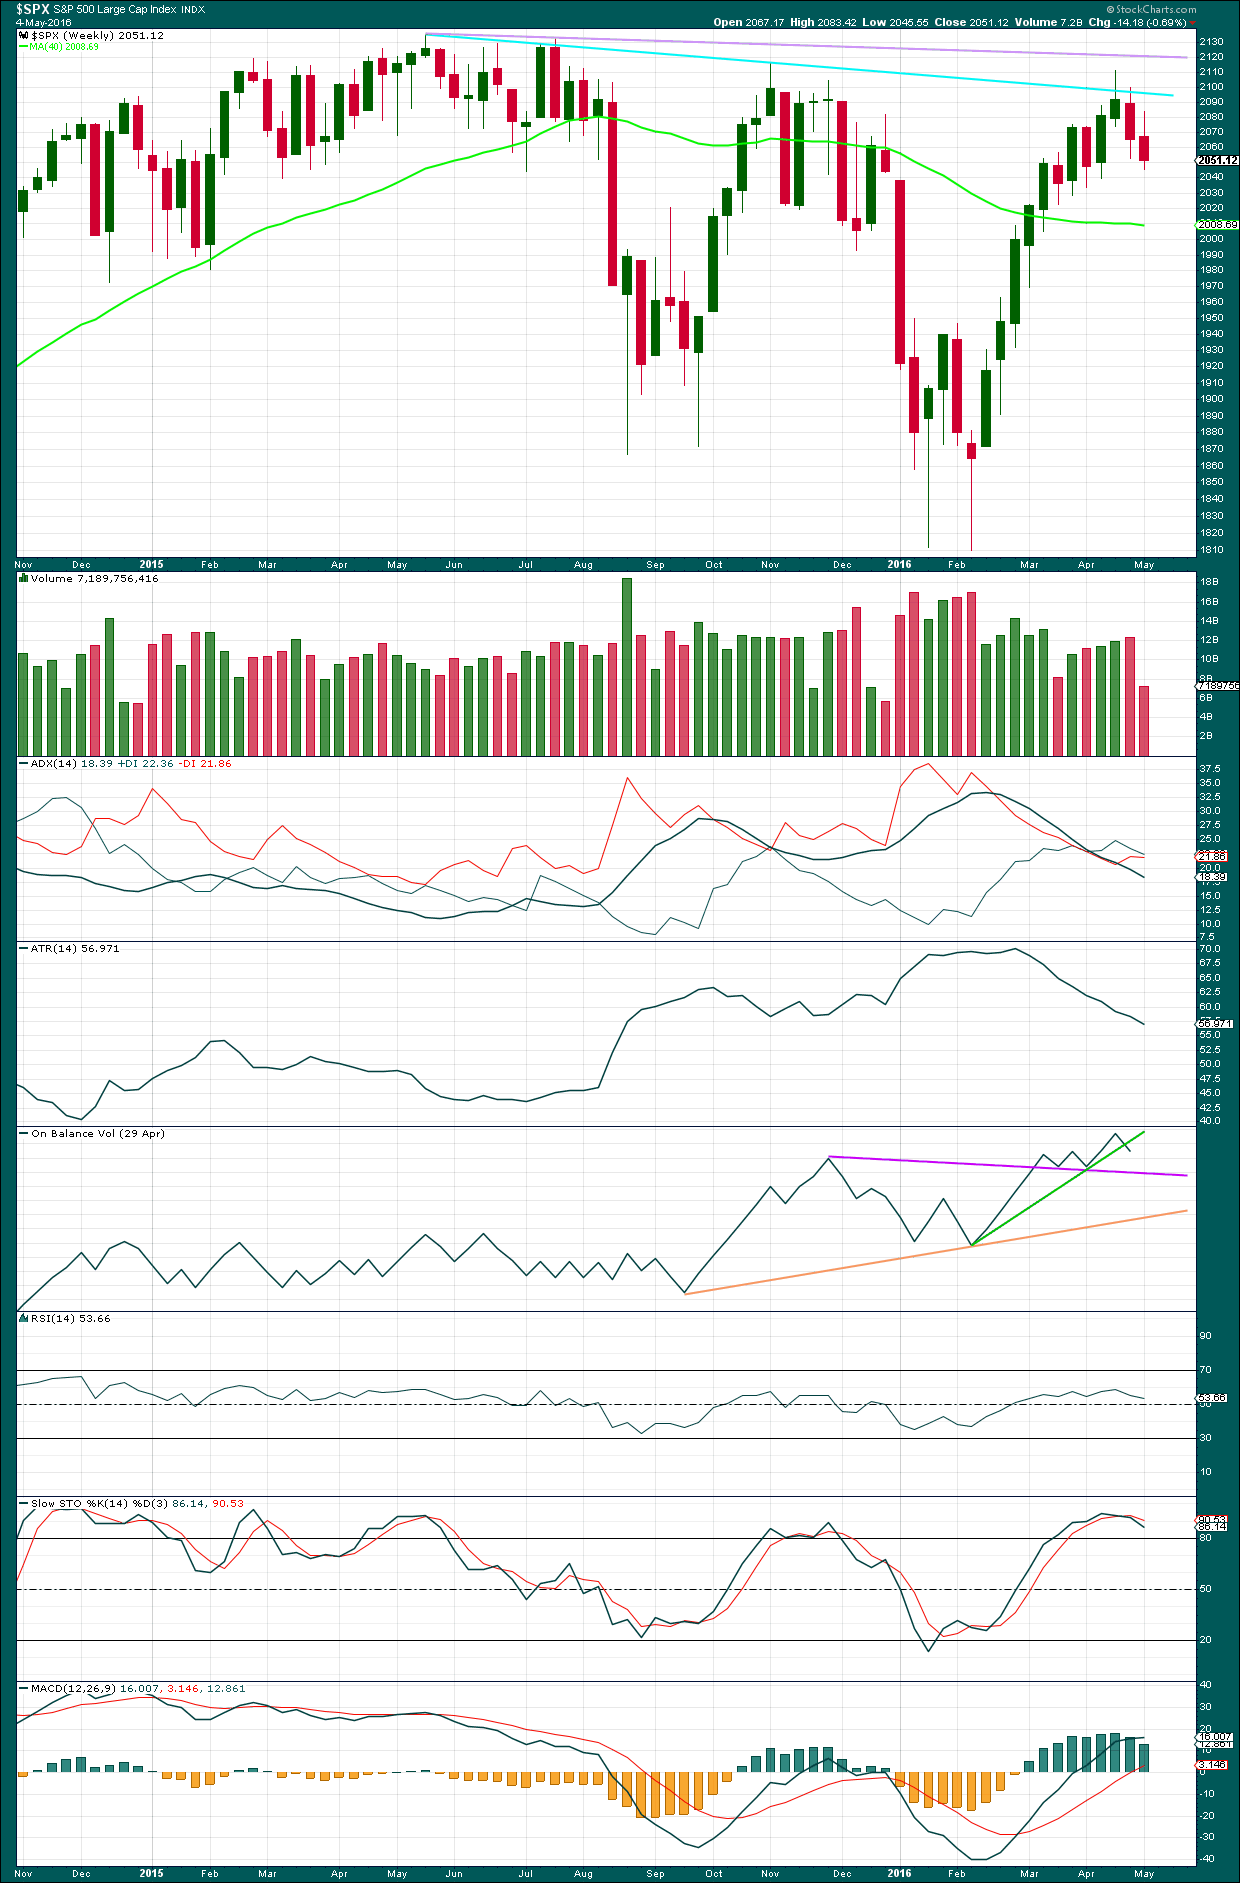
Click chart to enlarge. Chart courtesy of StockCharts.com.
We have a bearish engulfing candlestick pattern at the end of last week. This has occurred at the round number of 2,100 which increases the significance. Volume on the second candlestick is higher than volume on the first candlestick, which further increases the significance. That it is at the weekly chart level is further significance.
Engulfing patterns are the strongest reversal patterns.
This is a very strong bearish signal. It adds significant weight to the expectation of a trend change. It does not tell us how low the following movement must go, only that it is likely to be at least of a few weeks duration.
There is a weak bearish signal from On Balance Volume at the weekly chart level with a break below the green line. A stronger bearish signal would be a break below the purple line. OBV looks bearish.
There is hidden bearish divergence between Stochastics and price at the last high and the high of November 2015. Stochastics has moved further into overbought territory, but this has failed to translate into a corresponding new high in price. Price is weak. MACD exhibits the same hidden bearish divergence.
After a period of declining ATR, it should be expected to turn and begin to increase.
DAILY CHART
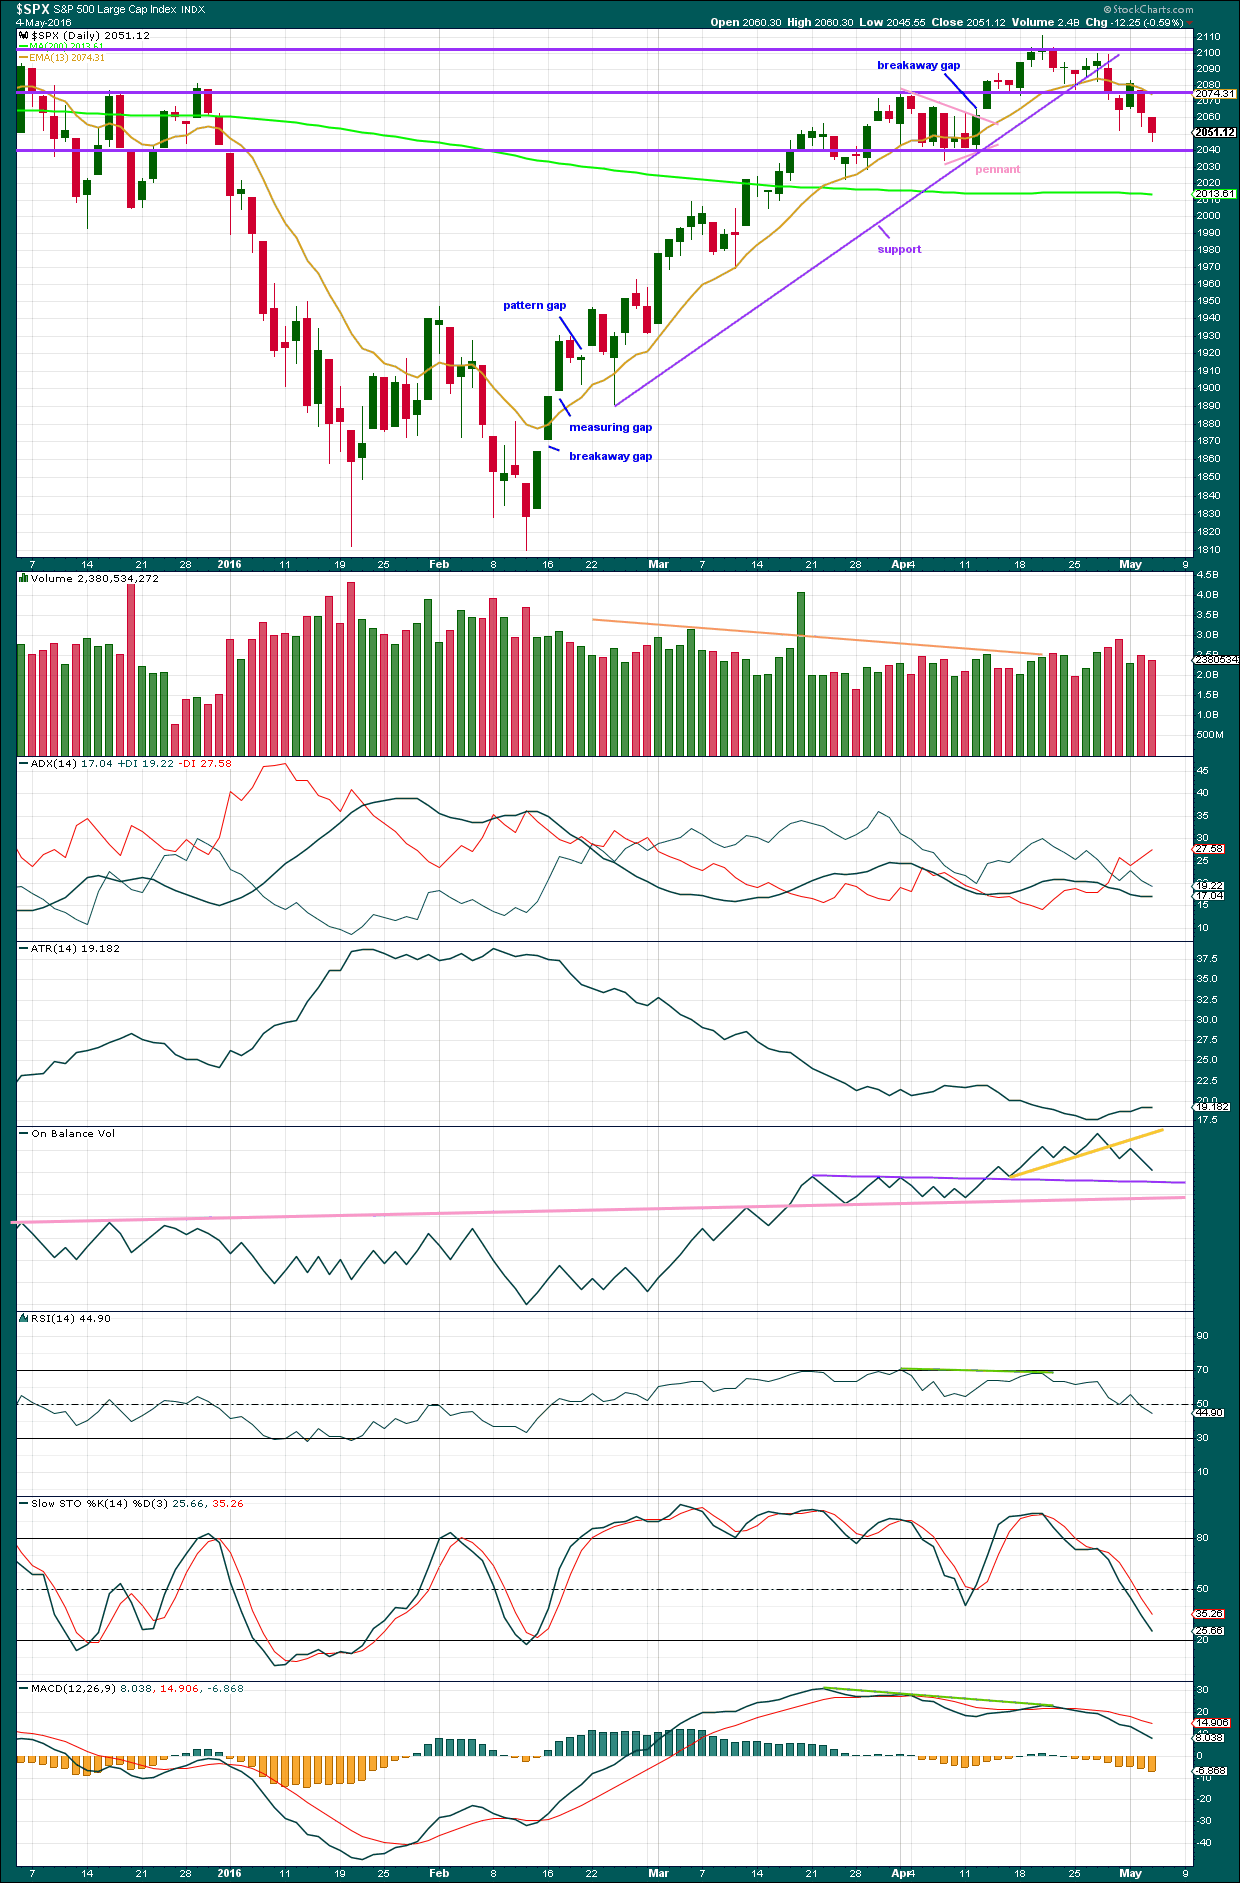
Click chart to enlarge. Chart courtesy of StockCharts.com.
Volume data on StockCharts is different to that given from NYSE, the home of this index. Comments on volume will be based on NYSE volume data when it differs from StockCharts.
The support line is clearly and decisively breached. This strongly indicates the S&P has seen a trend change.
From the last high close to the round number at 2,100, there is volume support for falling price. Volume rises as price falls, and as price rises volume is lighter. Volume was slightly lighter today than the prior downwards day. If a small third wave has just ended, then this makes sense. A small bounce may resolve this.
The two downwards days of 28th and 29th of April have stronger volume than all prior days back to 4th of March (excluding the options expiry day of 18th March). This again supports the idea of a trend change as there is clearly strong volume support for downwards movement.
Price broke below the support line and then had a quick throwback on 28th April. Price has now broken below the horizontal support line about 2,080 and is finding some resistance about there.
The next round number horizontal support line is added about 2,040. This area has previously provide support / resistance. It may do so again. If it does and a bounce is initiated from there, it would be another opportunity to join a downwards trend.
ADX has indicated a trend change when the +DX and -DX lines crossed over. Now ADX is slightly increasing, indicating the possible start of a new downwards trend.
ATR is beginning to show some slow increase. This may be indicating the start of a new trend.
On Balance Volume gave a weak bearish signal with a break below the yellow line and now a retest of resistance there. This signal is weak because the line is steep, not long held and not often tested. A stronger bearish signal from OBV would come with a break below either the pink or purple lines. These lines have not yet been reached. On the day that OBV touches the purple line, that may be when minor wave 1 comes to an end.
Neither RSI nor Stochastics are extreme. There is still room for the market to fall.
MACD is showing some small increase in downwards momentum, but it has not yet built significantly.
VOLATILITY – INVERTED VIX DAILY CHART
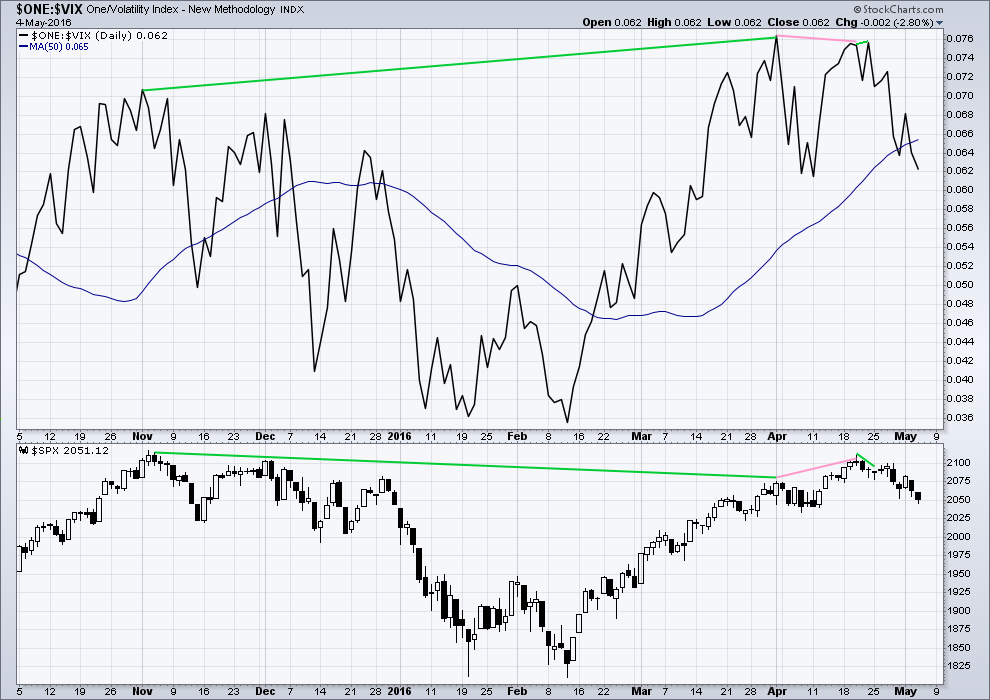
Click chart to enlarge. Chart courtesy of StockCharts.com.
Volatility declines as inverted VIX climbs. This is normal for an upwards trend.
What is not normal here is the divergence over a reasonable time period between price and inverted VIX (green lines). The decline in volatility is not translating to a corresponding increase in price. Price is weak. This divergence is bearish.
Price made a new short term high, but VIX has failed to make a corresponding high (pink lines). This is regular bearish divergence. It indicates further weakness in the trend.
At the end of this session there is no divergence with price and VIX. Price has made a new low and inverted VIX has also made a new low.
BREADTH – ADVANCE DECLINE LINE
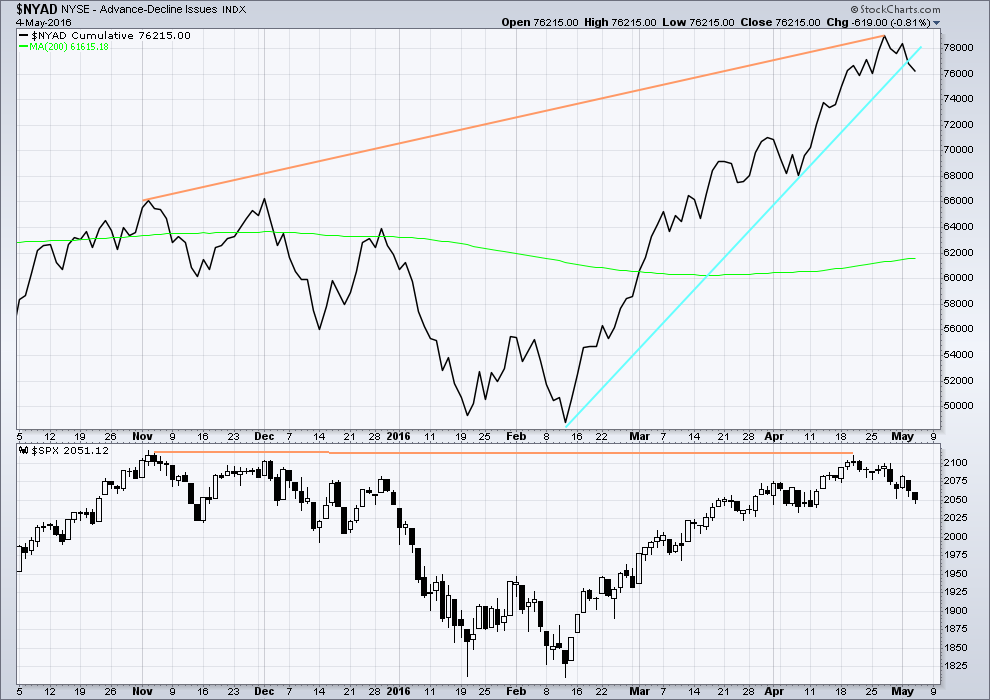
Click chart to enlarge. Chart courtesy of StockCharts.com.
With the AD line increasing, this indicates the number of advancing stocks exceeds the number of declining stocks. This indicates that there is breadth to this upwards movement.
From November 2015 to now, the AD line is making new highs while price has so far failed to make a corresponding new high. This indicates weakness in price; the increase in market breadth is unable to be translated to increase in price (orange lines).
It remains to be seen if price can make new highs beyond the prior highs of 3rd November, 2015. If price can manage to do that, then this hidden bearish divergence will no longer be correct, but the fact that it is so strong at this stage is significant. The AD line will be watched daily to see if this bearish divergence continues or disappears.
The 200 day moving average for the AD line is now increasing. This alone is not enough to indicate a new bull market. During November 2015 the 200 day MA for the AD line turned upwards and yet price still made subsequent new lows.
The AD line is now declining and has breached a support line (cyan). There is breadth to downwards movement; more stocks are declining than advancing which supports the fall in price.
SENTIMENT – COMMITMENT OF TRADERS (COT)

Click chart to enlarge. Chart courtesy of Qandl.
This first COT chart shows commercials. Commercial traders are more often on the right side of the market. Currently, more commercials are short the S&P than long. This has increased last week while long positions have decreased. This supports a bearish Elliott wave count, but it may also support the bullish Elliott wave count which would be expecting a big second wave correction to come soon. Either way points to a likely end to this upwards trend sooner rather than later. Unfortunately, it does not tell exactly when upwards movement must end.
*Note: these COT figures are for futures only markets. This is not the same as the cash market I am analysing, but it is closely related enough to be highly relevant.

Click chart to enlarge. Chart courtesy of Qandl.
Non commercials are more often on the wrong side of the market than the right side of the market. Currently, non commercials are predominantly long, and increasing. This supports the expectation of a trend change soon.
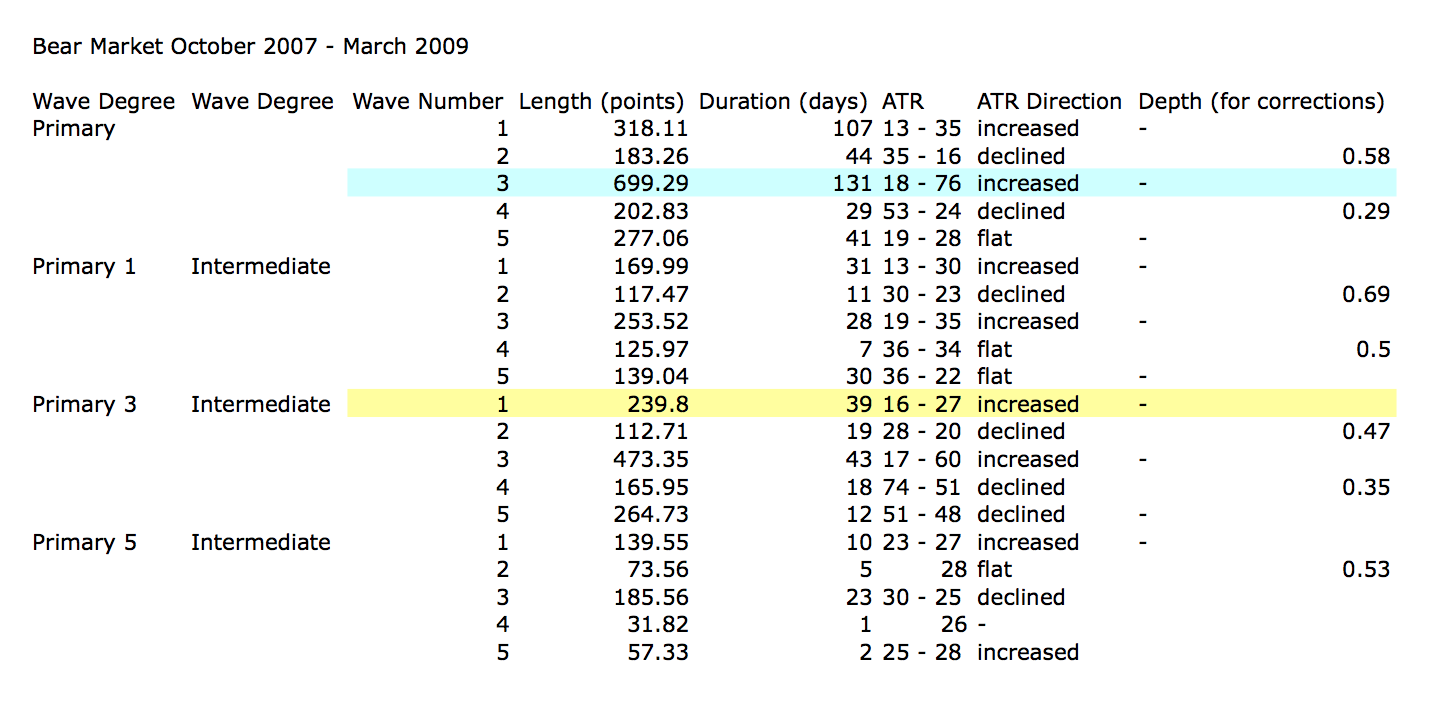
ANALYSIS OF LAST MAJOR BEAR MARKET OCTOBER 2007 – MARCH 2009
In looking back to see how a primary degree third wave should behave in a bear market, the last example may be useful.
Currently, the start of primary wave 3 now may be underway for this current bear market. Currently, ATR sits about 19 and is slowly increasing. With the last primary degree third wave (blue highlighted) having an ATR range of about 18 to 76, so far this one looks about right.
The current wave count sees price in an intermediate degree first wave within a primary degree third wave. The equivalent in the last bear market (yellow highlighted) lasted 39 days and had a range of ATR from 16 – 27.
This chart is shown on an arithmetic scale, so that the differences in daily range travelled from the start of primary wave 3 to the end of primary wave 3 is clear.
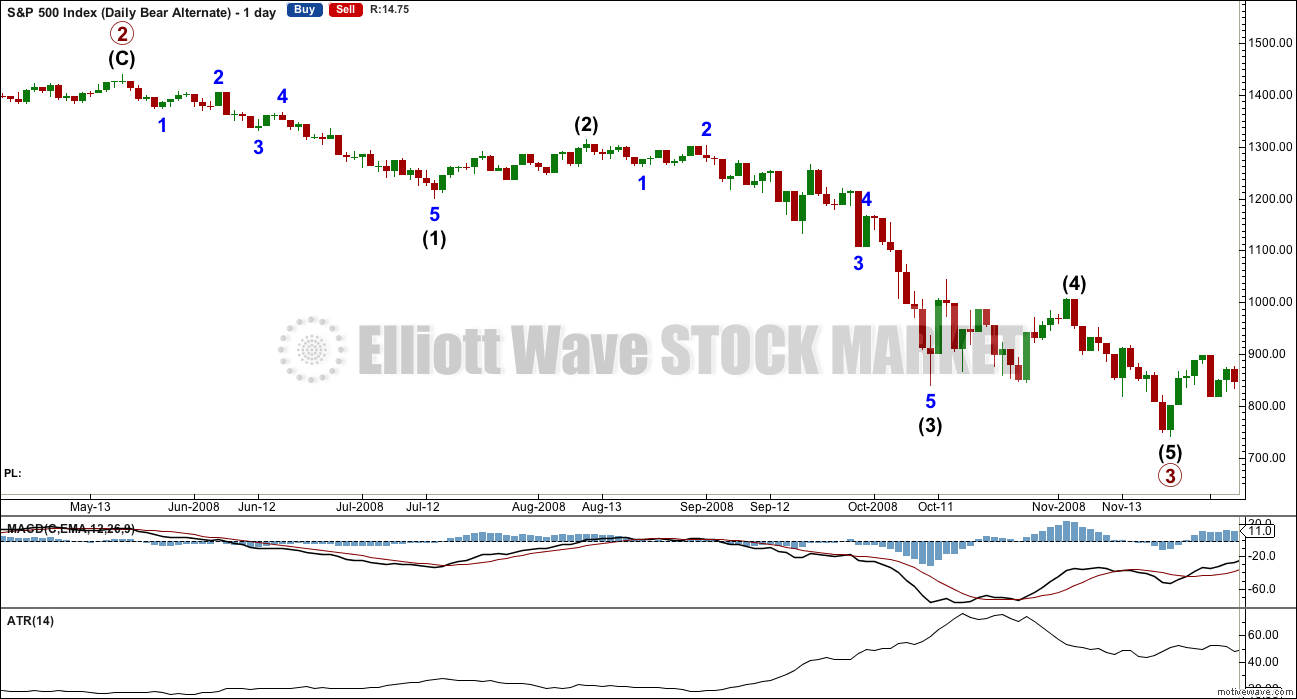
Primary wave 3 within the last bear market from October 2007 to March 2009 is shown here. It started out somewhat slowly with relatively small range days. I am confident of the labelling at primary degree, reasonably confident of labelling at intermediate degree, and uncertain of labelling at minor degree. It is the larger degrees with which we are concerned at this stage.
During intermediate wave (1), there were a fair few small daily doji and ATR only increased slowly. The strongest movements within primary wave 3 came at its end.
It appears that the S&P behaves somewhat like a commodity during its bear markets. That tendency should be considered again here.
This chart will be republished daily for reference. The current primary degree third wave which this analysis expects does not have to unfold in the same way, but it is likely that there may be similarities.
DOW THEORY
I am choosing to use the S&P500, Dow Industrials, Dow Transportation, Nasdaq and the Russell 2000 index. Major swing lows are noted below. So far the Industrials, Transportation and Russell 2000 have made new major swing lows. None of these indices have made new highs.
I am aware that this approach is extremely conservative. Original Dow Theory has already confirmed a major trend change as both the industrials and transportation indexes have made new major lows.
At this stage, if the S&P500 and Nasdaq also make new major swing lows, then my modified Dow Theory would confirm a major new bear market. At that stage, my only wave count would be the bear wave count.
The lows below are from October 2014. These lows were the last secondary correction within the primary trend which was the bull market from 2009.
These lows must be breached by a daily close below each point.
S&P500: 1,821.61
Nasdaq: 4,117.84
DJIA: 15,855.12 – close below on 25th August 2015.
DJT: 7,700.49 – close below on 24th August 2015.
Russell 2000: 1,343.51 – close below on 25th August 2015.
To the upside, DJIA has made a new major swing high above its prior major high of 3rd November, 2015, at 17,977.85. But DJT has so far failed to confirm because it has not yet made a new major swing high above its prior swing high of 20th November, 2015, at 8,358.20. Dow Theory has therefore not yet confirmed a new bull market. Neither the S&P500, Russell 2000 nor Nasdaq have made new major swing highs.
This analysis is published @ 11:11 p.m. EST.

My apologies everybody for not being here to make the usual NY afternoon comment. Had to pop out early my morning.
Not much happening with this market today really though. Small sideways.
On the five minute chart I wouldn’t think minute iv is over yet. I think we have A up, B down, and now need C up.
It’s still not possible to say which of a triangle, flat or combination minute iv will be. All I can say so far it it’s most likely incomplete.
Another one or two days? of sideways movement.
Then a downwards breakout to complete the impulse of minor wave 1.
I have a feeling that we will see some bulls up to 2100 on SPX from 2040 level. On monthly chart it looks like its not ready yet for a big fall and it needs some more time. For comparison GBP/JPY looks oversold on weakly and we will probably see some movement up very soon. What do you think guys?
howz bout that,, Im number 100,, tomorrow could be interesting with jobs report and all
I left it just for you doc.
Market and big boys waiting for the job report tomorrow
Not much to see here. For what it’s worth, this market is not trading like the next big move is going to be to the upside. Plan accordingly. Have a great evening everybody…’Bye!
I think you’re right – I thought there would be the usual melt-up afternoon – no, those days may be over…
turning into another low volume chop fest
Printing a red candle today very cagey indeed….I think there are some sharks in the water… 🙂
Mr Unicorn still flashing that horn; what is he up to?!
Just bought a very small UVXY postion for a scalp to the downside – RSI div and price overlapping. Set an auto sell @ 17.10.
If we go above 2053.36 then I’m in trouble!
Going out on the raz tonight so I need some beer tokens 🙂
I need to get myself ready – good evening everyone 🙂 🙂
Have fun! 🙂
nice scalp…
Filled!! A few sherbets on Mr Markets tab – and quite rightly so.
Right.. I’m outta here… Night all 🙂 🙂
http://www.urbandictionary.com/define.php?term=sherbet 😉
Shoobie, doobie doo! 🙂
definition 2 ? you can tell me, Im a Doctor
Have a fabulous time Olga! Mr Market paying makes it all the sweeter
A move above 2049.55 reduces fourth wave possibility and says we are probably going higher….above 2053.07 confirms….
Should again point out that we are talking about very small degree moves as they unfold (for me on the 1min chart).
Please nobody trade based on my ramblings (I’m not placing any trades atm myself – there are still too many horses running in this race to be betting on any)
Ditto! 🙂
All very academic people… 😀
Looking to me like now a fourth wave of a developing impulse down….it would be ironic to see a deep second wave up into the close… a helluva bull trap…!
Move below 2045.60 increases odds….
Nope, back below 17 is a no go….!
Olga probably correct…..
I think its currently tracing out iv of c of (b). If we move above 2051.70 it might be over – 2057.89 is absolute price confirmation that this move down was corrective.
If this is a 4th wave it cannot go above 2053.35 (poss W1 of c low).
If he moves back below 17 I am voting with Olga on that B wave…..if he clears 18,…. forgeddaboudit!! 🙂
I think we have one more pop downwards to finish this move. Ironically I’m hoping it stays above 2039 🙂
If the Unicorn gets close to 20 today I would take profits. That is first basing area and I think about where minor one will complete….
Noooooooooooo – I want at least one more scalp before that!!!
alright..i bit. I’m in some 5/31 SPX 2050 puts…i like to play a few weeks out
I hope you plan on taking profits long before then…. 🙂
strike price few weeks out…
Let’s see if the Unicorn (UVXY) can poke his head above water. It would be just like Mr. Market to complete minor one down today and trap a bunch of sluggish bears with face-ripping futures overnight…. 🙂
If this move down (from todays high) ends up being a 5 wave structure then you may well be right. But what would be W1 looks like a 3 wave structure to me (though it *could* at a push be counted as either)
ATM I still think it is a B wave so will be fully retraced – we are just finishing up (c) of B now imho – it should retrace at least 90% of the whole move up (so go below 2047.06), but it could also make a new low.
I would be genuinely surprised if the fourth was not done. They drive you crazy by being protracted, interminable, and difficult to interpret but don’t generally pull head fakes unless the are moving out of some kind of triangle…
Just seems a bit quick to me – W2 took 3 days. That of course doesn’t mean you are not completely correct.
Whilst price remains below 2051.70 the odds remain in your favour.
I’m still keeping an open mind atm. If price goes below 2039 I’ll reluctantly need to do something. So yer can safely bet the farm that is exactly what will happen 🙂
Hyuk! Hyuk! 🙂
Updated Chart
This B wave (if that’s what it is) could even take us below 2039 – now that’ll leave me with an interesting dilemma!! 🙂
Why Mr Market…. you old rascal.
Tricksy isn’t he? I am expecting “surprises to be to the downside”, to quote our beloved leader…. 🙂
It takes great discipline to stare down this tricksy market.
One of the toughest trades to make is the “No Trade”. 🙂
I’m looking for 2 5 minute candles to hold below the opening 15 minute range on the SPY before entering any shorts today…with lower lows
all the markets seem to be in a state of paralysis. Probably because of NFP tomorrow. It always amazes me how so much store is put on one monthly set of figures!!!
{MetLife Inc., the largest U.S. life insurer, said was seeking to exit most of its hedge-fund portfolio after a slump in the investments. According to Bloomberg, the insurer is seeking to redeem $1.2 billion of the $1.8 billion in holdings, a process that may take a couple of years to complete.}
I suspect they will cash out of anything that does not have a redemption restriction ASAP.
If they exiting… all US Life Insures will do the same.
Joseph,
Another article stating record redemption on Junk bonds ETF.
Here is another one on VIX
http://www.bloomberg.com/news/articles/2016-05-05/vix-can-be-deceiving-as-steep-curve-shows-uncertainty-analysis
US Life Insures do NOT buy junk bonds or invest in hedge funds that buy junk bonds. They only buy investment grade bonds. They have a regulator from every US State in the USA looking out for that.
I just want to be clear about that!
Yes, I understand that and was referring to another article detailing issues with junk bonds.
Do you trust the rating agencies?
Nope (presume rhetorical – but bit anyway 🙂 )
Lehman Bros, AIG…. nuff said.
For that matter – do I trust any financial institution?? (PS – same answer)
Lehman Bros… not an Ins Co.
AIG… the issue was with one of their holding company subsidiaries (related to Wall Street) and the Real Insurance Company part of AIG… the part backing their insurance businesses were completely sound and safe… and completely sealed off from that subsidiary.
The press & others never distinguished or communicated the separation. The AIG stockholders go broke… the AIG bond holders go broke… The policyholders 100% safe.
The holding company issues the stock and bonds… not the sub
Even without the bailout?
The question is sincere as I really do not know the answer.
You seem more knowledgeable about the inner workings of these kinds of policies.
Verne’s question was about ratings agencies – I only provided those company names as evidence of whether one should trust ratings agency opinion.
Yes… even without the bail out!. The State insurance departments would have seized and placed into receivership all the Insurance Subsidiaries and managed the assets backing the ins commitments (which are held and must be held in those subsidiaries) for the benefit of the policy holders.
I am most interested to know what has been happening to all those insurance policies and annuities that depend on a stable fixed rate of return to maintain their viability. Many of them hold European assets where NIRP has now been implemented. The ZIRP in the US I think has already inflicted a mortal blow on a lot of these instruments. The rating agencies papered over the problem with phony ratings to allow the banks and insurance companies to claim the higher needed rates of return. It is going to be quite a mess when the bond market unravels.
The older block of business is liability matched to the insurance commitments.
It’s the newer business that is affected… The month the new business is issued in is matched a new investment. But that is dealt with through issuing policies at a higher premium or if an annuity… issued at current market rates.
The longer interest rates stay low does affect profitability of the insurers going forward. But does not affect assets backing the commitments of the insurance policy holders.
There may come a point where insurers will not issue New Policies/New Business… In a NIRP environment that is what insurers will do.
Insurers hold Bonds to maturity… to meet insurance commitments.
Banks… DO NOT!
It’s two very different businesses.
Now if all investment grade bonds turn to junk bonds within say 1 year… then that’s a whole different analysis and insurers will go under.
But if that happens… you better have a big supply of food and drink in your homes and a supply of gold or silver in your homes. Society as we know it will be over for a period of time.
They also do their own credit analysis on everything they buy. They are very good at that and their portfolio is constantly reviewed for credit and actively managed. So with US Insurers rating agencies are a moot point.
To answer your question… no I don’t trust rating agency’s.
Thanks for the explanation. I must say my core concern regarding the assets remains. It does not matter who is managing them if the assets backing the claims loose a substantial amount of their worth because of initial mis-pricing. I know for example regulatory agencies recently relaxed the so-called “mark-to-market” rules for banks but I am not sure if that also applies to insurers.
Opened contingency order to buy near dated SPY puts contingent on SPX taking out this morning’s lows at at 2045.55….
what strike and expiration you looking at?
Next week, 202.5 strike; essentially a scalping trade on minute five down…current bid/ask 0.74/0.75 which should go down to around .60 with a final move up for this fourth wave ( for the more adventuresome!)
I’ll probably pay a buck if I let the contingency trade trigger rather than manually buying on the SPX pop higher if it comes….
Looks like we need one more wave up to complete an ABC….
Not a whole lot of buyers judging by the volume, doesn’t look like a healthy bull market. I expect this to continue till 3:00PM or so when the big boy adjust their positions ahead of the market close.
*IF* my count below is correct and we are tracing out a flat correction, then we should correct down 90% of the upwards move (as Wave (a) is 3 waves) – and might even make a new low below 2045 (expanded flat).
We are currently in a B wave atm imho – the worst wave of all to trade and analyse.
Actually, I would not be surprised to see a massive downdraft to complete minute five today. The impulse waves down are unfolding really quickly to keep the bearish traders off balance. Trading this market is like fighting a guerilla urban war… 🙂
Possible near term action (1 min)
We should see a nice little spike in UVXY. The short sellers are jumping a bit too soon and probably not expecting another leg down prior to minor two up. Smart money pouncing on the dips…
NDX again leading the way lower; this fourth wave may be shorter-lived than anticipated. Buying back UVXY calls sold against my position for small gain..
The mania in the miners starting to wane. Made a few great trades when they started cavorting above the upper BB. Reversion to the mean trade is a great bread and butter strategy. In currencies the Euro is also due for an “attitude” adjustment methinks…. 🙂
Imho shorting GBP against CHF could prove to be a very good trade over the longer term. The chart of GBP:USD is suggesting 1:1 eventually (or close) and I think CHF will gain over USD.
That said, the above trade is probably just a proxy for long gold / PMs – so just do that instead or 50:50 (especially if GBP is your local currency).
All the above trades are currently active in my own long term wealth preservation portfolio.
GBP:USD Chart – possibly just approaching the start of a strong 3rd of a 3rd down (poss Minor 3 of Intermediate (3)??).
Move up from the 1.39 lows def looks corrective to me so should be fully retraced and then some.
Open UVXY gap at 15.05 from close on May 2. Let’s see if wave four strong enough to fill it…I doubt it…
He he – I hope so!!
But UVXY already seems to be getting a bit twitchy..
Do you mean twerky??! 😉
Well the first wave up doesn’t seem to want to hang around. Just how I like it 🙂
If we’re lucky enough to get close to 2077, I’m gonna throw the kitchen sink at it with a stop at 2078.
My favourite W4/W1 setup – watch Mr Market spoil the party.
IHS forming on hourly?
If the main count is correct then it shouldn’t play out as it would invalidate the count (go above 2077), but stranger things have happened.
If this is a fourth wave playing out then I think we will stay range bound (sideways) for a couple of days.
I’m keeping an open mind – there are a few options on the table atm.
NQ100 penetrated its 13-day channel overnight then returned. Now both (spx and nasdaq) staying closer to the top of their respective channels — not too promising for impulses down, rather for w2 up. If range-bound for 2 days, would leave the channels (to upside).
By 13 day channel do you mean moving average? I have base channels on my chart – there’s only been 12 days (inclusive) of trading since 2111 top from what I can see. Perhaps you could post a chart so I can see how you have drawn it?
I don’t personally place much weight on overnight trading – I only analyse / use S&P cash during market hours for trading purposes.
The impulses down are continuing to complete intra-day and traders who are not paying attention to this reality risk having hard-earned profits evaporate. A time will come for confident position bearish trades but until we get the down-trend in high gear scalping is the best strategy…
Cycles are showing a bias toward an up day to around 2080. Spy prices spike to SPY 206 support that as well. Downdraft at the open is a chance to tighten up stops, as gap up open is almost filled.
Useful information David thanks – would really appreciate if you could do a quick daily update (like you have done here) of expected bias anytime you get chance.
On it’s own I wouldn’t personally give it major weight for trading (I solely trade based on price) but it is another interesting data point to verify or question my own short term EW analysis. It’s not information I know how to access or understand enough to interpret effectively myself so your update it very useful.
I agree, though in most markets it is more accurate, in this market I use it as a bias. In times of indecision it does help one lean toward one count or the other.
Here is the cycle chart.
It shows a short bounce up for one or two days, though the bears looking like they want to kick some butt. Stopped out of most bearish positions due to tight stops, dang it. For once, rooting for the bulls for a reload opportunity!
I do not know if you’ll see this, David, but thanks for the chart and comments. Very helpful
Speaking of cycles, here is a graph of one of the most powerfully predictive that I have ever seen. Some of you may be familiar with the famous Russian Kondratieff and the wave named after him…
Yes! Awesome… and W. D. Gann
From TradersWorld magazine Mar/Apr/May 2016 44 article “Metals and Miners Set to Explode” By Chris Vermeulen
From a combination of Gann, Fibnonacci and Telsa analysis
“My projected downside targets are: 1588, 1441, 1239, 1012 & 675. The US markets will continue to be under continued pressure as the global markets continue to search for footing. It is because of this single aspect of the markets, relating to multiple facets of global economics, that I believe the metals and miners are due for a long and strong rally.
The ES must breach the current support level of 1800 before any substantial price decline will expand. Watching the metals markets for early signs of price advance will provide some insight as to the overall strength or weakness in the global markets. The metals will only continue to advance if the global consensus is that of fear and uncertainty.”
ES High overnight… 2060
The SPX equivalent of the ES overnight high… ~ 2066 Lara’s target for main bear hourly.
Patterns are patterns no matter what the index or cash vs futures.
We now have a confirmed breakdown of a head & shoulder pattern for the ES, YM & NQ indexes on their 10 min charts. + my previous post above.
Quick Question for Laura – What is the Time expectation for Primary wave 3 to unfold into the target area? Thanks.
Will answer in todays analysis
More on FED…
“The Fed’s decision-making and communications process is broken and has been for some time,” Fisher said in a speech to the Shadow Open Market Committee last week.
If the Supreme Court functioned as the Fed does, with the chief justice hinting at key decisions while other justices gave frequent speeches that reflected profound disagreements, the nation would be “embarrassed,” he said.
Full article http://www.marketwatch.com/story/feds-structure-is-broken-and-needs-overhaul-former-insider-says-2016-05-04
The Fed needs to be replaced with something else or just dissolved…
They are nothing more than a propaganda machine! Don’t believe anything they say… just watch the actions they take. However, that is nearly impossible these days. They need to be audited each year and publish 10K’s or other detailed audited financial report. Just like every public company needs to do.
I am very curious to see what UVXY will do during minor two up. I would not be at all surprised to see it make yet another 52 week low, so entrenched is the bullishness of the crowd, and the confidence of the short sellers that new all time highs are on the way. If most people are thinking that we are just starting a new five wave impulse up it would make sense to not cover and in fact even more short sellers may pile on on whatever pop we get for minute five down. My only concern at the moment is that it stays above ten as a move below might persuade the issuers to spring one of their infamous reverse splits. I like when it is trading this low ahead of a third wave down as you can buy boatloads of calls for under a buck that are close enough to being in the money to give you an easy ten bagger. It is going to be interesting to see how things develop.
I’m happy with that – would be nice to sell in (mid?) 20’s then jump back on board low teens!
Personally I’d rather the price was higher (so rev split) as I pay 1$ per 200 shares to IB 🙂 My commission bill is currently horrendous.
You should see mine. IB is downright generous compared to OptionsXpress, and they tell me that I merit a special discounted rate….yeah right..!
“Tell me lies, tell me sweet little lies…” 🙂
The basing levels that I will be watching to see how UVXY performs on minute five down are highlighted in the posted chart. I think we will run up toward the first one around 20 on minute five down but I am confident that they are not going to cover at that point. I expect they are going to hold on during minor two up and won’t start really feeling the pain until minor three down arrives.
It would be a beautiful thing if they do( hold on i.e.)…. 🙂
You actually want the opposite of a reverse split as that makes the shares more expensive. The last time they gave you 1 share for every five you owned and increased the price five-fold. It really screwed up my steady covered call strategy to reduce exposure as it vastly reduced the number of contracts I could sell against my position without spending a ton more on my position. Bottom line? Reverse split? bad! bad! (remember that clown?)
It should trade down to just under 16 for this fourth wave up…
🙂
As I’m trading the shares, I’d need 5 x less shares for the same position value so my commission charges are 5 x less.
Below UVXY 20 my average commission charge is over $20 per trade. To cash out is well over $100 – that’s alot of money to me!
I get it…
OptionsXpress will let me buy up to 1000 shares for the standard price of 10.00…not so bad after all…
TD Ameritrade… $9.99 for internet share orders, no matter what the share size or the $$$ size.
1 million shares+++ or $1 million+++ doesn’t matter.
As a result of the modification to the bear wave count combined with the nature of VIX derivatives, my strategy or plan has changed. I will exit all positions as near as possible to the Minor 1. I have yet to do my calculations for a target. I suspect my TVIX positions will be at a small $ but reasonable % profit maybe 10% or so.
I will most likely sit out the Minor 2 correction looking for a good entry point near its termination. I suspect Minor 2 will be deep retracing up to the 2100+ level.
This is not what I was expecting. But that is the norm for trading, expect the unexpected. Vern, your concern yesterday is validated by the necessary modification to the wave count. Good ‘feel’ or spot. Thanks.
Unfortunately, this change may really mess with my schedule and planned expedition the first 2 weeks of July.
Very smart move. You will get a much better entry. Take the small gains on minute five down and lock and load for the top of minor two…. 🙂
There is a fib cluster right at 2040. Bet that’s where this minute v ends. Minute iii ended right on another higher cluster.
Quite an important confirmation point just below there 🙂
If we had 5 waves up to 2110 are the ABC corrections also labled as minute i,ii & iii?
Just very curious how elliott waves turn from bullish to bearish and vice versa, is it just the fact that they break formation.
Lara,
Looking at the last P3 from 2008 is very interesting. I noticed that intermediate (3) was the steepest and longest of the intermediate waves, but within all the intermediate waves, it is the minor 5’s that are the strongest/steepest part of the intermediate waves…
I had imagined it would be minor 3’s that would be the strongest…
Is this typical?
And this leads to my other more short-term relevant question: can we expect minute v to be stronger/deeper than the minute iii we just completed within the current minor 1?
That’s what I mean about behaving like a commodity.
Commodities typically have swift strong fifth waves, particularly the last fifth wave to end their third wave impulses.
And so if that is how the S&P behaved in the last bear market, it may do so again now.
Or it may not.
Short term I wouldn’t be expecting this. Not until we get into intermediate (3) perhaps?
Time keeps on slippin’, slippin’ slippin’…
Into the future.
That was a great song. Steve Miller Band, right?
Oh Yeah! 🙂
Now let’s go fly like an eagle!
Tonight’s analysis is a classic example of why I think Lara is the very best at what she does. Great adroitness at making adjustments to the wave count based on price action and keeping us gunslingers on the right side of trades. That is total awesomeness dudes!! 🙂
Hey Olga, really sharp eye spotting the end of that impulse down.
Why thank you very much sir.
You all are slipping. #1