So far it looks like the alternate hourly Elliott wave count may be right, but we still don’t have price confirmation.
Both hourly charts will expect the same movement next for the short term.
Summary: In the short term, a small fourth wave may move higher and must remain below 2,086.09. Thereafter, a fifth wave down may complete an impulse at 2,046. With a decisive breach of the support line at the hourly chart level at the end of today’s session, the balance of probability has shifted to seeing at least an intermediate degree trend change at the last high for the S&P.
To see last published monthly charts click here.
To see how each of the bull and bear wave counts fit within a larger time frame see the Grand Supercycle Analysis.
To see detail of the bull market from 2009 to the all time high on weekly charts, click here.
New updates to this analysis are in bold.
BEAR ELLIOTT WAVE COUNT
WEEKLY CHART
This bear wave count fits better than the bull with the even larger picture, super cycle analysis found here. It is also well supported by regular technical analysis at the monthly chart level.
Importantly, there is no lower invalidation point for this wave count. That means there is no lower limit to this bear market.
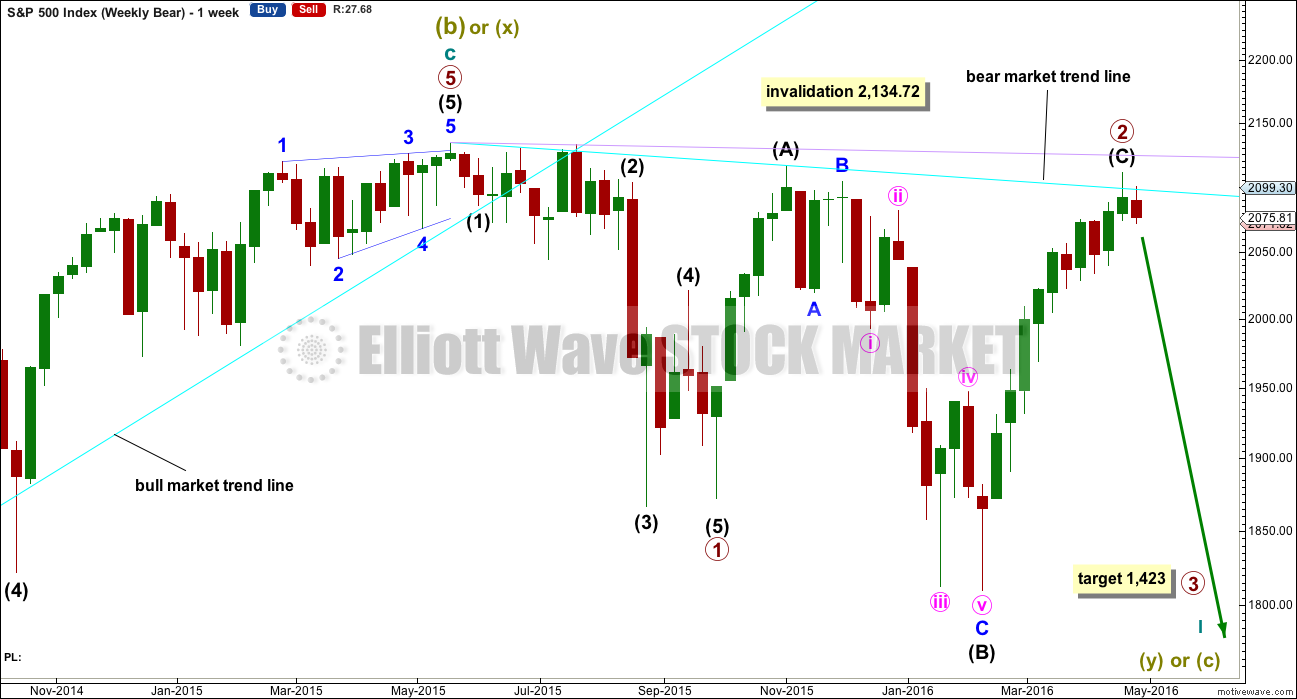
Primary wave 1 is complete and lasted 19 weeks. Primary wave 2 is either over lasting 28 weeks, or it may continue for another one or two weeks.
The long upper shadow on last week’s green weekly candlestick is bearish. If tomorrow, the last session for this week, can manage to close below 2,078.83, then this weekly candlestick would complete a bearish engulfing candlestick pattern. This is the strongest reversal pattern.
Primary wave 2 may be complete as a rare running flat. Just prior to a strong primary degree third wave is the kind of situation in which a running flat may appear. Within primary wave 2, intermediate wave (A) was a deep zigzag (which will also subdivide as a double zigzag). Intermediate wave (B) fits perfectly as a zigzag and is a 1.21 length of intermediate wave (A). This is within the normal range for a B wave of a flat of 1 to 1.38.
It is still possible as this week draws to an end that primary wave 2 could yet continue higher. The probability has been reduced today but not eliminated. If it does, then intermediate wave (C) should end above 2,116.48 to avoid a truncation. Primary wave 2 would then be a very common expanded flat.
If price moves above 2,116.48, then the alternate bear wave count would be invalidated. At that stage, if there is no new alternate for the bear, then this would be the only bear wave count.
Primary wave 2 may not move beyond the start of primary wave 1 above 2,134.72.
DAILY CHART
Intermediate wave (A) fits as a single or double zigzag.
Intermediate wave (B) fits perfectly as a zigzag. There is no Fibonacci ratio between minor waves A and C.
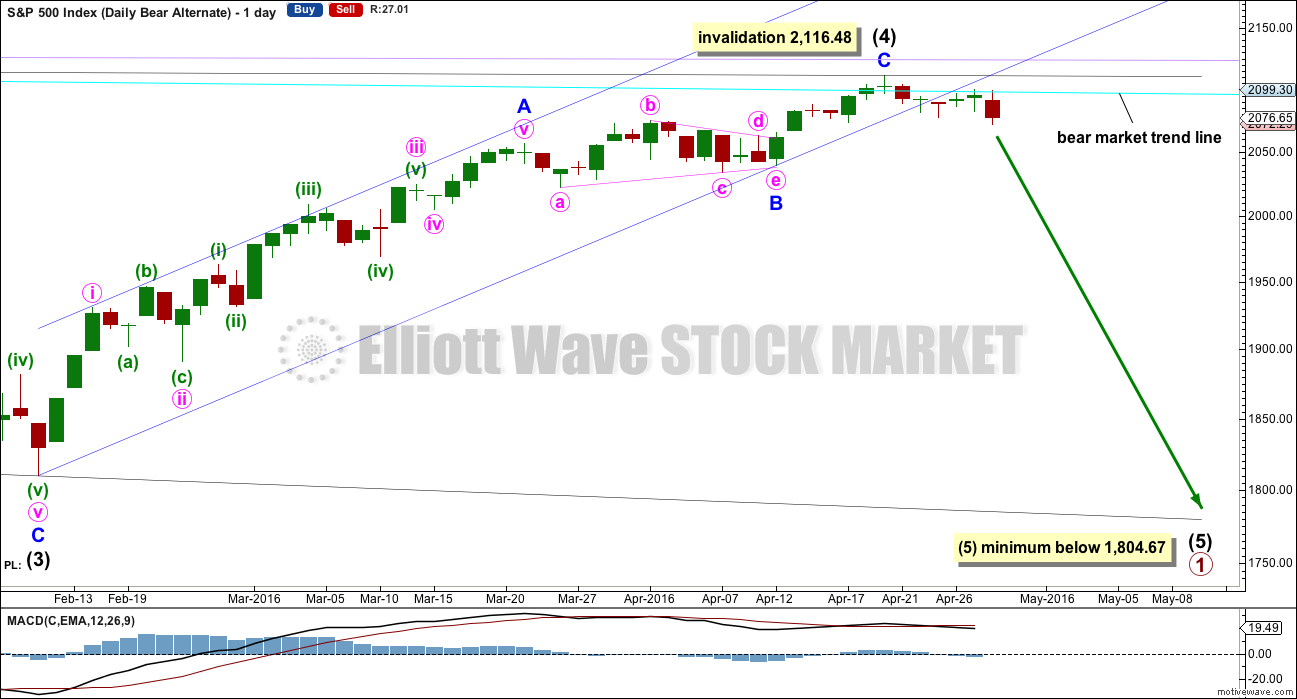
Intermediate wave (C) must subdivide as a five wave structure. It may be a complete impulse.
If intermediate wave (C) is over, then the truncation is small at only 5.43 points. This may occur right before a very strong third wave pulls the end of intermediate wave (C) downwards. Confirmation is required with a new low below 2,039.74.
The next wave down for this wave count would be a strong third wave at primary wave degree. At 1,423 primary wave 3 would reach 2.618 the length of primary wave 1. This is the appropriate ratio for this target because primary wave 2 is very deep at 0.91 of primary wave 1.
Redraw the channel about the impulse of intermediate wave (C) using Elliott’s second technique: draw the first trend line from the ends of the second to fourth waves at minor degree, then place a parallel copy on the end of minor wave 3. Minor wave 5 may end midway within the channel. The channel is now breached decisively at the hourly chart level. At the daily chart level, today’s candlestick still has its upper wick just crossing above the lower trend line. One more downwards day fully below the trend line would provide better channel confirmation of a trend change. That may come tomorrow.
Because expanded flats do not fit nicely within trend channels, a channel about their C waves may be used to indicate when the expanded flat is over. After a breach of the lower edge of the channel, if price then exhibits a typical throwback to the trend line, then it may offer a perfect opportunity to join primary wave 3 down. At this stage, it looks like this may not happen, but if it does then take the opportunity to enter short on the throwback.
Within minor wave 5, no second wave correction may move beyond the start of its first wave below 2,039.74. A new low below 2,039.74 could not be a second wave correction within minor wave 5, so at that stage minor wave 5 would have to be over. This would confirm a trend change.
Primary wave 1 lasted 98 days (not a Fibonacci number). Primary wave 2 may have lasted 140 days.
HOURLY CHART
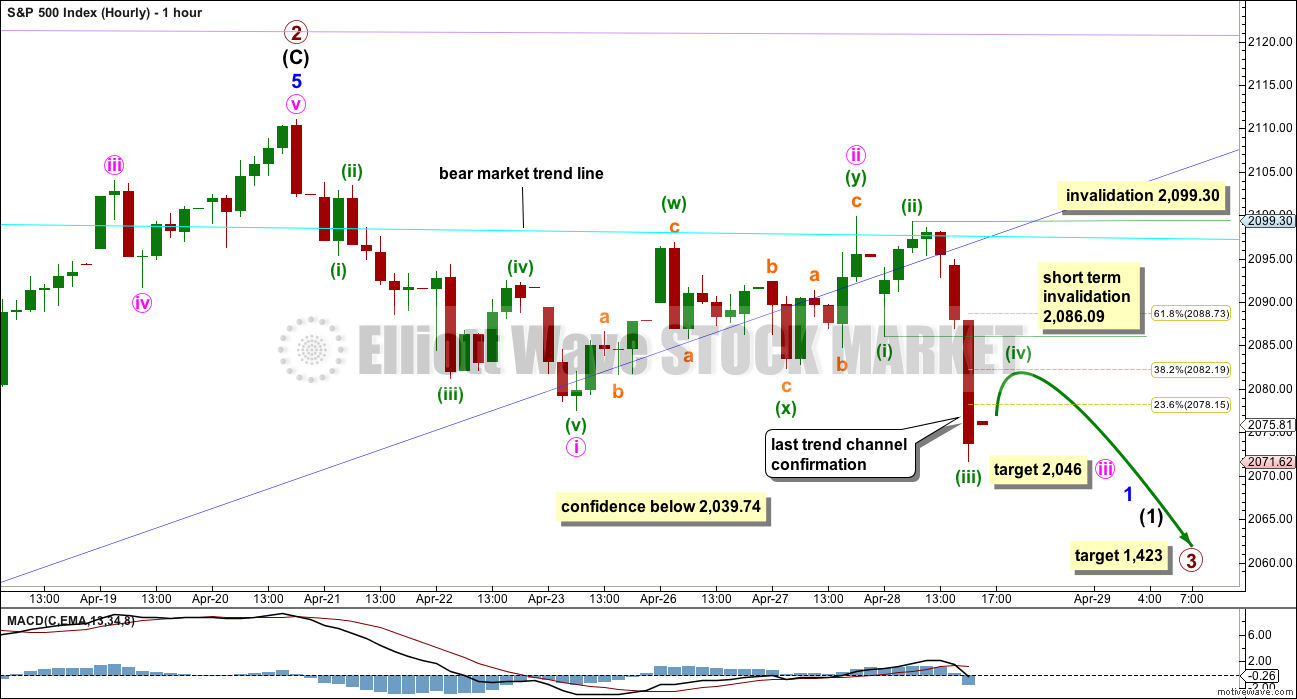
Minute wave ii is now a complete double zigzag. Minute wave iii downwards looks like it has begun.
This is all within just minor wave 1. When minor wave 1 is a complete impulse, then minor wave 2 should move higher. It may come back up for a throwback of the support line although it may not be able to get that high.
Alternatively, the degree of labelling on the hourly chart may have to be moved up one degree when the impulse down is complete. It depends on how low it goes.
At 2,046 minute wave iii would reach 1.618 the length of minute wave i.
Within minute wave iii, minuette wave (ii) was a very deep 0.96 zigzag. Minuette wave (iii) has no Fibonacci ratio to minuette wave (i). Minuette wave (iv) should be expected to be a shallow sideways correction, most likely ending about the 0.382 Fibonacci ratio at 2,082. It may not move into minuette wave (i) price territory above 2,086.09.
Alternatively, the downwards wave to end Thursday’s session may also be another first wave. The degree of labelling of it may be moved down one, so it could be just subminuette wave i within minuette wave (iii). If that is the case, then the following correction for subminuette wave ii would most likely reach up to the 0.618 Fibonacci ratio at 2,089. It may not move beyond the start of subminuette wave i at 2,099.30.
If price moves above 2,086.09 during the next session, then it would not be a fourth wave correction and instead would be another second wave correction. That would favour this main wave count over the alternate below.
ALTERNATE HOURLY CHART
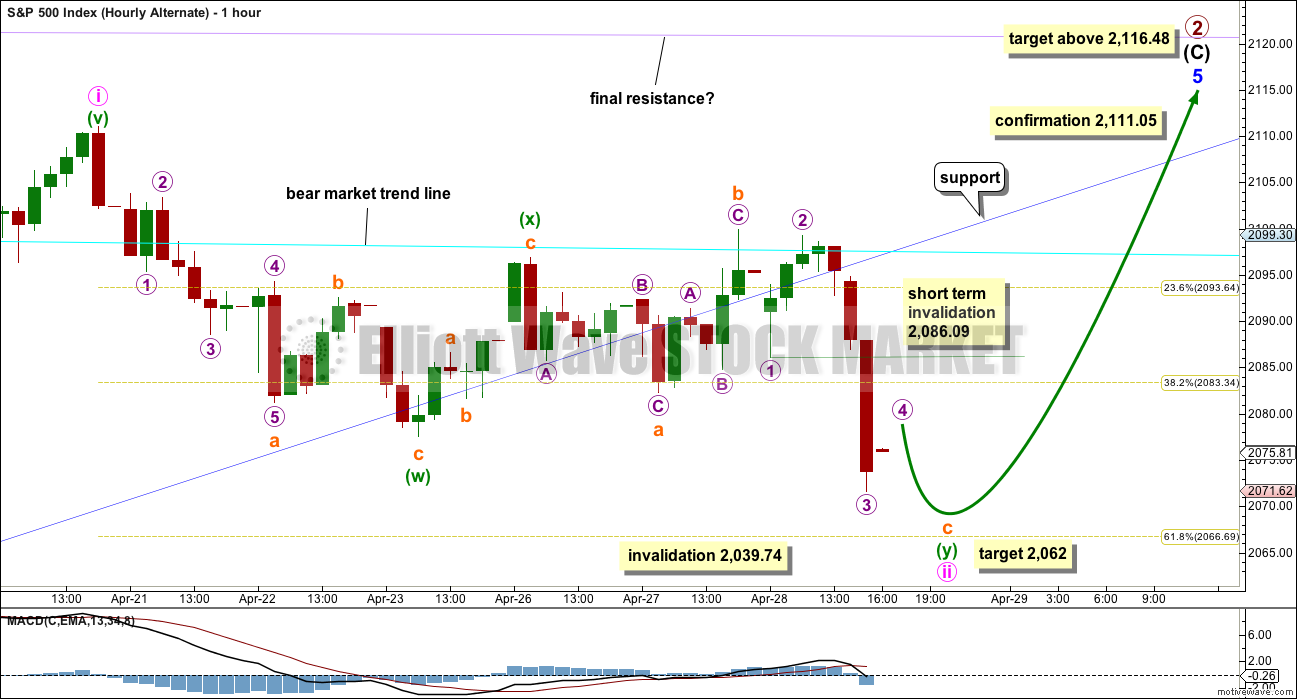
It is still possible that primary wave 2 may not be complete. Intermediate wave (C) may yet be able to move above 2,116.48 to avoid a truncation and a rare running flat.
The degree of labelling within minor wave 5 is moved down one degree. The upwards wave to the last high may be only minute wave i within minor wave 5.
Minute wave ii may not move beyond the start of minute wave i below 2,039.74.
Minute wave ii is seen here as a double combination, but it no longer looks right. The second structure in the double is technically an expanded flat, which is okay. But it is deepening the correction, giving the whole structure of minute wave ii a downwards slope where it should be just sideways.
The first structure in the double labelled minuette wave (w) is a zigzag. The double is joined by a three, a simple zigzag in the opposite direction labelled minuette wave (x).
The second structure is an expanded flat labelled minuette wave (y). Both of subminuette waves a and b subdivide as threes, as they must for a flat. Subminuette wave b is a 1.21 length of subminuette wave a. This is over the requirement of 1.05 for an expanded flat, and within normal range of 1 to 1.38 for a B wave within a flat.
Subminuette wave c has passed 1.618 the length of subminuette wave a. At 2,062 it would reach 2.618 the length of subminuette wave a.
Subminuette wave c must subdivide as a five wave structure. It is unfolding as an impulse. Within the impulse, micro wave 4 may not move into micro wave 1 price territory above 2,086.09.
If price moves above 2,086.09 short term, before any new low, then it could not be a fourth wave correction within the impulse. For this alternate, to see upwards movement then as another second wave correction would see subminuette wave c as too long in duration and requiring a much lower end. That would see minute wave ii with a very clear downwards slope. The probability of this wave count would substantially decrease with these problems of Elliott wave structure.
This wave count requires a new high above 2,111.05 for confirmation.
ALTERNATE WEEKLY CHART
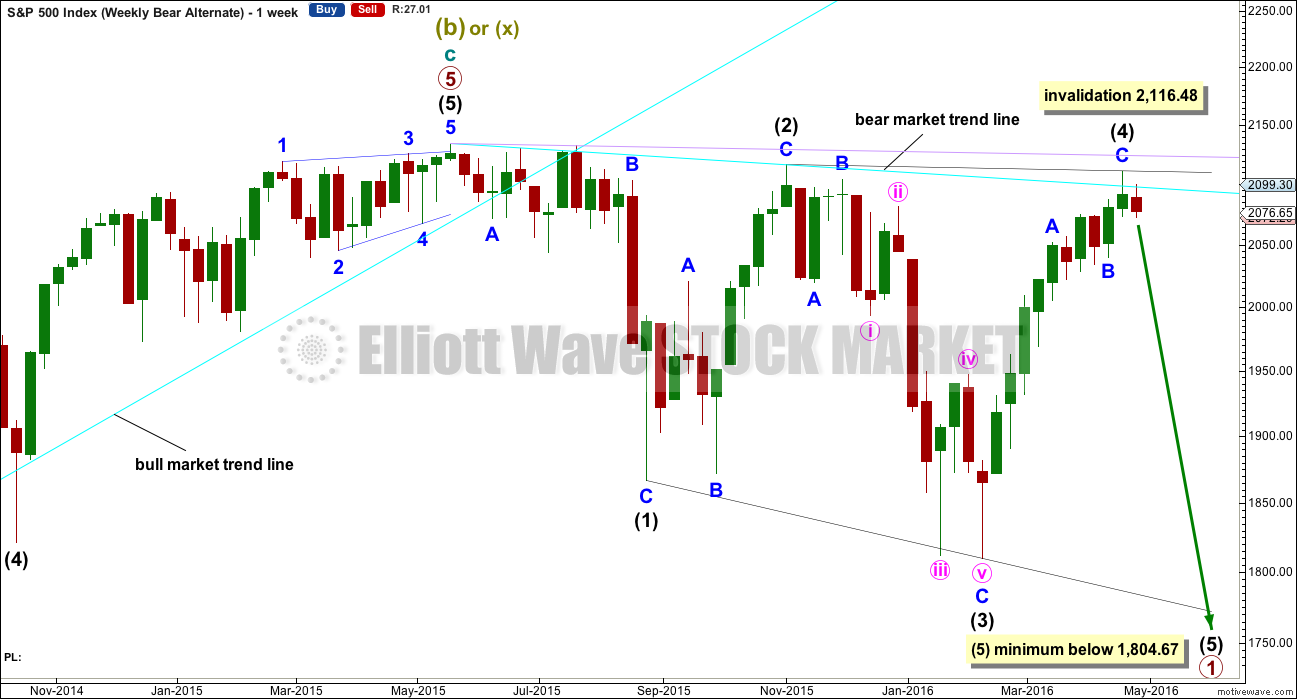
Primary wave 1 may subdivide as one of two possible structures. The main bear count sees it as a complete impulse. This alternate sees it as an incomplete leading diagonal.
The diagonal must be expanding because intermediate wave (3) is longer than intermediate wave (1). Leading expanding diagonals are not common structures, so that reduces the probability of this wave count to an alternate.
Intermediate wave (4) may continue higher now and may find resistance at the bear market trend line.
ALTERNATE DAILY CHART
Within a leading diagonal, subwaves 2 and 4 must subdivide as zigzags. Subwaves 1, 3 and 5 are most commonly zigzags but may also sometimes appear to be impulses.
Intermediate wave (3) down fits best as a zigzag.
In a diagonal the fourth wave must overlap first wave price territory. The rule for the end of a fourth wave is it may not move beyond the end of the second wave.
Within diagonals the second and fourth waves are commonly between 0.66 to 0.81 the prior wave. Here, intermediate wave (2) is 0.93 of intermediate wave (1) and intermediate wave (4) is 0.98 of intermediate wave (3). This is possible, but the probability of this wave count is further reduced due to the depth of these waves.
Expanding diagonals are not very common. Leading expanding diagonals are less common.
Intermediate wave (5) must be longer than intermediate wave (3), so it must end below 1,804.67. Confirmation of the end of the upwards trend for intermediate wave (4) would still be required before confidence may be had in a trend change, in the same way as that for the main bear wave count.
BULL ELLIOTT WAVE COUNT
WEEKLY CHART
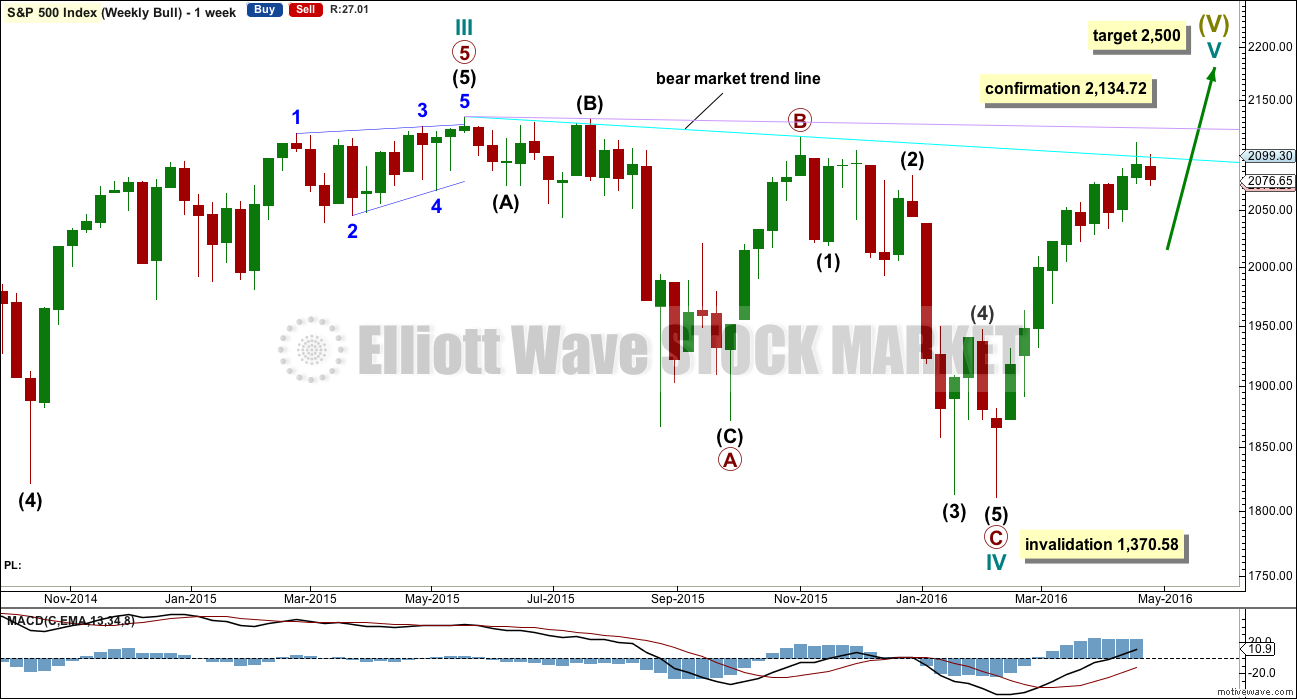
Cycle wave II was a shallow 0.41 zigzag lasting three months. Cycle wave IV may be a complete shallow 0.19 regular flat correction, exhibiting some alternation with cycle wave II.
At 2,500 cycle wave V would reach equality in length with cycle wave I.
Price remains below the final bear market trend line. This line is drawn from the all time high at 2,134.72 to the swing high labelled primary wave B at 2,116.48 on November 2015. This line is drawn using the approach outlined by Magee in the classic “Technical Analysis of Stock Trends”. To use it correctly we should assume that a bear market remains intact until this line is breached by a close of 3% or more of market value. In practice, that price point would be a new all time high which would invalidate any bear wave count.
This wave count requires price confirmation with a new all time high above 2,134.72.
While price has not made a new high, while it remains below the final bear market trend line and while technical indicators point to weakness in upwards movement, this very bullish wave count comes with a strong caveat. I still do not have confidence in it.
DAILY CHART
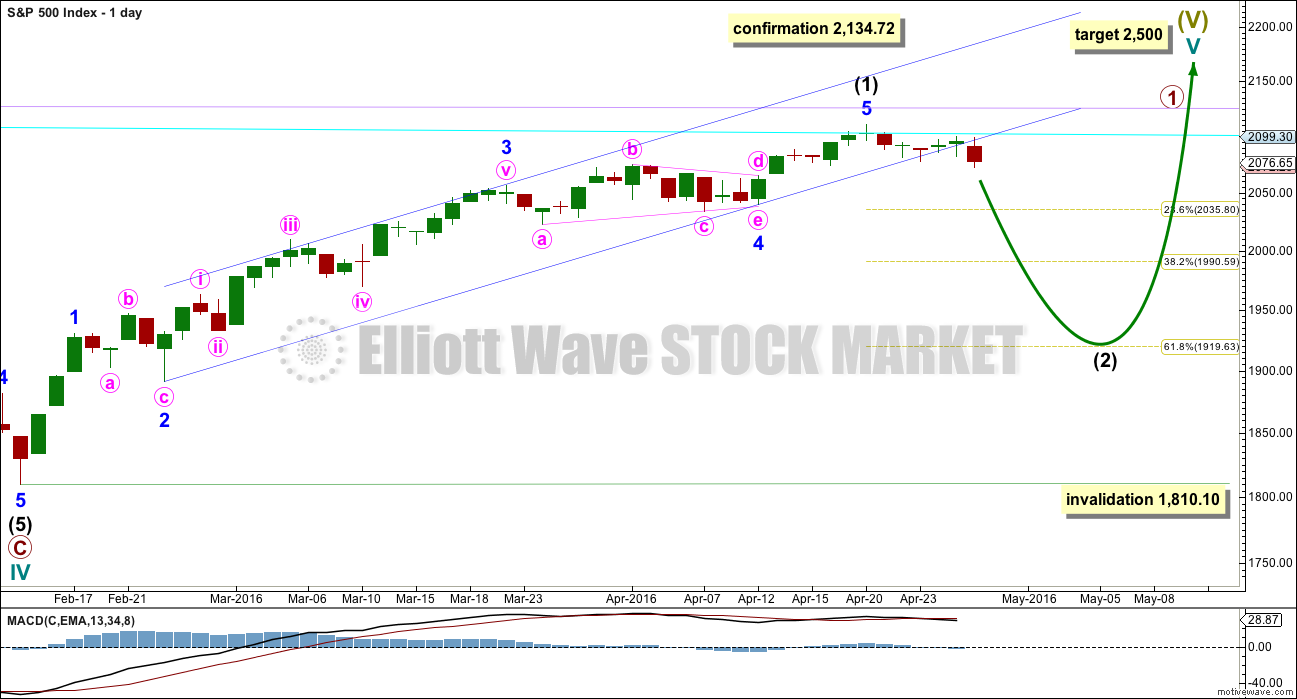
Intermediate wave (2) is seen as an atypical double zigzag. It is atypical in that it moves sideways. Double zigzags should have a clear slope against the prior trend to have the right look. Within a double zigzag, the second zigzag exists to deepen the correction when the first zigzag does not move price deep enough. Not only does this second zigzag not deepen the correction, it fails to move at all beyond the end of the first zigzag. This structure technically meets rules, but it looks completely wrong. This gives the wave count a low probability.
If the bull market has resumed, it must begin with a five wave structure upwards at the daily and weekly chart level. That may today be complete. The possible trend change at intermediate degree still requires confirmation in the same way as the alternate hourly bear wave count outlines before any confidence may be had in it.
If intermediate wave (2) begins here, then a reasonable target for it to end would be the 0.618 Fibonacci ratio of intermediate wave (1) about 1,920. Intermediate wave (2) must subdivide as a corrective structure. It may not move beyond the start of intermediate wave (1) below 1,810.10.
In the long term, this wave count absolutely requires a new high above 2,134.72 for confirmation. This would be the only wave count in the unlikely event of a new all time high. All bear wave counts would be fully and finally invalidated.
TECHNICAL ANALYSIS
DAILY CHART
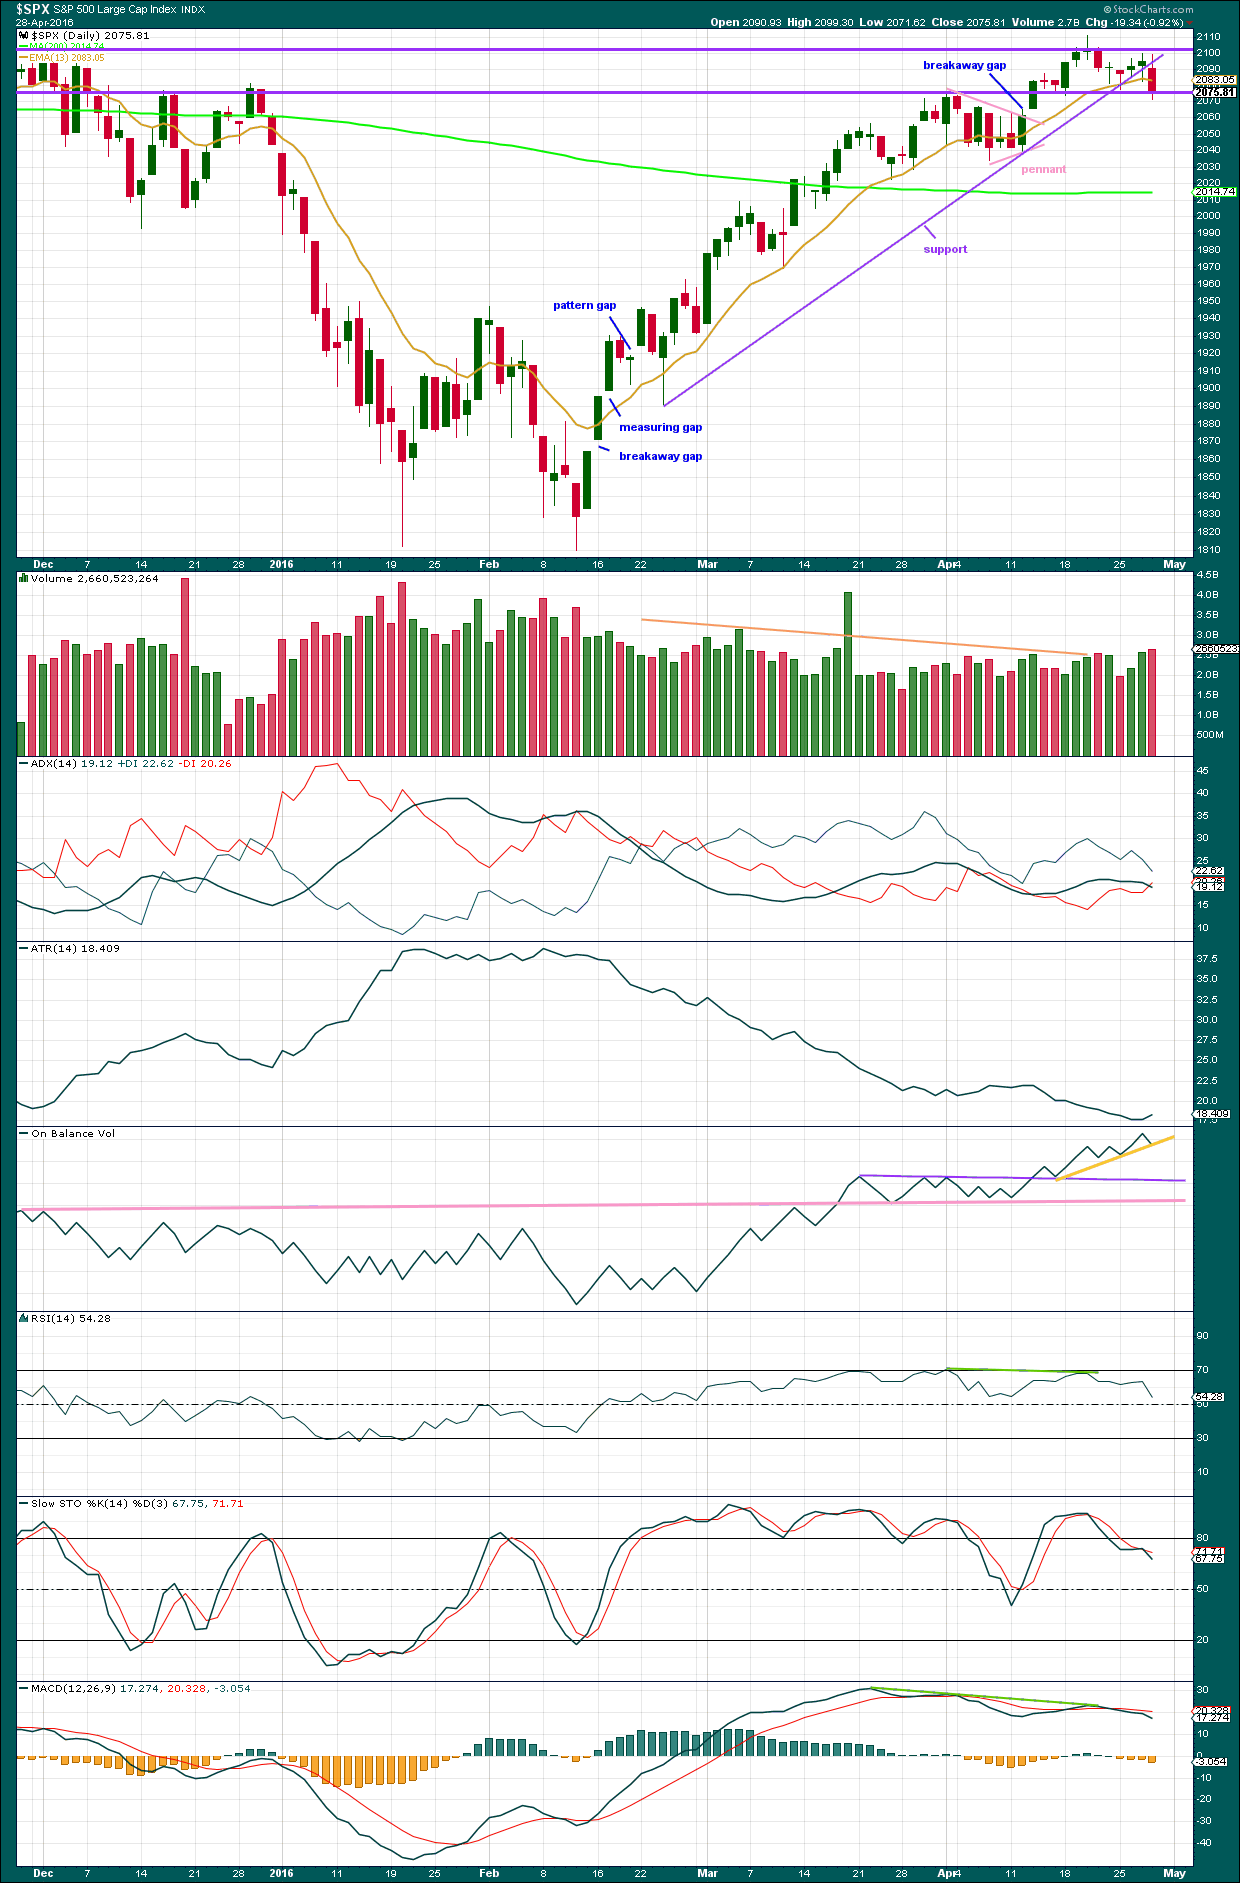
Click chart to enlarge. Chart courtesy of StockCharts.com.
Volume data on StockCharts is different to that given from NYSE, the home of this index. Comments on volume will be based on NYSE volume data when it differs from StockCharts.
The line in the sand for a trend change is the upwards sloping purple support line. This is the same as the lower edge of the blue channel on the main daily Elliott wave count. A breach of this bull market trend line would indicate the trend (at least short to mid term) has changed from bull to bear. Now that price has broken below the support line, it should find resistance there. While today’s candlestick has a real body fully below the lower line, the upper wick is crossing above the line. One more downwards day would constitute a clearer breach. A breach is a full daily candlestick below the line and not touching it. Pobability of a trend change increases today.
An Evening Doji Star candlestick pattern is completed at the last high. This is a reversal pattern and offers some support for expecting a high is in place. The fact that this pattern has occurred at the round number of 2,100 is more significant. There is light volume on the first candle in the pattern and heavier volume on the third candle in the pattern. This increases the probability of a reversal.
Strong downwards movement at the end of today’s session away from the support line and away from the 2,100 resistance line indicates a trend change is most likely.
Volume today is slightly stronger than yesterday. There was support for downwards movement. Although the increase in only small, it does not have to be big for a bearish outlook to be favoured when price falls on increasing volume. The market can fall of its own weight; it does not require an increase in sellers for price to fall because an absence of buyers will achieve the same outcome.
On Balance Volume has still not given any bearish signal. It is finding support today at the weak yellow line. A break below this line would be a weak bearish signal. A move up from here by OBV would be a weak bullish signal. What would be a stronger signal would be a break below the purple or pink lines because they are longer held and more often tested, particularly the pink line. A break below either would be a strong bearish signal.
ADX is today declining, indicating the market is not yet trending (but this is a lagging indicator). If a downwards trend is developing, then first the +DX line must cross below the -DX line. That has not happened yet; ADX has not indicated a trend change.
ATR may beginning to turn up. After a long period of declining, ATR should be expected to again show an increase. It is important to note that ATR declined while price moved higher for over 40 days. This is not normal for a trending market. There was something wrong with that wave up. If it was a bear market rally and not a new bull market, then declining ATR makes more sense.
RSI has some slight divergence with price to the last high (green line). RSI has failed to make corresponding highs as price has made new highs. This indicates weakness in price.
MACD shows divergence with price (green line) back to 22nd March. With reasonably long held divergence, this indicates momentum up to the high is weak.
INVERTED VIX DAILY CHART
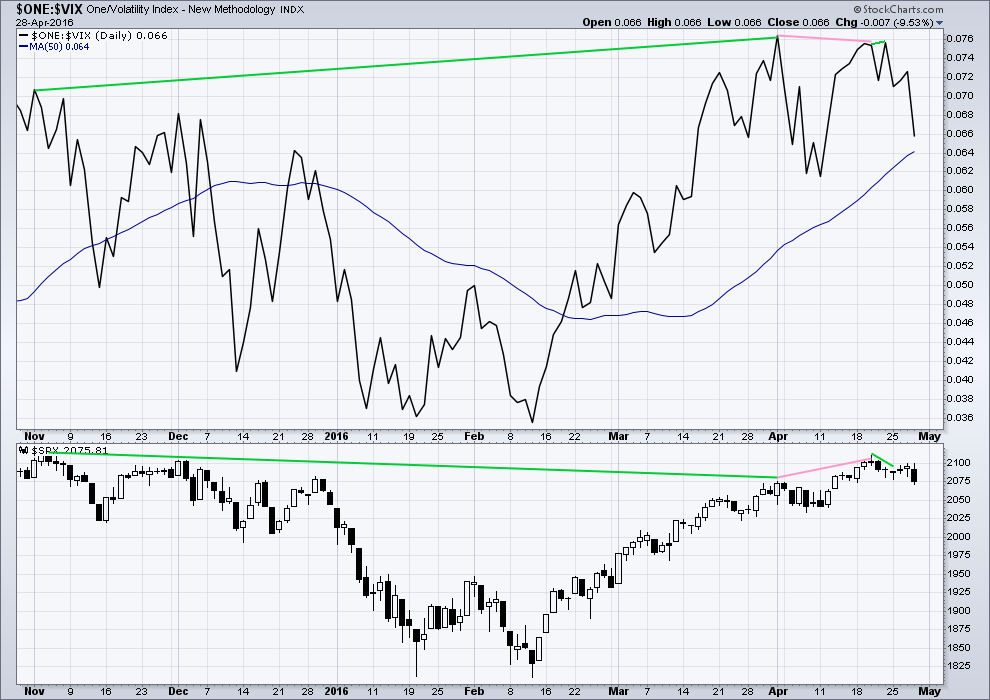
Click chart to enlarge. Chart courtesy of StockCharts.com.
Volatility declines as inverted VIX climbs. This is normal for an upwards trend.
What is not normal here is the divergence over a reasonable time period between price and inverted VIX (green lines). The decline in volatility is not translating to a corresponding increase in price. Price is weak. This divergence is bearish.
Price made a new short term high, but VIX has failed to make a corresponding high (pink lines). This is regular bearish divergence. It indicates further weakness in the trend.
22nd April’s small green doji candlestick overall saw sideways movement in price, closing very slightly up for the day. Yet inverted VIX has made new highs above the prior high of 20th of April. Volatility declined for 22nd April, but this was not translated into a corresponding rise in price. Again, further indication of weakness in price is indicated. This is further hidden bearish divergence.
BULLISH PERCENT DAILY CHART
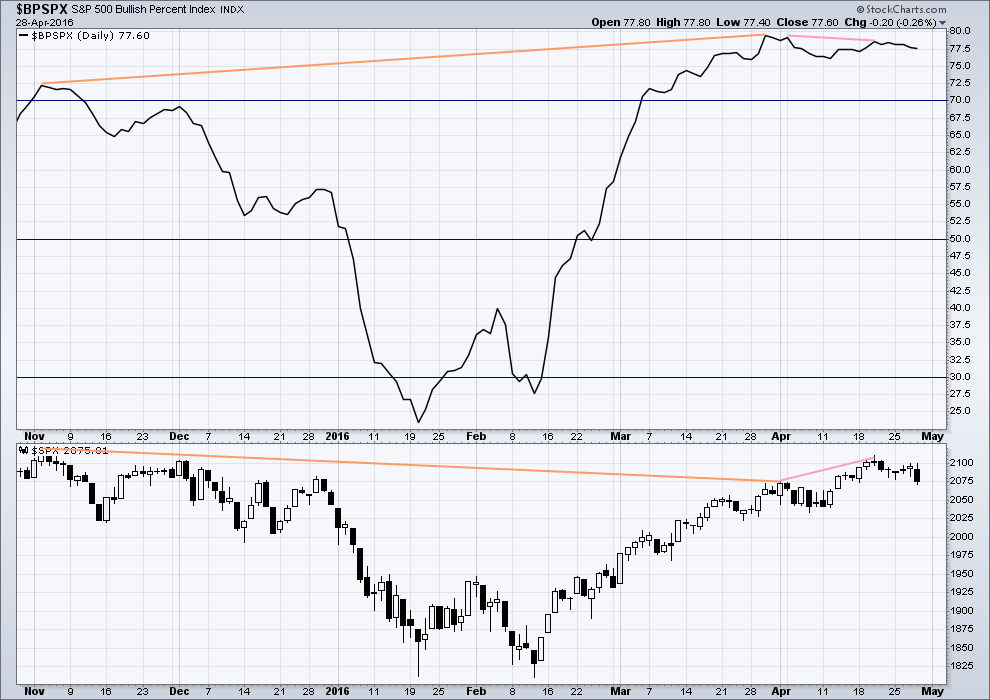
Click chart to enlarge. Chart courtesy of StockCharts.com.
With this indicator measuring the percentage of bullish equities within the index, it is a measurement of breadth and not sentiment as the name suggests.
There is strong hidden bearish divergence between price and the Bullish Percent Index (orange lines). The increase in the percentage of bullish equities is more substantial than the last high in price. As bullish percent increases, it is not translating to a corresponding rise in price. Price is weak.
As price made a new short term high on 20th April, BP did not (pink lines). This is regular bearish divergence. It indicates underlying weakness to the upwards trend.
ADVANCE DECLINE LINE
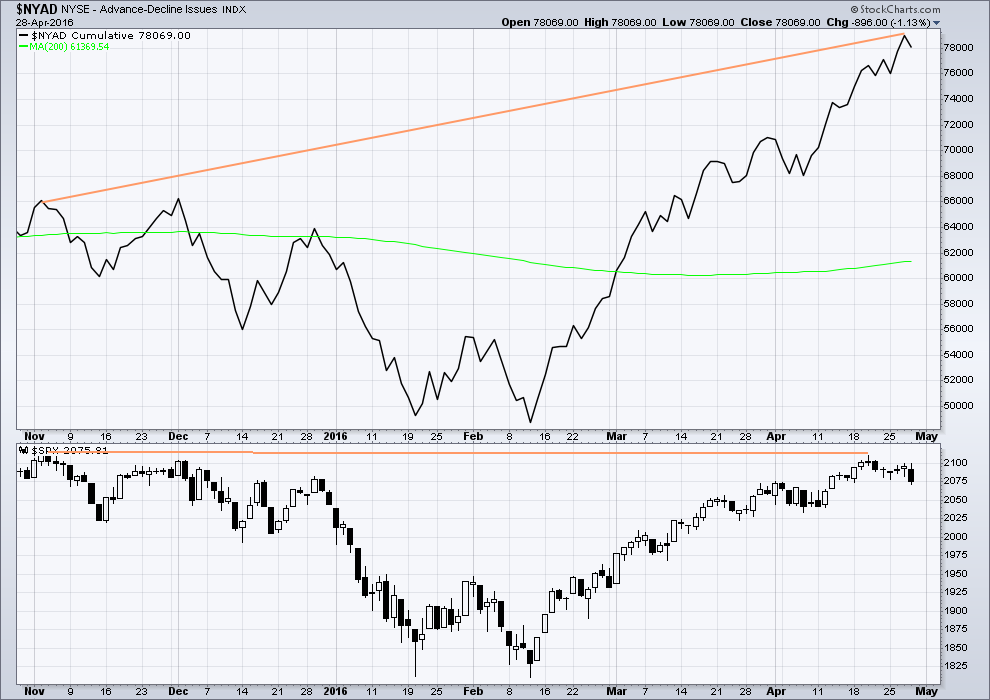
Click chart to enlarge. Chart courtesy of StockCharts.com.
With the AD line increasing, this indicates the number of advancing stocks exceeds the number of declining stocks. This indicates that there is breadth to this upwards movement.
From November 2015 to now, the AD line is making new highs while price has so far failed to make a corresponding new high. This indicates weakness in price; the increase in market breadth is unable to be translated to increase in price.
It remains to be seen if price can make new highs beyond the prior highs of 3rd November, 2015. If price can manage to do that, then this hidden bearish divergence will no longer be correct, but the fact that it is so strong at this stage is significant. The AD line will be watched daily to see if this bearish divergence continues or disappears.
The 200 day moving average for the AD line is now increasing. This alone is not enough to indicate a new bull market. During November 2015 the 200 day MA for the AD line turned upwards and yet price still made subsequent new lows.
COMMITMENT OF TRADERS (COT)

Click chart to enlarge. Chart courtesy of Qandl.
This first COT chart shows commercials. Commercial traders are more often on the right side of the market. Currently, more commercials are short the S&P than long. This supports a bearish Elliott wave count, but it may also support the bullish Elliott wave count which would be expecting a big second wave correction to come soon. Either way points to a likely end to this upwards trend sooner rather than later. Unfortunately, it does not tell exactly when upwards movement must end.
*Note: these COT figures are for futures only markets. This is not the same as the cash market I am analysing, but it is closely related enough to be highly relevant.

Click chart to enlarge. Chart courtesy of Qandl.
Non commercials are more often on the wrong side of the market than the right side of the market. Currently, non commercials are predominantly long, and increasing. This supports the expectation of a trend change soon.
DOW THEORY
I am choosing to use the S&P500, Dow Industrials, Dow Transportation, Nasdaq and the Russell 2000 index. Major swing lows are noted below. So far the Industrials, Transportation and Russell 2000 have made new major swing lows. None of these indices have made new highs.
I am aware that this approach is extremely conservative. Original Dow Theory has already confirmed a major trend change as both the industrials and transportation indexes have made new major lows.
At this stage, if the S&P500 and Nasdaq also make new major swing lows, then my modified Dow Theory would confirm a major new bear market. At that stage, my only wave count would be the bear wave count.
The lows below are from October 2014. These lows were the last secondary correction within the primary trend which was the bull market from 2009.
These lows must be breached by a daily close below each point.
S&P500: 1,821.61
Nasdaq: 4,117.84
DJIA: 15,855.12 – close below on 25th August 2015.
DJT: 7,700.49 – close below on 24th August 2015.
Russell 2000: 1,343.51 – close below on 25th August 2015.
To the upside, DJIA has made a new major swing high above its prior major high of 3rd November, 2015, at 17,977.85. But DJT has so far failed to confirm because it has not yet made a new major swing high above its prior swing high of 20th November, 2015, at 8,358.20. Dow Theory has therefore not yet confirmed a new bull market. Neither the S&P500, Russell 2000 nor Nasdaq have made new major swing highs.
This analysis is published @ 06:18 p.m. EST.


Just noticed this, we have a spinning top candlestick for the month of April. From Stockchart’s “Introduction to Candlesticks”
“The small real body (whether hollow or filled) shows little movement from open to close, and the shadows indicate that both bulls and bears were active during the session. Even though the session opened and closed with little change, prices moved significantly higher and lower in the meantime. Neither buyers nor sellers could gain the upper hand and the result was a standoff. After a long advance or long white candlestick, a spinning top indicates weakness among the bulls and a potential change or interruption in trend. ”
For another example of a spinning top see the November 2015 candle and its aftermath.
So we have candlestick top reversal patterns,
Daily – Evening Doji Star
Weekly – Bearish Engulfing Patters
Monthly – Spinning Top
This is not only rare (imo) but highly significant (imo).
I am going to pull another Joe Namath, “The top is in, I guarantee it!”
Well. Well. Well. I guess that bear I saw in the wilderness last year did, in fact, stowaway in my vehicle as I returned from the mountains this past week. He hitched a ride and per Lara’s instruction, went right to Wall Street USA. Arriving there yesterday he has shown his fangs. The claws will rip flesh into shreds.
You know as I right this I am thinking, I sure hope I never get mauled by a real bear during one of my trips. I bring bear spray (most effective without any lasting impact on the bear) and my trusty dog, Hunter.
We laugh around here about the idea of bear bells. They are ineffective at warning bears. Do you know how to tell Rocky Mountain grizzly bear scat from black bear scat? Grizzly bear scat has bells in it!
Maybe I should check sometime to see if it has bull’s balls as well. Pardon my sometime coarse nature.
That is really too funny!
How about bull “jewels”?
Or perhaps bull “huevos”?
Or even, bull “cojonitos”? 🙂
Now I know they have gone stark raving mad over at the “other guys”….even after today’s price action, they are still showing an intermediate one up completed from the Feb 11 lows!!
What exactly are they smokin’ over there??!!
Oh well…at least they will have their subscribers looking in the right direction short term…maybe time to get rid of that subscription and get Lara’s Gold service….! 🙂
Correction; they are actually saying it is minor 1 of intermediate five…, not as optimistic, but still strange methinks… 🙂
They also acknowledge that May “could possibly” be a high….Ya think??!!! 😀
Okay, so this is a bit of a weird one.
Ghostbusters, the original was released in mid 1984. Three years before the 1987 stock market crash.
It’s just been redone and released this year, 2016.
Its a pretty silly comedy really. Typical happy fare, at a market peak. And the original was a world wide hit.
This may just be another indicator of a big top in the market now?
However, I’m aware that the 1987 crash was short lived in the USA.
Here in NZ it was absolutely huge. It has still turned off most NZers from investing in the stock market, which is partly why like a bunch of lemmings they’ve all piled into the property market.
(although what they don’t realise is they’ve all actually piled back into the stock markets via KiwiSaver)
Really great stuff – great week , some very nice direction this week – you provide a fantastic service – thank you Lara
You’re welcome. Yes, a Super Happy week for all here.
Hi Lara:
This kind of upper BB penetration usually heralds a meaningful correction. It will be interesting to see what the yellow metal does next. I have seen a few cases where equities on fire will post several of these outside the BB. I think I will be holding my short for the time being. Thanks for the heads up and have a great week-end! 🙂
Is that GDX?
Interesting. I don’t use Bollinger Bands at higher time frames.
Thanks for the tip Verne. I’ll spend some time taking a look as behaviour over the last year for this on a daily chart.
GLD.
Closed.
And we have our weekly bearish engulfing candlestick pattern everybody. Very nice.
Engulfing patterns are the strongest reversal patterns. To see one at the weekly level is strong, to see it occurring at a round number 2,100 is stronger. To see the first candlestick with lighter volume than the second… stronger still.
This adds significant confidence to a trend change now. Even before 2,039 is passed.
I’ll be working now to find an entry for a short for members next week who may be still waiting.
When minor 1 down is complete then minor 2 up should unfold. That will be the entry point.
Alternatively, this small fourth wave correction for minute iv may also be a reasonable entry point. There is a risk the position could go underwater for minor 2, but balance that with the risk that minor 2 may be brief and shallow and you might miss it.
I’ll be looking into that more in end of week analysis to try and give some clear guidance.
Marvellous! 🙂 🙂 🙂
Let’s hope that if the majority of people are still bullish then they can push minor wave 2 up for a nice short entry! I would hate to miss the ride down!
They will, assisted by the banksters no doubt…
Sorry, forgot to add a chart. THE most important bit really.
Forgot to add the channel: from minute i to minute iii, copy on minute ii. Add a mid line.
Minute iv in this case may find resistance at the mid line.
I think you have it right on! Would the target for minute v to be v=i ?
If so and minute iv is over that would take us below 2039 on this first leg down. Then we have another confidence booster and a big one at that.
Combine that with the weekly, yes weekly, bearish engulfing pattern and we have ‘mucho’ confirmations or an intermediate trend change to bearish within a primary bearish trend. That is a great place to be if you are on the right side.
There is no Fibonacci ratio between minute waves i and iii.
And so it is more likely that minute v will exhibit a Fibonacci ratio to either i or iii.
Equality with i at 33.53 points in length is the most likely. Thereafter 1.618 X minute i at 54.25 points in length is the next likely.
So yes, that is pretty likely to give us the price confirmation we seek. And more confidence in the wave count.
Yay! Happy days!
What kind of happy dance was that you did not so long ago? When we break 2039 I want to do the same. So I need to practice up.
LOL
I did do it again this morning actually. It’s just silly waving of arms, laughing and jumping about.
I now have three good entry points: S&P, FTSE and Gold. So the Happy Morning Dance was good 🙂
I don’t mind laughing at myself, so maybe one day Cesar can video it for the amusement of all
oooo! You’ve wet the appetite now. I’m e-mailing Cesar right now. The happy dance is one for which I don’t need lessons — but it never hurts to check out someone elses moves, lol. Glad you’re dancing.
Good morning everybody.
I can see minute iii complete now at todays low. This upwards candlestick on the hourly looks like the start of minute iv.
Target 0.382 Fibonacci ratio of minute iii at 2,070. Invalidation point lower end of minute i at 2,077.52.
Minute ii was a deep 0.68 double zigzag. Minute iv may be a quick shallow single zigzag . Or it may be a shallow flat, combination or triangle. It may show on the daily chart.
Lot of capital being spent to buy the market into the weekend.
Are we in a fourth wave?
I am not sure. But this last 30 minute buying is concerning. We really need to close in the red today. I want to see that weekly Bearish Engulfing pattern Lara pointed out. If we close up / green it is not good for the bearish case.
But we certainly could be in a 4th with one more leg down to start Monday.
My invalidation point for this small fourth wave is just slightly below the open of last week.
Last week’s open: 2,078.83
Today’s invalidation point: 2,077.52.
So although yes, I’m seeing a small fourth wave correction, it should still remain below the real body of last week’s candlestick.
Looks like we’ll have our bearish engulfing pattern at the weekly chart level 🙂
I would not worry. The move up will lull a few more folk to sleep. I think we will see the impulse completed on Monday and a great chance to re-load on minor two up. Today a good example of the importance of scalping these impulsive moves. UVXY saying this party just getting started. Have a great week-end everybody!
Rats! Another duplicate post- sorry about that folk. My computer keeps playing tricks on me with these edits…I’m calling 911…!! 🙂
Ghostbusters.
May be a better bet?
Where’s Bill Murray when you need him??!! 🙂
I would not worry. Fourth wave up will lull a few more folk to sleep. I expect we will see a strong spike down to finish minor one on Monday then a brisk run-up for minor two. That will be the sweet spot for backing up the truck for final short positions. Today a good example of the importance of scalping the impulsive moves down.
Position traders need not be concerned imo; UVXY saying this party is just getting started. Have a great week-end everybdy; see ya in the trenches on Monday GW… 🙂
Is this the classic blow off top?
SPX shorts closing before the weekend?
I am curious about the point at which we see short covering beging on UVXY shorts, as opposed to folk scrambling to actually buy downside protection. Nothing so far indicates that the crowd thinks this is another buy the dip opportunity. One feature that distinguishes the two will be a real gap open; I am talking 5% or more…
I am convinced hardly anyone is expecting a primary degree decline is unfolding…
Acceleration
All volatility indicators – VIX, VXX, UVXY, TVIX all says we are going lower…
I assume you mean the SPX and other markets going lower.
Yep…!
Looks like impulse down complete, corrective bounce underway. Maybe a good set up to get short for the conservative on this corrective bounce. Is this is P3 fourth wave area of around 2070 should cap the corrective move up…
It’s nice to be back doing some proper trading, and making a bit of money.
Couldn’t bring myself to trade that upwards move other than shorting at key levels, though if this is the ‘big one’ it has started pretty slow so maybe I missed out (I expected it to kick off with a huge gap and gonner).
Still all seems a bit too easy for my liking – price will soon tell the tale.
UVXY steadily pointing North. It really should start tanking ahead of a meaningful retrace….
It has issued a second buy signal today in the last two weeks with yet another second green close after a new 52 week low, again one of the green candles coming on the same day it made a new 52 week low…I have never seen it do that…
RSI has broken below 50 on the following major averages:
DJIA
DJTA
SPX
NASDAQ
This is bearish. We now need NYA and RUT to follow suit.
This is a great time of day for a sell off… 11:30AM to Noon. Haven’t had one in a long time. That I can remember.
AN acceleration down now from this point (2054.15) would be very encouraging. Before noon that is.
Volume is slightly higher at this time vs yesterday at this time.
New Daily Low for every index so far today.
I did it! I am now officially ‘in the money’. TVIX @ 3.97 = 0.02 profit.
Yah hoo!
That’s great
The semiconductors (SMH) have broken down big time today, which is interesting in that they are one of the segments that usually lead the market. I’m hoping for a pop back up to the neckline to get in short. Its so weak that I may not get it.
Thomas,
Did you read the article from Google stating PC and such devices will be gone from main stream in 5 years?
I am told by a friend that many more debt defaults will occur over the next two months which will bring attention to the issue and many other defaults will occur over the following 6 months++
Things are coming to head.
Puerto Rico is getting ready to send a shock wave through the bond universe. This is a story that for some reason is being totally ignored by the media. Those juicy 9% yield bond principals infesting so many hedge and pension funds are going to zero and setting up nicely to usher in a third of a third wave down at primary degree…
They always keep the municipal bond defaults quiet and out of the media. PR debt is basically municipal bond debt.
It’s like the media took a pledge not to report on any of this or the risk of any of this.
They is so much of this world wide… let the cleansing begin!
Corrective bounce started. 38.2% retracement of the current wave down (from 2099 at 11:40 AM yesterday to 2060 low this morning) is roughly 2075. that puts us in the 4th wave one degree lower. From there I suspect the downward move will resume the final wave of this first move down. Target would be about 5=3 at 2037. Now that would be nice to see today.
Perhaps this is all wishful thinking.
For a bigger picture view, take a look at how the weekly and daily charts will look at the end of today using candle sticks. Although not yet completed for today, they are shaping up nicely. I think you can use candle stick analysis to help determine the EW counts a bit for both the weekly and daily. Hopefully, they will tell a convincing story in the patterns as well.
It’s a thing of beauty. Isn’t it?
Yes it is and to make the story the strongest beautiful picture… lets hope for a close today near the lows of the day.
Rodney,
A big sell off into the weekend will setup for a very interesting Monday action as panic will get into investors holding long positions.
Yesterday we got an full hourly candle below and not touching the channel lower trendline. Today we get the daily candle fully below and not touching the trendline. I suspect next week (early) we will get the price confirmation at 2039. That will push us to the 200 day moving average which is roughly at 2015. It should bounce there for a bit.
After this impulse is done price will be telling (I think we are still in (an extended) W3, poss just starting W4). If we get a proven 3 wave move up after we have had a clear impulse down, then the market is going down as the more bullish (bear) expects an impulse up after this move down.
Just gotta be careful about leading diagonals – they have fooled me into thinking an impulse is corrective on more than one occasion.
I think you are right about that extension…
A bit of a gap up in UVXY but no real fear in evidence yet….there will be…! 🙂
I will be back at break even essentially with house money as soon as we hit 20.
At that point I will sell shares and load up on near dated options in preparation for the 10X trade to the upside…. lock and load!
Not quite yet…! 🙂
Selling remaining QID calls. MMs are being really stingy…
Sold another 10% UVXY. Now at 30%.
FWIW I think I’m wrong but will let price prove it.
I aim to scale to 0 by 2039
Div on 2min RSI – looks like we might bounce soon. If it is sizeable and 3 waves I might do a bit of UVXY scalping between here and 2039 🙂
As soon as we go below 2039 I’ll be loading 100%. I realise my trading method is a bit strange but it works for me 😉
Sounds good to me! 🙂
Leaves my mind boggling! I prefer to stick with the simple Elliott Waves (which are hard enough!)
Looks like we completed an impulse down this morning….
I am thinking the downward waves will be showing extensions of at least one wave per completed five wave impulse. In addition, if the worm has turned, we can again expect surprises to be to the downside and targets to not be low enough.
At this very moment, 6 cents from break even. Then is is dollars for every penny. I chose a highly leveraged instrument for this round of trading because we may very well experience the big elusive wave down. If that is the case, I have a home run. I have swung for the fences on this deal. I’ve hit the ball. It is up, up ….. Let’s see if it gets out of here.
I expect the first meaningful correction not to take place until we are in the mid 1900’s. I’ll be unloading some or all of the wagons there. Have a great day.
I learned a lot about trading options when I was a member of Bryan Bottarelli’s trading group. The options market is like a wild raging sea filled with voracious sharks in the form of colluding market makers who often gang up to ambush retail traders and investors, and trading bots running on sophisticated algos designed to strip mine the positions of individual, and sometimes even institutional (remember the front-running HFT trading exposed by Michael Lewis?) investors. I know not everyone here is trading options but one thing I learned is not to leave profits sitting in the market.
I know it’s nice to look at all those green numbers in your trading account but that’s not why you are trading; it’s to make a profit, and it’s not really a profit until you take it.
Options profits can vaporise as quickly, and sometimes faster than they appear.
I always pull the trigger on a double so you end up trading with house money.
In fast moving market a 50% is plenty.
Another thing I learned from Bryan is that you can sometimes move the market when you are part of a trading group. We would execute orders on in-the-money options close to expiration and watch the market makers on the other side of the trade scramble to buy the shares just in case we all decided to excercise our in the money calls; especially if we felt the MMs were trying to screw us on the bids. Of course as they bought shares the options would explode to the upside allowing us to cash out nicely! This is something that individual traders cannot do and it was really fun to see how Bryan would target shady MMs with great effectiveness.
Anyway I’m rambling so have a great trading day everybody!
Thank you Vern for sharing your experience. I am one of the individual investors who learned just how difficult it is to hold onto your money when trading options. I made a lot of money and then lost it all, twice. I do not trade options today because of the time expiration factor. I so often picked the swing points but the timing was off.
In any event, thanks again for sharing from your vast experience.
Anytime my friend. I hear ya on those less than joyous trading memories. I question whether one is a bona fide trader if you don’t have a few of those scars. Fortunately for many of us, we learned from our mistakes and perhaps can occasionally share that with others…
Lara,
why does my SPX500 chart – attached – look so different to yours? I know you use the cash. But mine is from FXCM. I don’t think they do a cash. Do you know if they do?
Many thanks.
That’s futures.
And it includes after hours movement. My broker is the same.
It will be interesting to see what the US and global futures do tonight. AMZN and FB had good earnings and moved up strong AH’s…
Let’s see if markets can shrug this “good news” as it has shrugged off “bad news” for the past 10 weeks…
Thanks to Lara’s exquisitely timed mid day update, I loaded up on UVXY 15 calls (June expiration) at average of 2.58 right before it took off… Last time I checked the bid at close it was 3.40 🙂 🙂 🙂
We’ll see about the gap and go vs. a correction on a huge up move …
Ari,
FB was up all day but that still did not stop NASDAQ to drop, earnings reaction is always a gamble as you don’t know how much is baked in by the smart money.
Waiting and watching from side for trend confirmation.
Vern – NUGT rocked higher yet again..
Yep. The metals have really been on a tear. I would wager that they are now excellent candidates for a short-term (two or three weeks )trade to the downside. Sentiment now as extreme as it has been from some time.
I think you are right, Verne, but I’m expecting a final wave 5 on some of the miners I follow. When gold does come back down it will be one of the best calls of a lifetime. All indications are that the inflation trade is back on, and it will be a ride!
Really? I’m seeing an upwards breakout on Gold in the next day or so. On Balance Volume has given a strong bullish signal. I’ve just entered long.
It did a very surprisingly shallow second wave correction, but the subdivisions are all complete as a double combination: zigzag – x – triangle, which just completed yesterday.
The proportion of the second wave correction is good.
Sentiment notwithstanding Lara, I would definitely defer to your expertise on this one. The metals just seem to be going up, and up, and up….! Perhaps I shall join you on that long trade via by favorite miner FNV…. 🙂
It looks like they are in that fifth wave up today. It is amazing what a run they have had this year. Wow! Go GORO! 🙂
Nikkie 225 down over 3.5% at the open. Again.
Will it spill over to US? Don’t know yet. Hope so.
The above comment is incorrect. I am guessing the Japanese markets are closed and what I saw was yesterday’s cash close. Sorry for any confusion.
For any interested, I just posted a comment on yesterday’s forum. It is not short. Comments always encouraged and welcomed. Now I am going to read Lara’s analysis and expect it will be great as always.
Nice post on yesterday’s comments. I’m in a similar boat with UVXY. Boy you gotta run with any profits these things give you, as others have mentioned many times here. The thing I’ve noticed is that their value erodes a lot during upward corrections, unless market is in a downturn continuously. But a very nice and much needed pop today…
Best of luck!
I’ll repeat here what I wrote there–Personally I don’t like UVXY or TVIX for anything but the shortest trades because the decay is so substantial. When you buy options on them on top of it, as some people are doing, the premium only adds to the headwinds against you.
I don’t even trade SPY or the leveraged ETFs much–just once in a while when a particularly good opportunity comes along. I find it works better to use Lara’s work to understand where the market spirits are going and then trade the individual equities and targeted ETFs that are moving in that direction faster than most. I also trade against the market, but only in those sectors that are moving in the opposite direction. Some of my trading is with options, so I do get premium decay, but I’m careful with my entry and exit plans and keep them for a minimum of time.
As far as Kenny Rogers–right on!!
BTW – I only trade UVXY shares!!!
I dont touch options – others do but they know their game.
I’m far from being a newbie – but I wouldn’t go anywhere near options – especially UVXY options.
I will one day absorb how verne does his jigery pokery trades and the like 🙂 🙂
I wasn’t talking about you Olga! (LOL) I was actually talking about myself in part–I do sometimes trade UVXY options–but I was just warning about the pitfalls and the current we are swimming against when we do.
You definitely have to be a guerilla warrior to trade options with any kind of consistency. It really is all-out war with those instruments and the key is to strike early and often. Sitting in option trades (except leaps) is a 90% chance of being a looser on the trade…
Put all chips on the table when UVXY hits 14 with a sell order at 50. Forget the market. Go fishing, surfing or a bottle of rum in South Pacific for six months. Log on and collect winnings.
A bottle, as in 1, of rum would never last me six months.
I think the first move up toward the upper BB is going to be a bit under 50 as the new 52 week went so low. It may be the top of intermediate two of P3 will not have it move back to a new low but even if it does, that is going to be the real money trade on UVXY…
For Lara or other EW experts: Lara states, “If price moves above 2,086.09 short term, before any new low, then it could not be a fourth wave correction within the impulse.” Is that based on a fib ratio – what are the metrics used to measure this? The reason I ask is I have never been able to figure out when to view another (nested) 1-2 unless it overlaps.
Never mind, I see now that 2086 is where wave 4 would overlap wave 1.