A very small range day to produce a small green doji sees both hourly Elliott wave counts remain valid.
Price is squeezed between two trend lines.
Summary: The possibility of new highs will remain while price remains above the support line / lower edge of the Elliott channel on the daily chart and above 2,039.74. A breach of the support line would indicate a trend change from bull to bear and that a third wave down would then be most likely. A new high above 2,111.05 would indicate a little more upwards movement for a few days to end above 2,116.48 but not above 2,134.72. Price is squeezed between the bear market trend line and the lower support line. These lines converge in the next few hours, so a large movement may occur when price breaks out. A downwards breakout looks more likely.
To see last published monthly charts click here.
To see how each of the bull and bear wave counts fit within a larger time frame see the Grand Supercycle Analysis.
To see detail of the bull market from 2009 to the all time high on weekly charts, click here.
New updates to this analysis are in bold.
BEAR ELLIOTT WAVE COUNT
WEEKLY CHART
This bear wave count fits better than the bull with the even larger picture, super cycle analysis found here. It is also well supported by regular technical analysis at the monthly chart level.
Importantly, there is no lower invalidation point for this wave count. That means there is no lower limit to this bear market.
Primary wave 1 is complete and lasted 19 weeks. Primary wave 2 is either over lasting 28 weeks, or it may continue for another one or two weeks.
The long upper shadow on last week’s green weekly candlestick is bearish.
Primary wave 2 may be unfolding as an expanded or running flat. Within primary wave 2, intermediate wave (A) was a deep zigzag (which will also subdivide as a double zigzag). Intermediate wave (B) fits perfectly as a zigzag and is a 1.21 length of intermediate wave (A). This is within the normal range for a B wave of a flat of 1 to 1.38.
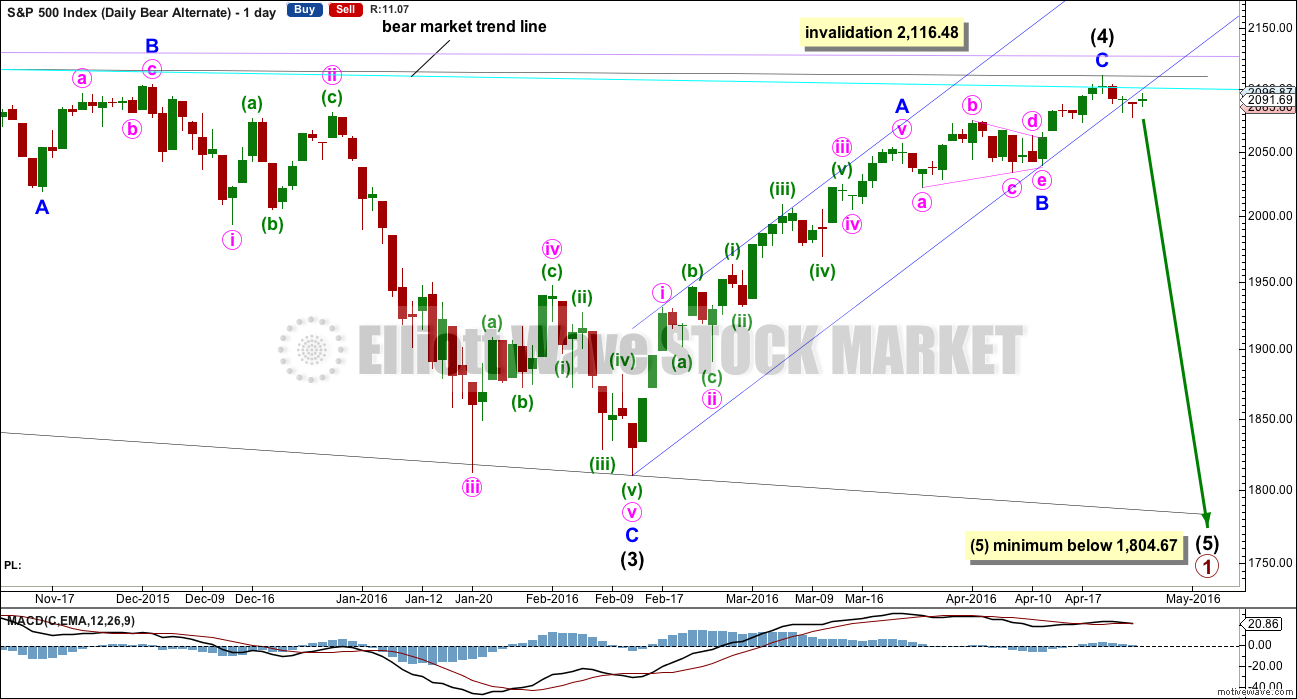
Intermediate wave (C) is likely to make at least a slight new high above the end of intermediate wave (A) at 2,116.48 to avoid a truncation and a very rare running flat. However, price may find very strong resistance at the final bear market trend line. This line may hold price down and it may not be able to avoid a truncation. A rare running flat may occur before a very strong third wave down. That looks possible today. The whole structure is now complete down to the five minute chart level. The hourly alternate looks at this possibility that intermediate (C) is over today and truncated by 5.43 points. The truncation is small and acceptable.
If price moves above 2,116.48, then the alternate bear wave count would be invalidated. At that stage, if there is no new alternate for the bear, then this would be the only bear wave count.
Primary wave 2 may not move beyond the start of primary wave 1 above 2,134.72.
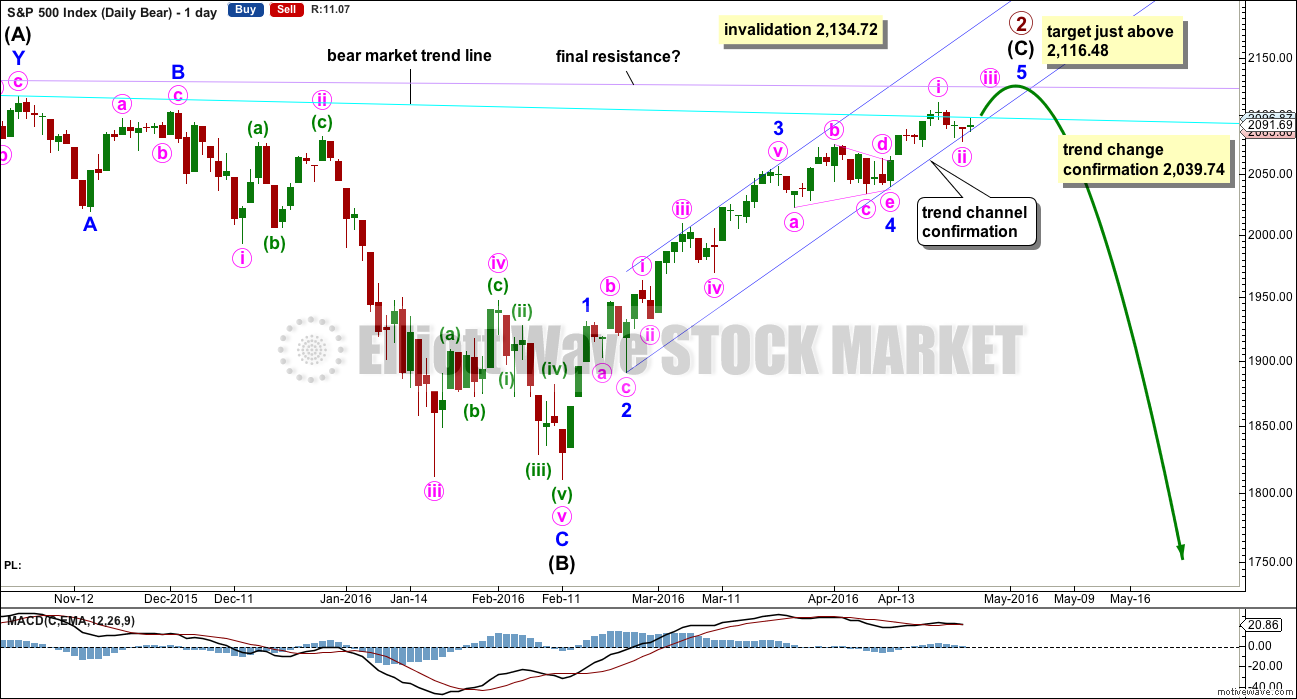
DAILY CHART
Intermediate wave (A) fits as a single or double zigzag.
Intermediate wave (B) fits perfectly as a zigzag. There is no Fibonacci ratio between minor waves A and C.
Intermediate wave (C) must subdivide as a five wave structure. It is unfolding as an impulse.
Intermediate wave (C) does not have to move above the end of intermediate wave (A) at 2,116.48, but it is likely to do so to avoid a truncation. If intermediate wave (C) is over, then the truncation is small at only 5.43 points. This may occur right before a very strong third wave pulls the end of intermediate wave (C) downwards. However, it is unconfirmed today although this is possible. Confirmation is required.
The next wave down for this wave count would be a strong third wave at primary wave degree.
The target is for intermediate wave (C) to end just above the end of intermediate wave (A) at 2,116.48, so that a truncation is avoided.
Redraw the channel about the impulse of intermediate wave (C) using Elliott’s second technique: draw the first trend line from the ends of the second to fourth waves at minor degree, then place a parallel copy on the end of minor wave 3. Minor wave 5 may end midway within the channel. When this channel is breached by downwards movement, that will be the earliest indication of a possible end to primary wave 2. If upwards movement is over, then the channel should be breached this week.
Price today is squeezed between the cyan bear market trend line and the lower edge of the blue channel, which is the same as the support line. These lines converge very soon. When price can break out of this squeeze, then it may begin to accelerate.
Because expanded flats do not fit nicely within trend channels, a channel about their C waves may be used to indicate when the expanded flat is over. After a breach of the lower edge of the channel, if price then exhibits a typical throwback to the trend line, then it may offer a perfect opportunity to join primary wave 3 down. This does not always happen, so if it does in this case take the opportunity.
Within minor wave 5, no second wave correction may move beyond the start of its first wave below 2,039.74. A new low below 2,039.74 could not be a second wave correction within minor wave 5, so at that stage minor wave 5 would have to be over. This would confirm a trend change.
Primary wave 1 lasted 98 days (not a Fibonacci number). So far primary wave 2 has lasted 144 days. Up to two either side of 144 would be close enough for a Fibonacci relationship in terms of duration.
Price may find final resistance and end upwards movement when it comes to touch the lilac trend line.
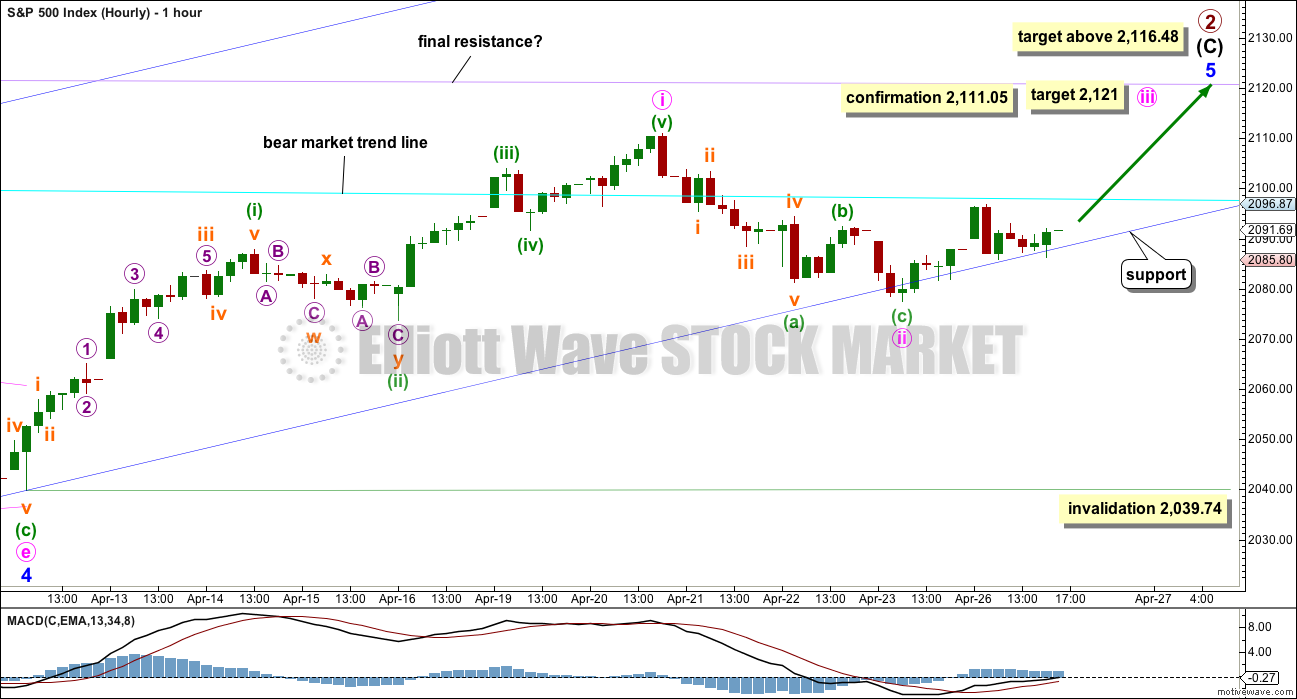
HOURLY CHART
Within minor wave 5, minute wave i may be a complete impulse. Minute wave ii may now be a complete zigzag finding support at the lower edge of the Elliott channel.
If this wave count is correct, then price should make a new high above 2,111.05. Minute wave iii must move above the end of minute wave i and it should show some increase in upwards momentum.
At 2,121 minute wave iii would reach 0.618 the length of minute wave i.
The small amount of upwards movement within minute wave iii so far does not fit well as an impulse on the hourly or five minute charts. This does not support this wave count.
When minute waves iii and iv are complete, then a final target may be calculated. That cannot be done yet.
If minute wave ii continues any lower, it may now move beyond the start of minute wave i below 2,039.74.
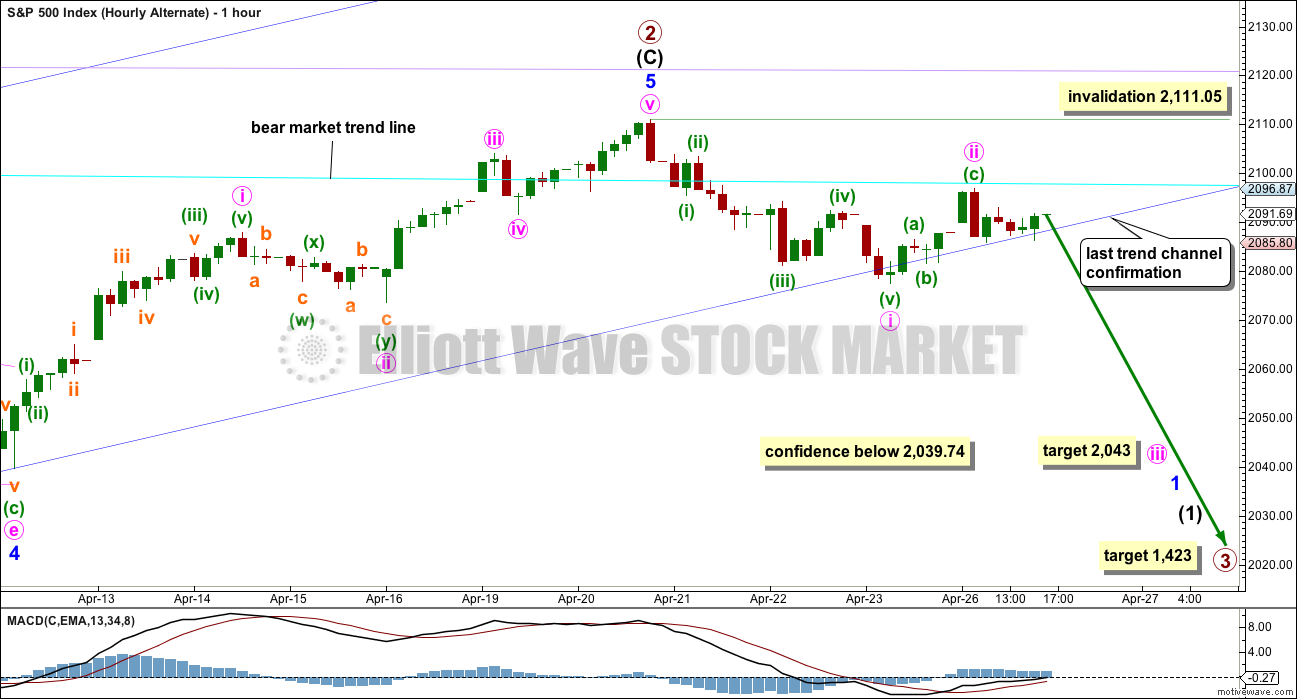
ALTERNATE HOURLY CHART
The entire structure of primary wave 2 may now be complete. This alternate wave count absolutely requires some confirmation before any confidence may be had in it.
Ratios within intermediate wave (C) would be: minor wave 3 has no Fibonacci ratio to minor wave 1, and minor wave 5 (if it is over) would be 3.21 points short of 0.618 the length of minor wave 1.
Ratios within minor wave 5 would be: minute wave iii would be just 0.67 points longer than 0.618 the length of minute wave i, and minute wave v would be just 0.59 points longer than 0.618 the length of minute wave iii and just 1 point longer than 0.382 the length of minute wave i.
Minute wave i may have ended at the lower edge of the blue channel. I have checked the subdivisions on the five minute chart for this movement and it does fit, although it does not look clear on the hourly chart. So far minute wave ii fits as a zigzag and is 0.58 the depth of minute wave i.
A clear and strong breach of the dark blue channel would provide further confidence in a trend change. If that happens, then reasonable confidence may be had in this wave count, enough to use the lower edge of the blue channel as an entry point. If price throws back to find resistance at the blue channel after breaching it, that would be a low risk high reward opportunity to enter short. The risk would be at 2,111.05 or for the more adventurous trader at 2,134.72.
Finally, a new low below 2,039.74 would provide reasonable confidence in a trend change. The only question at that stage would be of what degree?
At 2,043 minute wave iii would reach 1.618 the length of minute wave i. This target may be met next week, depending on how time consuming the second and fourth wave corrections within the impulse of minute wave iii may be.
If primary wave 2 is over, then the target for primary wave 3 would be 2.618 the length of primary wave 1 at 1,423. That is the appropriate Fibonacci ratio to use when the second wave correction is so very deep, and here primary wave 2 would be 0.91 the length of primary wave 1.
Primary wave 1 lasted 98 days (not a Fibonacci number). Primary wave 2 may have lasted 140 days (four short of a Fibonacci 144). Primary wave 3 may be quick, but it still would have two sizeable corrections for intermediate waves (2) and (4) within it. An initial expectation may be for it to total a Fibonacci 144 or 233 days.
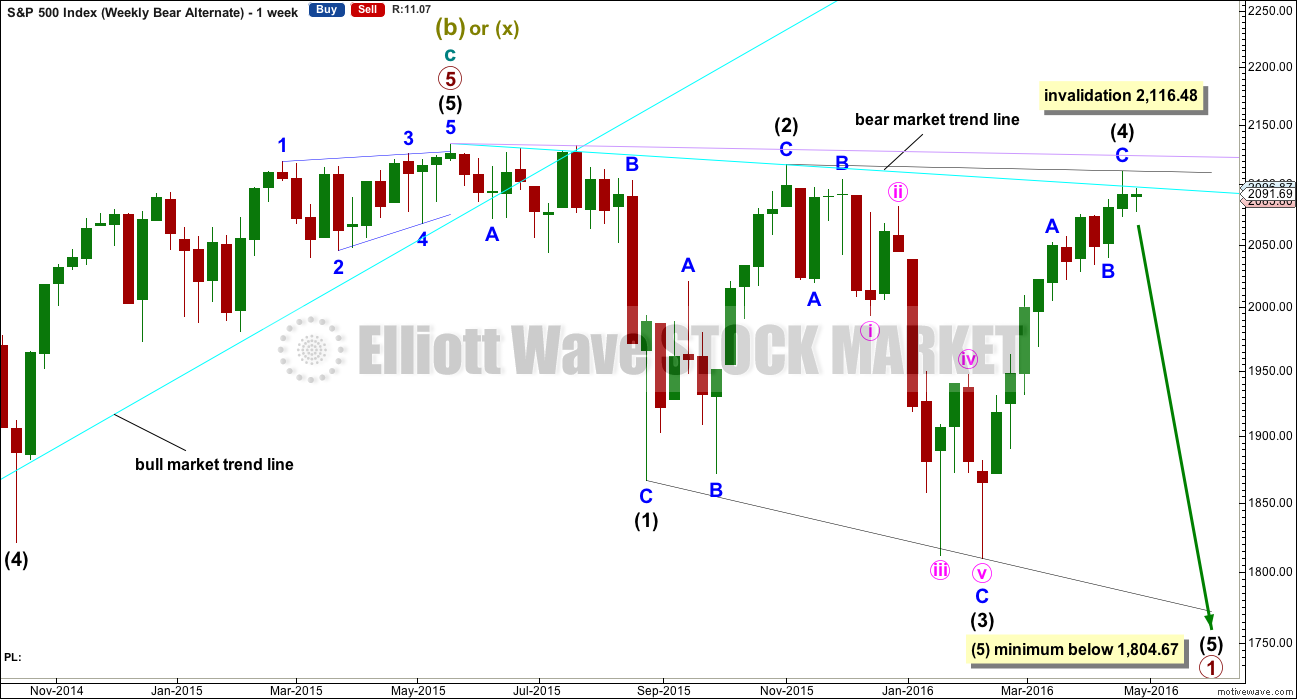
ALTERNATE WEEKLY CHART
Primary wave 1 may subdivide as one of two possible structures. The main bear count sees it as a complete impulse. This alternate sees it as an incomplete leading diagonal.
The diagonal must be expanding because intermediate wave (3) is longer than intermediate wave (1). Leading expanding diagonals are not common structures, so that reduces the probability of this wave count to an alternate.
Intermediate wave (4) may continue higher now and may find resistance at the bear market trend line.
ALTERNATE DAILY CHART
Within a leading diagonal, subwaves 2 and 4 must subdivide as zigzags. Subwaves 1, 3 and 5 are most commonly zigzags but may also sometimes appear to be impulses.
Intermediate wave (3) down fits best as a zigzag.
In a diagonal the fourth wave must overlap first wave price territory. The rule for the end of a fourth wave is it may not move beyond the end of the second wave.
Within diagonals the second and fourth waves are commonly between 0.66 to 0.81 the prior wave. Here, intermediate wave (2) is 0.93 of intermediate wave (1) and intermediate wave (4) is 0.98 of intermediate wave (3). This is possible, but the probability of this wave count is further reduced due to the depth of these waves.
Expanding diagonals are not very common. Leading expanding diagonals are less common.
Intermediate wave (5) must be longer than intermediate wave (3), so it must end below 1,804.67. Confirmation of the end of the upwards trend for intermediate wave (4) would still be required before confidence may be had in a trend change, in the same way as that for the main bear wave count.
BULL ELLIOTT WAVE COUNT
WEEKLY CHART
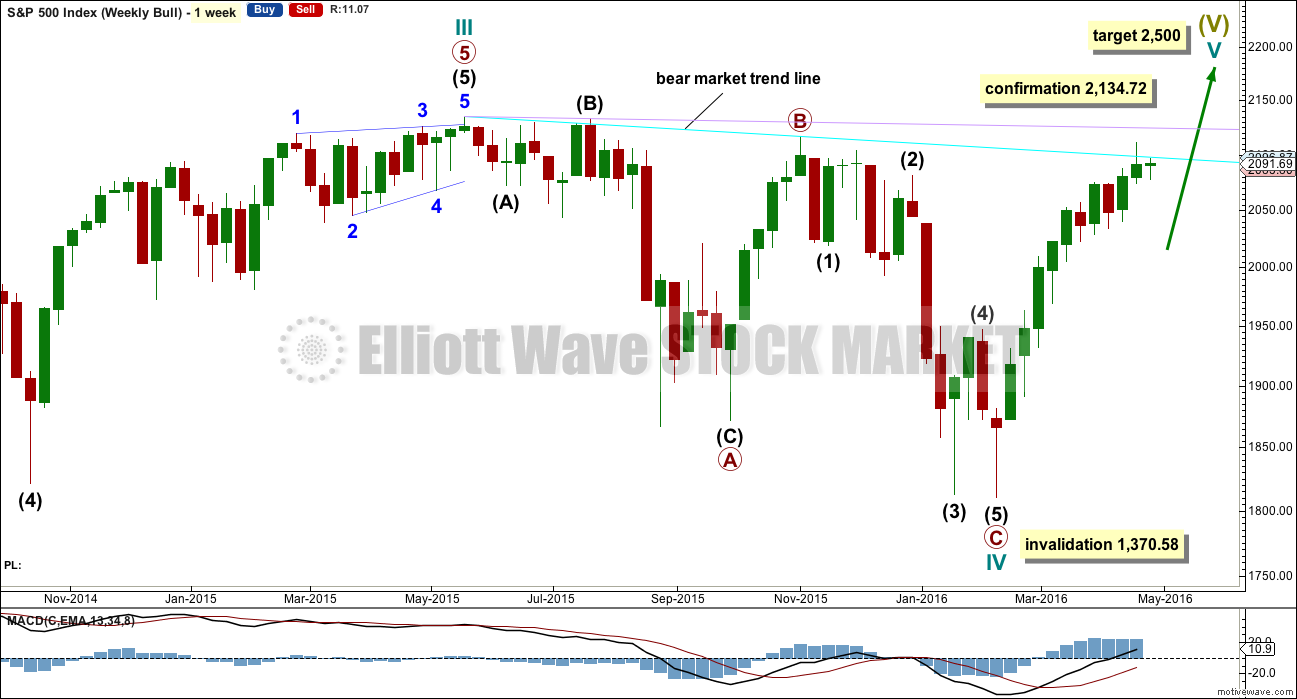
Cycle wave II was a shallow 0.41 zigzag lasting three months. Cycle wave IV may be a complete shallow 0.19 regular flat correction, exhibiting some alternation with cycle wave II.
At 2,500 cycle wave V would reach equality in length with cycle wave I.
Price remains below the final bear market trend line. This line is drawn from the all time high at 2,134.72 to the swing high labelled primary wave B at 2,116.48 on November 2015. This line is drawn using the approach outlined by Magee in the classic “Technical Analysis of Stock Trends”. To use it correctly we should assume that a bear market remains intact until this line is breached by a close of 3% or more of market value. In practice, that price point would be a new all time high which would invalidate any bear wave count.
This wave count requires price confirmation with a new all time high above 2,134.72.
While price has not made a new high, while it remains below the final bear market trend line and while technical indicators point to weakness in upwards movement, this very bullish wave count comes with a strong caveat. I still do not have confidence in it.
DAILY CHART
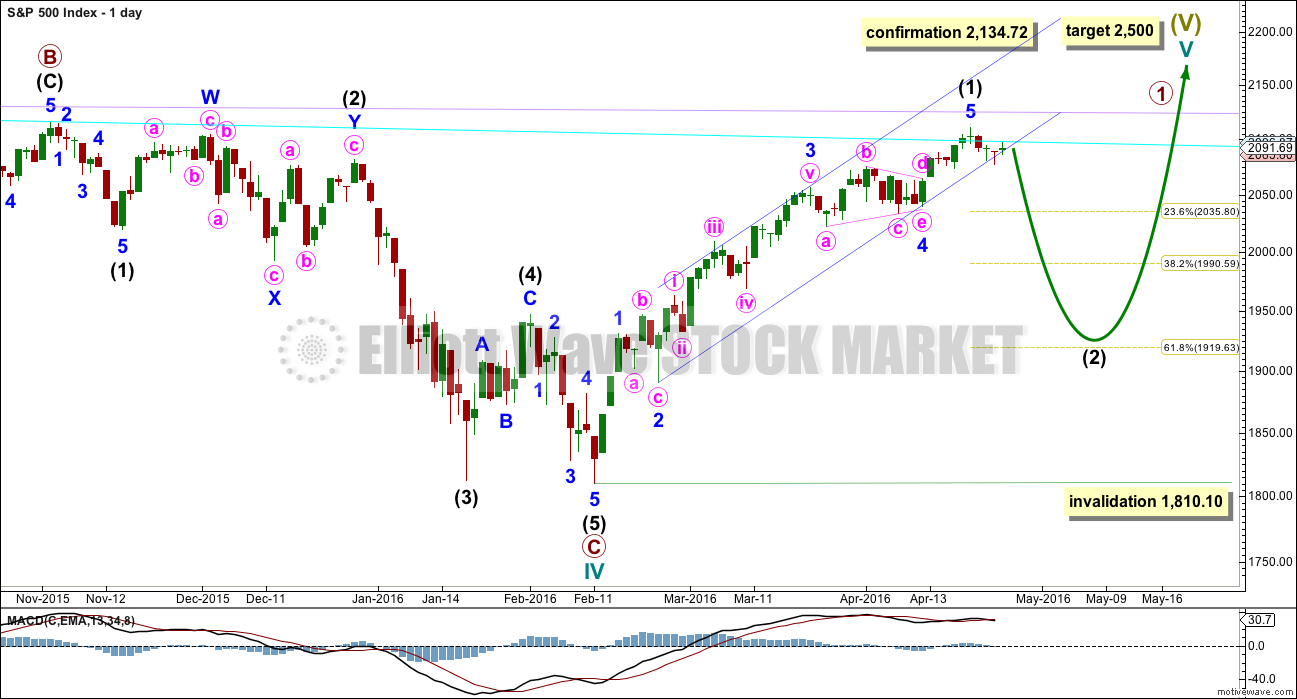
Intermediate wave (2) is seen as an atypical double zigzag. It is atypical in that it moves sideways. Double zigzags should have a clear slope against the prior trend to have the right look. Within a double zigzag, the second zigzag exists to deepen the correction when the first zigzag does not move price deep enough. Not only does this second zigzag not deepen the correction, it fails to move at all beyond the end of the first zigzag. This structure technically meets rules, but it looks completely wrong. This gives the wave count a low probability.
If the bull market has resumed, it must begin with a five wave structure upwards at the daily and weekly chart level. That may today be complete. The possible trend change at intermediate degree still requires confirmation in the same way as the alternate hourly bear wave count outlines before any confidence may be had in it.
If intermediate wave (2) begins here, then a reasonable target for it to end would be the 0.618 Fibonacci ratio of intermediate wave (1) about 1,920. Intermediate wave (2) must subdivide as a corrective structure. It may not move beyond the start of intermediate wave (1) below 1,810.10.
In the long term, this wave count absolutely requires a new high above 2,134.72 for confirmation. This would be the only wave count in the unlikely event of a new all time high. All bear wave counts would be fully and finally invalidated.
TECHNICAL ANALYSIS
DAILY CHART
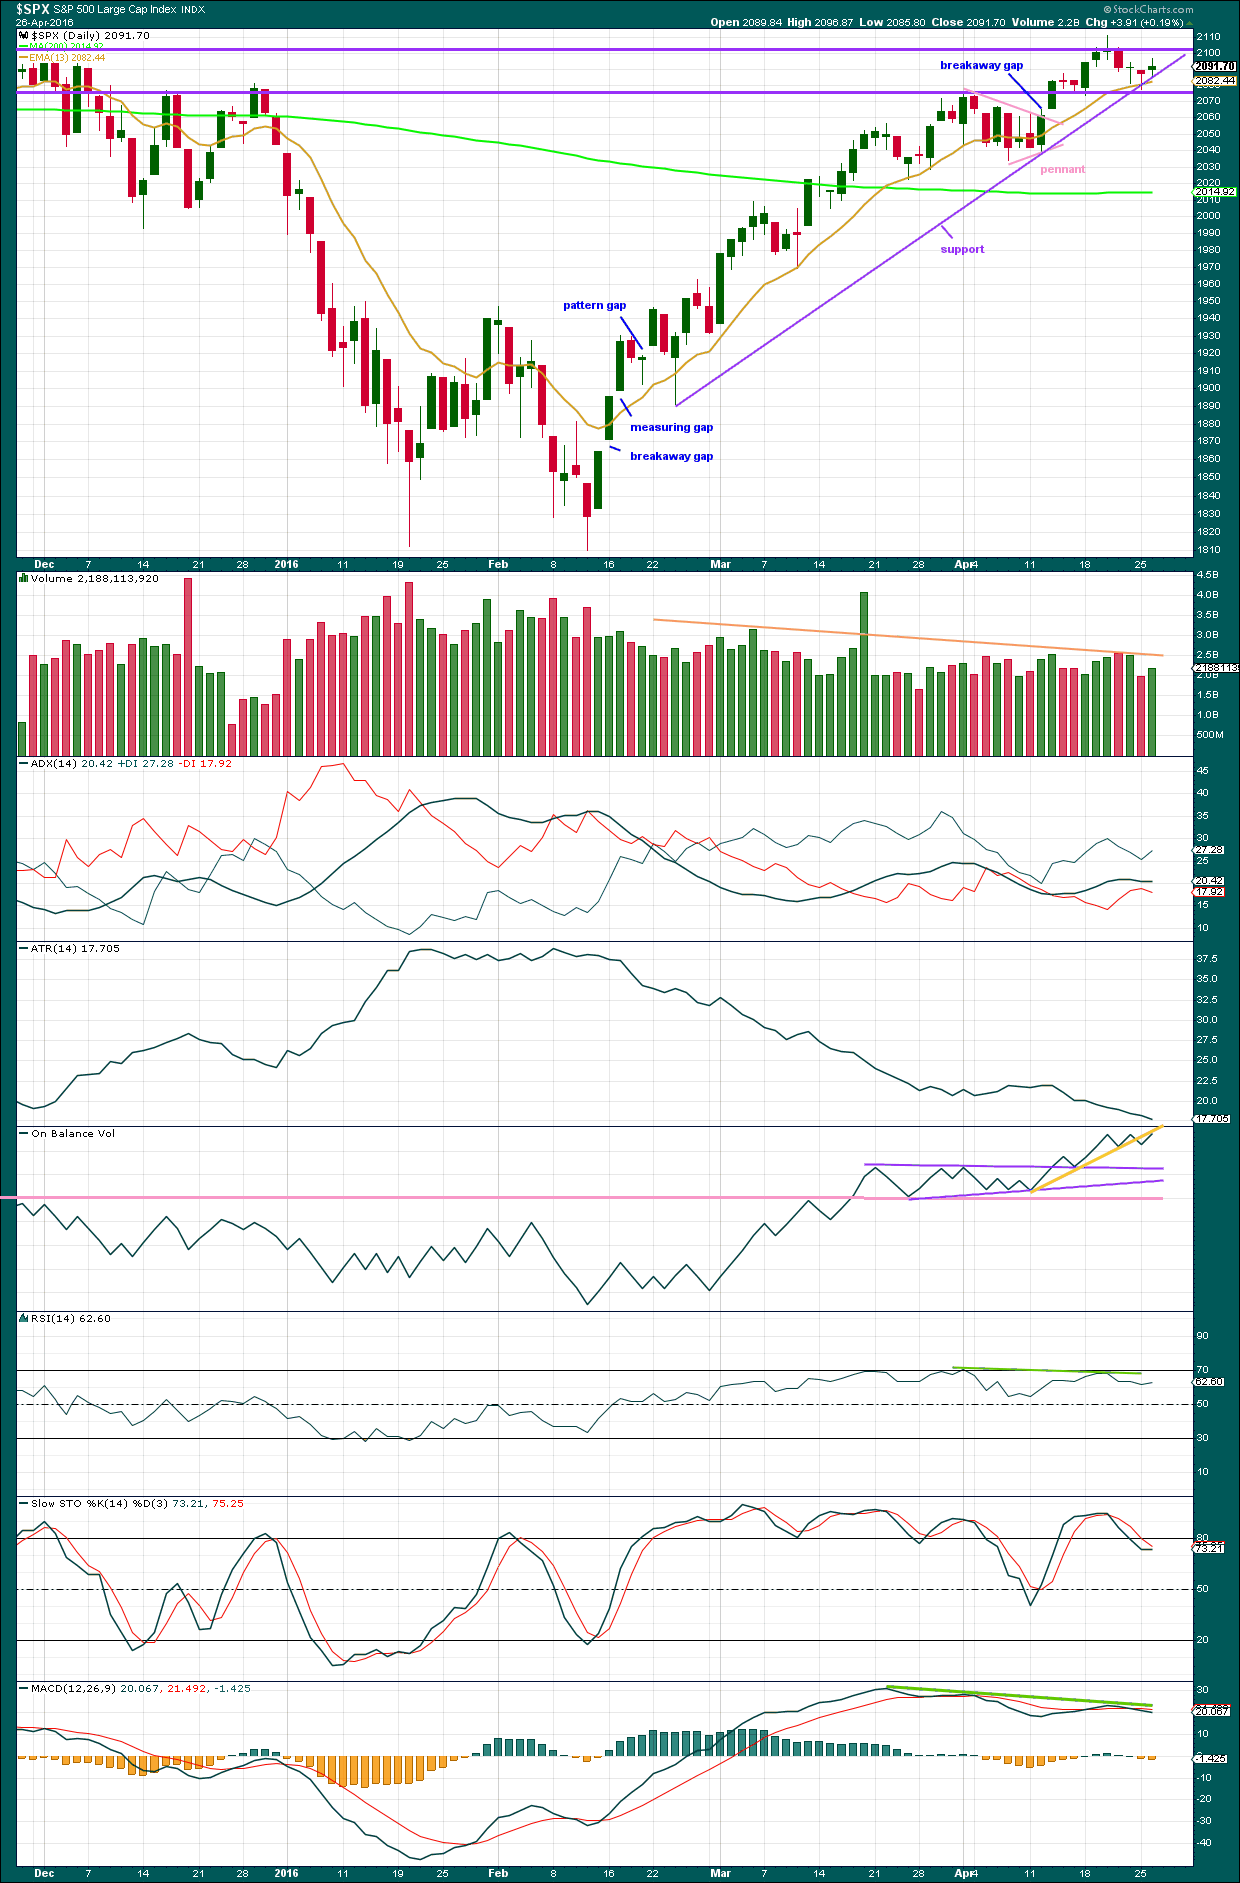
Click chart to enlarge. Chart courtesy of StockCharts.com.
Volume data on StockCharts is different to that given from NYSE, the home of this index. Comments on volume will be based on NYSE volume data when it differs from StockCharts.
The line in the sand for a trend change is the upwards sloping purple support line. This is the same as the lower edge of the blue channel on the main daily Elliott wave count. A breach of this bull market trend line would indicate the trend (at least short to mid term) has changed from bull to bear. While price remains above that support line it should be expected that price may find support there.
An Evening Doji Star candlestick pattern is completed at the last high. This is a reversal pattern and offers some support for expecting a high is in place. The fact that this pattern has occurred at the round number of 2,100 is more significant. There is light volume on the first candle in the pattern and heavier volume on the third candle in the pattern. This increases the probability of a reversal.
How price behaves at this line will indicate which hourly Elliott wave count is correct and if price is beginning either new wave down or if it will continue to make new highs. For clues as to whether the line may be breached sooner or later we can look to volume, momentum, breadth, strength and sentiment.
Volume: Overall, now volume declines as price has been rising for over 40 days. In the short term, the downwards day of 21st April comes with an increase in volume supporting the downwards movement in price. Downwards volume for 21st of April is stronger than the prior three upwards days. Volume for the next downwards day of 25th April was light, and now volume for a small upwards day of 26th April is slightly stronger. However, these two days are very small range days and both have relatively light volume, so this is a warning that the line may not be breached, but it is not a strong warning. Volume indicates the upwards movement is unsupported and unsustainable. A relatively large correction at least would be expected.
On Balance Volume: To date this indicator has been providing bullish signals along with rising price. OBV will remain bullish while OBV finds support at all the trend lines drawn here. The yellow line was breached and now OBV moved higher to find resistance at the lower edge. If OBV moves lower from this line, it will have a little strength. So far this looks like a typical breach and throwback from OBV. A break below the purple lines would be reasonable bearish indication. A break below the pink line would be a strong bearish signal. In this instance, unfortunately, OBV may not lead price for us.
Momentum: MACD shows divergence with price (green line) back to 22nd March. With reasonably long held divergence, this indicates momentum is weak.
Breadth: As given in charts below, the AD Line and Bullish Percent both indicate breadth to this upwards movement, but there is hidden bearish divergence. The increase in breadth is not translating to a corresponding increase in price; price is weak.
Strength: RSI has some slight divergence with price (green line). RSI has failed to make corresponding highs as price has made new highs. This indicates weakness in price.
Sentiment: As given in COT charts below, up to 18th April, commercials are more strongly short than long and non commercials more strongly long than short. This is bearish.
Conclusion: The bearish case at least short / mid term is supported by volume analysis and has some slight support today from On Balance Volume. The divergence in momentum, breadth and strength indicators supports a bearish outlook over a bullish outlook. Sentiment of commercials is also bearish. Overall, the balance of this picture is predominantly bearish. The support line should be expected to most likely be breached if price again comes down to it. But first it may provide some support for a small bounce. If it is breached, then look for a potential throwback to find resistance. If price behaves like that, then take the opportunity to enter short there.
INVERTED VIX DAILY CHART
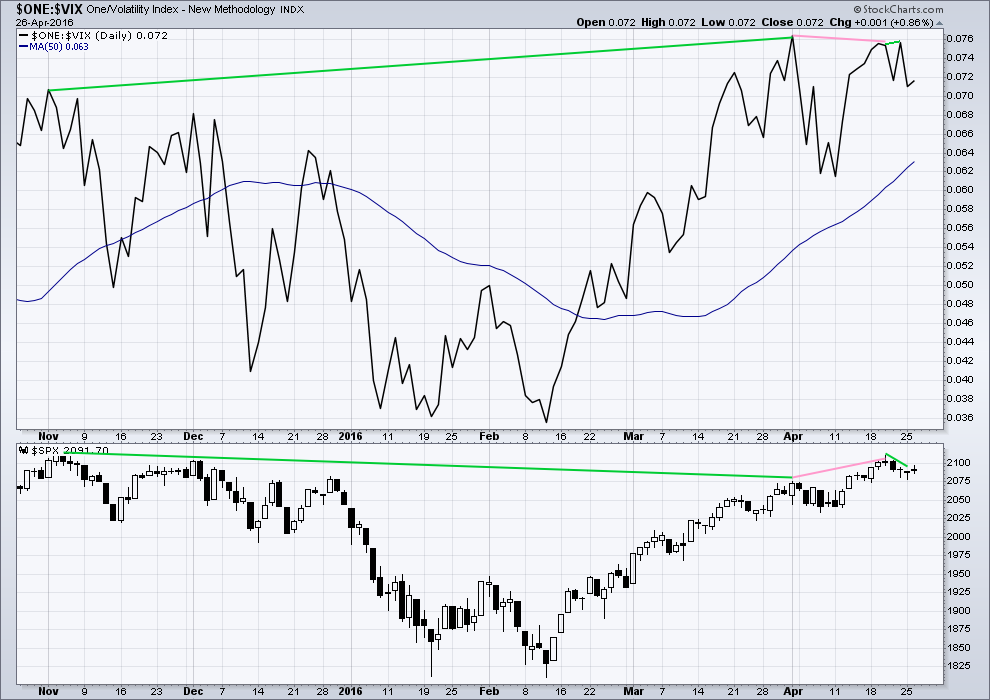
Click chart to enlarge. Chart courtesy of StockCharts.com.
Volatility declines as inverted VIX climbs. This is normal for an upwards trend.
What is not normal here is the divergence over a reasonable time period between price and inverted VIX (green lines). The decline in volatility is not translating to a corresponding increase in price. Price is weak. This divergence is bearish.
Price made a new short term high, but VIX has failed to make a corresponding high (pink lines). This is regular bearish divergence. It indicates further weakness in the trend.
Friday’s small green doji candlestick overall saw sideways movement in price, closing very slightly up for the day. Yet inverted VIX has made new highs above the prior high of 20th and 19th of April. Volatility declined for Friday, but this was not translated into a corresponding rise in price. Again, further indication of weakness in price is indicated. This is further hidden bearish divergence.
BULLISH PERCENT DAILY CHART
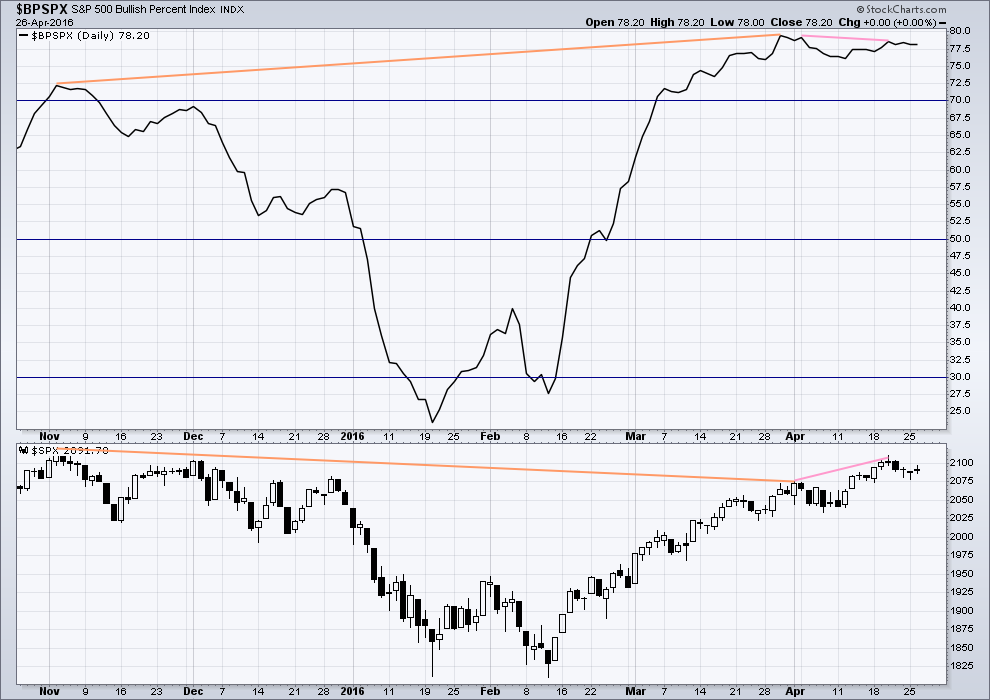
Click chart to enlarge. Chart courtesy of StockCharts.com.
With this indicator measuring the percentage of bullish equities within the index, it is a measurement of breadth and not sentiment as the name suggests.
There is strong hidden bearish divergence between price and the Bullish Percent Index (orange lines). The increase in the percentage of bullish equities is more substantial than the last high in price. As bullish percent increases, it is not translating to a corresponding rise in price. Price is weak.
As price made a new short term high on 20th April, BP did not (pink lines). This is regular bearish divergence. It indicates underlying weakness to the upwards trend.
ADVANCE DECLINE LINE
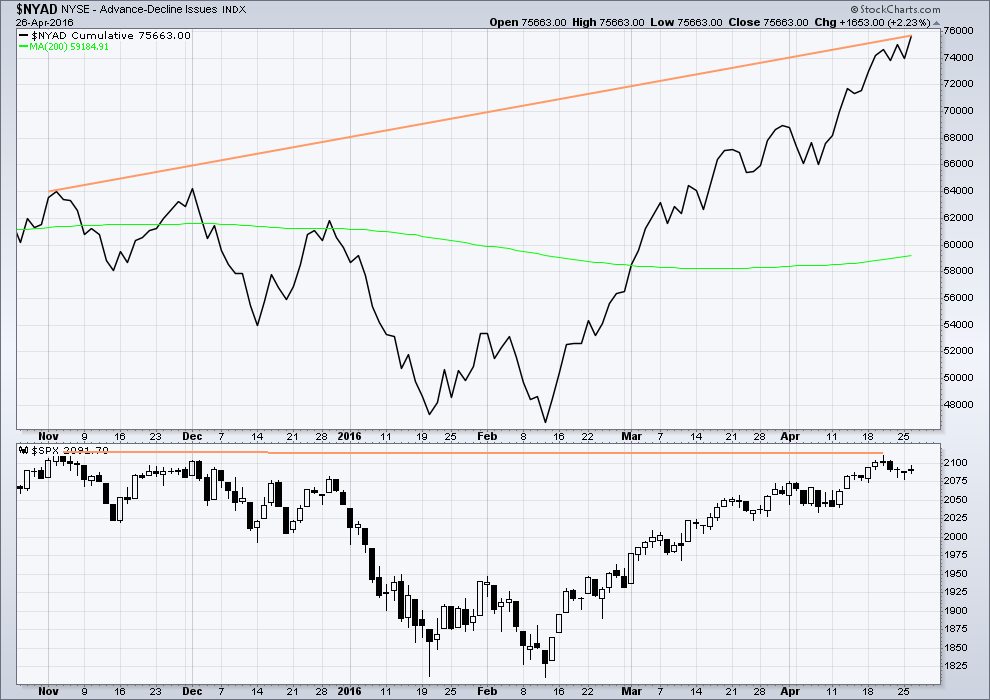
Click chart to enlarge. Chart courtesy of StockCharts.com.
With the AD line increasing, this indicates the number of advancing stocks exceeds the number of declining stocks. This indicates that there is breadth to this upwards movement.
From November 2015 to now, the AD line is making new highs while price has so far failed to make a corresponding new high. This indicates weakness in price; the increase in market breadth is unable to be translated to increase in price.
It remains to be seen if price can make new highs beyond the prior highs of 3rd November, 2015. If price can manage to do that, then this hidden bearish divergence will no longer be correct, but the fact that it is so strong at this stage is significant. The AD line will be watched daily to see if this bearish divergence continues or disappears.
The AD line today has made a new high beyond the last swing high five days ago, but again this has failed to translate into a new high for price. This indicates further weakness in price.
The 200 day moving average for the AD line is now increasing. This alone is not enough to indicate a new bull market. During November 2015 the 200 day MA for the AD line turned upwards and yet price still made subsequent new lows.
COMMITMENT OF TRADERS (COT)

Click chart to enlarge. Chart courtesy of Qandl.
This first COT chart shows commercials. Commercial traders are more often on the right side of the market. Currently, more commercials are short the S&P than long. This supports a bearish Elliott wave count, but it may also support the bullish Elliott wave count which would be expecting a big second wave correction to come soon. Either way points to a likely end to this upwards trend sooner rather than later. Unfortunately, it does not tell exactly when upwards movement must end.
*Note: these COT figures are for futures only markets. This is not the same as the cash market I am analysing, but it is closely related enough to be highly relevant.

Click chart to enlarge. Chart courtesy of Qandl.
Non commercials are more often on the wrong side of the market than the right side of the market. Currently, non commercials are predominantly long, and increasing. This supports the expectation of a trend change soon.
DOW THEORY
I am choosing to use the S&P500, Dow Industrials, Dow Transportation, Nasdaq and the Russell 2000 index. Major swing lows are noted below. So far the Industrials, Transportation and Russell 2000 have made new major swing lows. None of these indices have made new highs.
I am aware that this approach is extremely conservative. Original Dow Theory has already confirmed a major trend change as both the industrials and transportation indexes have made new major lows.
At this stage, if the S&P500 and Nasdaq also make new major swing lows, then my modified Dow Theory would confirm a major new bear market. At that stage, my only wave count would be the bear wave count.
The lows below are from October 2014. These lows were the last secondary correction within the primary trend which was the bull market from 2009.
These lows must be breached by a daily close below each point.
S&P500: 1,821.61
Nasdaq: 4,117.84
DJIA: 15,855.12 – close below on 25th August 2015.
DJT: 7,700.49 – close below on 24th August 2015.
Russell 2000: 1,343.51 – close below on 25th August 2015.
To the upside, DJIA has made a new major swing high above its prior major high of 3rd November, 2015, at 17,977.85. But DJT has so far failed to confirm because it has not yet made a new major swing high above its prior swing high of 20th November, 2015, at 8,358.20. Dow Theory has therefore not yet confirmed a new bull market. Neither the S&P500, Russell 2000 nor Nasdaq have made new major swing highs.
This analysis is published @ 11:34 p.m. EST.


Hey Verne,, Nikkei futures showing a meter long red candle
S&P also , dropped to below 2075, now at 2080
BOJ disappoints with no additional stimulus, maintains negative rates,, futures taking a hit. Nikkei futures down big,, actually huge,,this could be the start of something big
I have been saying this for over two years now. This article is a good accounting/finance lesson for all. This is basic Accounting/finance, if you can read and understand Financial Statements and 10K’s….
Debt Is Growing Faster Than Cash Flow By The Most On Record:
http://www.zerohedge.com/news/2016-04-27/debt-growing-faster-cash-flow-most-record
Here is why I like Lara’s target for P3 to the downside. I think we are going to get there faster than most folk expect. Good evening all!
Amen
Those other guys, who shall remain nameless, are nuts! They are counting today’s move up as a complete minor one of an intermediate five, hence, according to them, it’s onward and upward to new all time highs! I sure hope their subscribers are not trading on that wave count…Gadzooks!!! 🙂
Poor Steve, he must have been leaned on by Daddy BP… 🙁
A leading diagonal? Or can they fit that mess into an impulse?
I’m not seeing it…
Neither can I. I think they are completely nuts! 🙂
It’s beautiful triple top. SPX now traversing an area of formidable resistance. Let’s see just how deep the pockets of our erstwhile banksters be! 🙂
Fyi: one of my rules of trading is to never pick a fight with a stock because they ALWAYS win!
I was unfortunately reminded today why I created this rule after taking TVIX to the ring. I was winning the first 8 rounds and then got kicked in the teeth and then knocked out in rounds 9-10.
You’ll see TVIX with a beautiful gold belt around the waist on ESPN top 10 tonight!
Until the down-trend is confirmed, you have to scalp those babies; If you are in the green, 90% of the time you take the money and run like hell! Don’t mind looking like a wus for hopping out of the ring after only 8 rounds…. 🙂
Amen Brother!
And we may now have the final wave… a complete structure it may be.
The orange ? is the structure of that b wave. It doesn’t matter now that it is clearly done, and I don’t want to spend an inordinate amount of time trying to figure out what it was. Some kind of combination maybe.
Is this also the alt hourly bear count conclusion?
Then conclusion of alt bear daily?
Sorry for the delayed reply Joseph.
Yes. Alternate hourly.
No problem… Thanks
Just loaded the last wagon. Now I can rest and enjoy the ride down the mountain.
I also just added 10% to my position. Will sell that 10% if we make a new high above 2111 or this wave from 2111 high morphs into a 3 wave structure.
Happy trails, to you….until…we meet….again…! 🙂
Last night during my wilderness celebration by the fire I was grooving to the Marshall Tucker Band’s great song “Fire on the Mountain”.
I do not like stop loss orders when I am gone. If I had not come home in time today to cancel my stop loss orders, I would now be stopped out of my trading vehicle even though the SPX has not exceeded 2011.
Something is going on with VIX, UVXY and TVIX. I gave my thoughts previously.
Fear seems to be entirely absent. Is that not what a Primary wave two correction is supposed to do? It convinces everyone that the market is going up and there is nothing to fear.
This just @#$*!@# amazing! Can you think of a more emphatic way for a small second wave correction, inside a decline from a primary two top to end ??!! It’s like those nestled Russian eggs that keep revealing another smaller one on the inside. Both VXX and UVXY made new 52 week lows today so the complete absence of fear at every degree of future market perspective is now affirmed. Filled on my June QID 32 strike calls exactly at one buck while I was away. Yikes!! 🙂
I’m not holding my breath yet – it’s looking good atm for the Alt bear but it could still morph into something else. If the Alt bear is correct we should move swiftly lower tomorrow and not look back. Today’s highs could end up being the end of Wave (b) of an ABC down from 2111 rather than Minute (ii).
An ABC now expects a 5 wave impulse for Wave C, so a 5 down now won’t tell us that much – it could be a C wave or Minute (iii).
2039 & 2111 remain important for that reason, albeit I took a punt near todays high as we are closer to the top of that range than the bottom atm. Near 2039 I’ll likely sell most of my position and re-buy below it.
I hear ya. Until we take out at least 2050 I am yanking profits out of this maelstrom faster than you can say….”wazzat??!!” 🙂
RSI on 5min chart suggesting this could be the alternate Minute (ii) double zig zag. If it is then it should be finished fairly soon.
One final fifth wave up?
This follows the alternate hourly
Yeah – that’s exactly how I am counting it – watching 2095.73 (approx (1) high) like a hawk!
Many thanks for the timely charts Lara.
Thanks, great to get the expert opinions.
Vertical run up failing with consolidation, squeezing BBs, /ES heading lower.
Looks good. Hopefully this goes over the cliff.
I suspect that’s all she wrote….! 🙂
LOL
Yep.
This. Alternate hourly.
Minute ii continuing higher as a double zigzag to again test the bear market trend line.
Now let us see if it stops there…
Still working on what may be happening very short term with the alternate hourly for this sideways mess….
Price is trying to break below the support line and not able to stay below yet.
So far today price is remaining below the bear market trend line too.
These lines converge in another 9 hours.
For the main hourly chart: this doesn’t look like a third wave up starting. And so I’m going to relabel that hourly chart today to see minute ii continuing as a combination *edit: can’t be a double zigzag, its a combination. This would require it to breach the lower edge of the Elliott channel / support line.
This is possible. Sometimes the S&P doesn’t play nicely with its trend lines. It breaches them, then turns back and continues on in the prior direction.
Hey there. I am back from the mountains. No bears. But I did see two camps of bear hunters for what is called our spring hunt. Long story for later.
I am thinking the current corrective move up from 2077 is not complete. I am looking at 2102 (sorry Vern for being over the round number.) I have cancelled all my stop loss order. Instead I am looking to fill the one last wagon of eight at 2102 or thereabouts.
My calculation
wave a from 2077 to 2096 roughly 20 points
If wave b bottom was 2082 then 2102 is where a=c.
Lots to do. Back later.
Welcome back Rodney.
I see you forgot to bring us our bear? Or did you leave him just around the corner of Wall St and he’s making his way over there now?
Where’s that Grizzly throw you promised…???!!! 🙂 🙂 🙂
could still just be wave b of Minute II?
Minute (ii) could be a double zigzag (WXY from 2077 with Y in progress now) – is all up in the air atm. Y = W around 2101.65.
Run up from 2077.55 to 2096.87 looks like a 3 wave structure to me, but the move down to todays low didn’t retrace 90% (so is not a flat) – it might have been a zigzag for wave W?
61.8 fib target = 2098.18
76.4 fib = 2103.07
What we are seeing unfold before our very eyes is classic instance of “bankster wars”.
What is so incredible is that this market is not even being aggressively sold, and look at how they are fighting tooth and nail just to try and print a green candle!
Folks this is completely nuts!!
UVXY is making a new 52 week low on a FED non-announcement??
This a new kind of market insanity I have never seen. Wow!
Winter Is Coming…
Primary Wave 3 ………………. there can be no other explanation!
Lara – still confirmed downtrend on the Nasdaq?
Thanks!
Trend channel confirmation, yes.
Price confirmation below 4,747.65.
Just as I was starting to think I had unloaded those 209 calls too early, comes the reminder that bulls make money, bears make money, and pigs get…well you know…
here come the banksters with the end of day cash dump…nobody seems to be biting on the initial pump…. 🙂
If this spike out the tight trading range is quickly reversed to the downside, I think the past few days of aimless meandering will have been resolved in favor of the bearish count…watching the round numbers….
The candle sticks are speaking…. down, down, down!
5 min chart
MY gut tells me market will move Blank after Fed announces…
Sorry, I am out of the gut prediction business!
LOL
Fed:
Winter is coming…..
The Fed Put continues…. as everyone believes.
But that is not how it is seen with these counts.
I closed my UVXY call position. Hasn’t been moving higher like VIX has and can’t take the chance of market trending higher in which case UVXY will make a new 52 wk low. Will reposition after FED announces. I took a 10% loss on it
UVXY flat today while VIX up 5%. Same scenario yesterday 🙁
It has been acting quite strange lately and diverging quite strongly from VIX. In addition to short selling pressure, it is suggesting an abundance of complacency about the mid term direction of the market. I am also still a bit underwater on my shares, and have been selling calls to steadily reduce cost basis….if past pattern holds, it will be lot higher a few weeks from now…
The action around the round numbers is also making me a bit cautious about near term bearish prospects….
We’ll be having a little bit more direction in a few minutes as FED is about to release. The thing is market can also change direction drastically after the initial reaction to the FED announcement… lets see what happens
So true. As often as not the initial reaction is quickly reversed and the market heads in the opposite direction…
Yep! UVXY short sellers abound. Somebody thinks its going a lot lower based on a recent short sale that flashed across the screen…
Market also showing evidence of huge cash dumps but no upside progress…
If QID exceeds today’s high at 31.10, buying June 32 strike calls at the market….
If NDX price action is any indication, we should not expect too much additional market friskiness….
Taking the money and run…this bull is panting awfully hard imo… 🙂
SPX lagging DJI move up but may play catch-up. 209 calls up 25%; will try to unload for 1.25…
No fill yet on QID. It is sporting a break-away gap at 28.96 from the close on April 21 and of course a gap up open today from yesterday’s close at 30.13. I would expect a move higher in the other indices should be confirmed with a fill of the latter.
thanks guys!
I am not complaining, but all this bullishness ahead of any actual FED announcement is idiotic in the extreme. It has got to be viewed as a buy-the-rumor, sell-the-news scenario if I were to make a guess. You gotta love the lemmings…off the cliff they go… 🙂
Vern,
This herd of bulls will follow their leader over the cliff…
Can’t see anything but the most dovish of remarks from Yellen – possibly resulting in the classic blow off top.
I think they are going to sell it…! 🙂
Unless of course they announce Q.E infinity…as if it were not already here. Anybody that believes the banksters have not all along been aggressively buying the markets are clueless. At least the Chinese and Japanese have been honest about it… 🙂
We need to take out 2111.05 to confirm a small third up in SPX…
Vern,
Announcement of additional stimulus in any shape or form is clear confirmation that all that the FED has done to date has been a failure.
This is what will make FED and central banks around the world loose credibility.
—- I Like the following from former BoJ policy maker —
On the eve of this week’s highly anticipated Bank of Japan gathering, an influential former policy maker cautioned his successors against rushing to make changes in an environment they can’t control.
Nobuyuki Nakahara, an intellectual father of the BOJ’s first stab at quantitative easing in 2001 when he was on the board, recommended against adding stimulus now. He said the central bank should take more time to gauge the impact of the negative rate strategy it adopted in January.
“The global economic environment is bad and there is a limit to how much a nation can do with its own policy,” Nakahara, 81, said in an interview in Tokyo on Tuesday. “If a country doesn’t conduct policy within its limits, it will overreach.”
Quite right. Any bullish reaction from an announcement of further stimulus will simply highlight how completely moronic the US market participants have become. It will be nothing but a naked attempt to manipulate market sentiment in view of the fact that we now have banksters exposed as utterly impotent in the face of market realities. I just read an interesting paper about how the SEC has allowed companies to discard GAAP accounting standards and report completely made up numbers for their earnings, in particular blatantly ignoring expenses that they should be charging against their bottom line. It has not gone unnoticed how many are reporting significant declines in both top and bottom line revenue yet asserting dramatic earnings increases. Talk about Alice in Financial Wonderland…!
Ok, need help from you experienced traders!
First we haven’t breached the trend channel yet. We have confirmation of a trend change at minor degree. We wont have confirmation of a trend change at intermediate degree until prices fall to 2073, we wont have confirmation of a larger degree trend change until prices fall to 2034. Am I missing something?
Unless you are very nimble, keep your powder dry. The very least acceptable signal for a move to the downside in my view is an SPX break of 2050. Most traders should wait for confirmation with a break of 2039.74.
Absolutely no need to rush this market, especially as long as DJI is trading above 18,000.00; let it come to you…
2039.74 is confidence of a trend change.
Unloading first batch of 209 SPY calls for quick 50%. Holding remaining batch as hedge with house money…and now we await Frau Yellen… 🙂
Considering that NDX has already made its intentions clear, the current pullback in QID occasioned by on-going friskiness in the other indices represents an excellent opportunity to get positioned in June calls. The window will not be open for very long methinks….open bid on 32 strike calls for limit of un peso! 🙂
Looking closely at DJI’s attempt to reclaim round number pivot at 18,000.00. If it does and closes above today, it would be very bullish for the short term. If forcefully rejected, it means the bears mean business and a truly impulsive decline should commence…wrangling to be resolved probably after Frau Yellen’s pronouncements….
NDX has broken a support shelf after an island reversal pattern. It will probably come back up to test underside…
Adding to SPY 209 calls. Clearly we are going higher in the short term…
The entire movement the last few days now looking like a wave two triangle with E just completing at this morning’s lows…the only problem is I am told second waves cannot have a triangle as the only structure so it cannot be all done…or perhaps counted as some kind of ABC correction…
The triangle could be part of a combination.
Or it’s a B wave.
Closing 209 strike SPY put, buying 208 for quick 30%, remaining market neutral…
A move below 2081.70 now would mean the recent wave up from 2077.55 was corrective.
But would that move up be a B wave or a 2nd wave??… I can’t tell.
The price action continues to look corrective imo…
Doc’s left me hanging – again!
🙂 🙂
you can tell me,, I’m a doctor.. sorry I was so late with that,, I was making birdies today
I don’t get these moves! The Nasdaq is selling off but others are not, but when the bulls try to push back up the Nasdaq the others seem to follow suit! Is this market trying to turn us bullish? Just seems that if the Nasdaq turned higher in a correction the S&P would follow, or is that just what the market wants us to believe?
Sometimes the smartest trade is to do nothing. Considering what is going on in the markets right now, this qualifies as such an occasion. I would wait for the Market to show its hand. It will either continue higher shortly, or confirm a false break-out by declining back below the line connecting the recent lower highs…
Im sitting tight ready to enter after confirmation on lara’s recommendation, im basicly just trying to learn price action and how the markets react to each other.
At times it seems entirely without rhyme or reason….I suspect in this case the other indices are going to play catch-up with the NDX… 🙂
APPL & TWTR & others out with bad earnings & revenues hitting NDX & COMP
This will infect the other indexes. APPL is also in the DJIA… but at the moment energy is offsetting APPL in the DJIA. That will change in the coming days. I think APPL is to go sub $50 as the stock with the most current buys in history by analysts starts to get downgraded over the coming days & weeks to hold & outright sell.
“Is this market trying to turn us bullish? ”
Yes. That is exactly what second wave corrections are designed to do.
Interesting tidbits of information…
Beyond what Trump says, a lot of eyebrows were raised when Lael Brainard, a member of the Fed’s committee that sets interest rates, donated $2,700 to Hillary Clinton’s presidential campaign. The Fed didn’t comment for this story.
The interest in VIX shares have shot through the roof, intelligence on the street is that smart money is getting positioned on VIX while retail investors are loading up on the equity calls.
I am hoping the lemmings will jump on board en masse one more time. I have an open reload stink bid on next week’s UVXY 16 strike calls for 0.50… 🙂
This ramp is for sucking more lemmings into the wrong side of the trade…
There is an old adage that says “Distance lends enchantment to the view”.
It can often apply to looking at price action in the markets. When near and mid-term indicators become erratic and/or ambiguous, I like to step back and peruse the larger picture. A few weeks ago I posted a chart of the SPX 500 that showed some quite interesting developments in the 20 month EMA. It revealed that while every violation of the 20 month ema did not lead to a market crash, every market crash has been preceded by one. There were two anomalous cases in 2010 and 2011 where the line was violated but the market recovered and marched higher, co-inciding with Q.E announcements. Here is another revealing chart of interaction between the 10 and 20 month moving averages. Many analysts are citing the impending golden cross (50 dma crossing above 200 dma) in the markets as pointing to the likelihood of new all- time highs but I think the 10 and 20 month averages are more significant. While near and mid -term market indicators may at times be susceptible to flashing false or ambiguous signals due to outlier data, or even short-term bankster manipulation, not so slower, longer term moving averages. They can provide an X-ray, as it were, of the market’s true internal condition. This one paints a revealing portrait.
I agree with Kevin about the strangeness of the current action. I think it’s smart to take profits on short term positions immediately as they go in the green. The action seems to me corrective, and not at all, so far, consistent with an impulse down at primary degree, despite what is happening in NDX. Stay sharp…
Vern,
I am waiting to see what FED says at 2:00PM today. As per the Put/Call ratio stats, investors are overly bullish. The ratio is lowest since Mid 2015…that ought to mean something amongst other indicators but earnings alone make this an extremely overbought market JMHO.
While most traders are indeed bullish, it is very telling that their enthusiasm has failed to take the markets to new highs. In fact it is looking like the the market’s remaining aloft is now due almost entirely to consistent bankster buying. You may have noticed how they are stepping into the US markets pretty consistently a half hour before the close the last several sessions. I suspect we are going to see a big move soon. Either a final blow-off top, or a monster gap to the downside. This is situation that calls for a straddle (SPY 209 should work well) or SOH.
Vern,
I fail to see anything but a reversal by FED i.e. cutting the rate that will spark the markets. If they do that they loose credibility as they have been saying economy is good, jobs are good…don’t forget their window to act is dwindling as election looms so perhaps latest by June they will be forced to make a decision for the rest of the year.
I think Trump is correct on the fact that FED is trying to influence the election outcome in favour of democrats.
Yesterday Canadian Bank Governor states that ‘Pension funds should re-adjust as low interest rates are going to stay around for a while”.
I agree the next move will be very pronounced.
UVXY and TVIX are being kept low as there are likely under accumulation by smart money but I keep nibbling on small bits as long as the price is attractive..
Rumour has it that the recent Yellen White House confab was an appeal for rate relief to help juice the market. Knowing the utter corruption of these players and their tendency to intervene in the market at these critical junctures, either with explicit or implicit assurances of new injections of liquidity, I fully expect the conduct to continue and be reflected in whatever Frau Yellen has to offer later today. I think however, the market may has just about exceeded its “elastic limit”. You Physics buffs will know the implication of that….. 🙂
SPX 2050 is the next critical level to watch. I’ll post an interesting chart…
Something doesn’t smell right about this market … anytime the IBB and Apple get crushed, market would be down huge the next day!! I’m in the TVIX that should have spiked big this morning but only giving me a few %.
Something is really helping offset the damage and maybe it’s Energy?? Oil and Xle have had big run ups.
Anyway – be careful out there!
The shooting star and the doji on the weekly chart should by any reasonable measure be considered as bearish. Add to that what’s happening in the NDX and it makes the market’s tenacity all the more intriguing. I suspect a lot of traders are withing for Frau Yellen’s blandishments. I suspect her predictably dovish declarations will be met by an energetic burst of euphoria and a strong market push to the upside. My suspicion is that it will be short-lived, quickly reversing to the downside. As the famous Jamaican gangster, “Screwface” in Steven Seagal’s “Marked For Death” stated – “I man a-wait and I-a-watch!”
1st, for the first time
Woo hoo!
lol
hey,, thats great,, you even got the woo hoo right. remember Vernes Caribbean whoo hoo?
I guess they do it differently in the Caribbean
Yeah mon! 🙂