Price moved lower to breach the short term invalidation point on the first hourly Elliott wave count and provide first confidence for the alternate hourly Elliott wave count.
Summary: How price behaves on Monday, now that it is close to the support line, will indicate whether or not there is a high in place. A breach of the support line would indicate a trend change from bull to bear and that a third wave down would then be most likely. A new high above 2,111.05 would indicate a little more upwards movement for a few days to end above 2,116.48 but not above 2,134.72.
To see last published monthly charts click here.
To see how each of the bull and bear wave counts fit within a larger time frame see the Grand Supercycle Analysis.
To see detail of the bull market from 2009 to the all time high on weekly charts, click here.
New updates to this analysis are in bold.
BEAR ELLIOTT WAVE COUNT
WEEKLY CHART
This bear wave count fits better than the bull with the even larger picture, super cycle analysis found here. It is also well supported by regular technical analysis at the monthly chart level.
Importantly, there is no lower invalidation point for this wave count. That means there is no lower limit to this bear market.
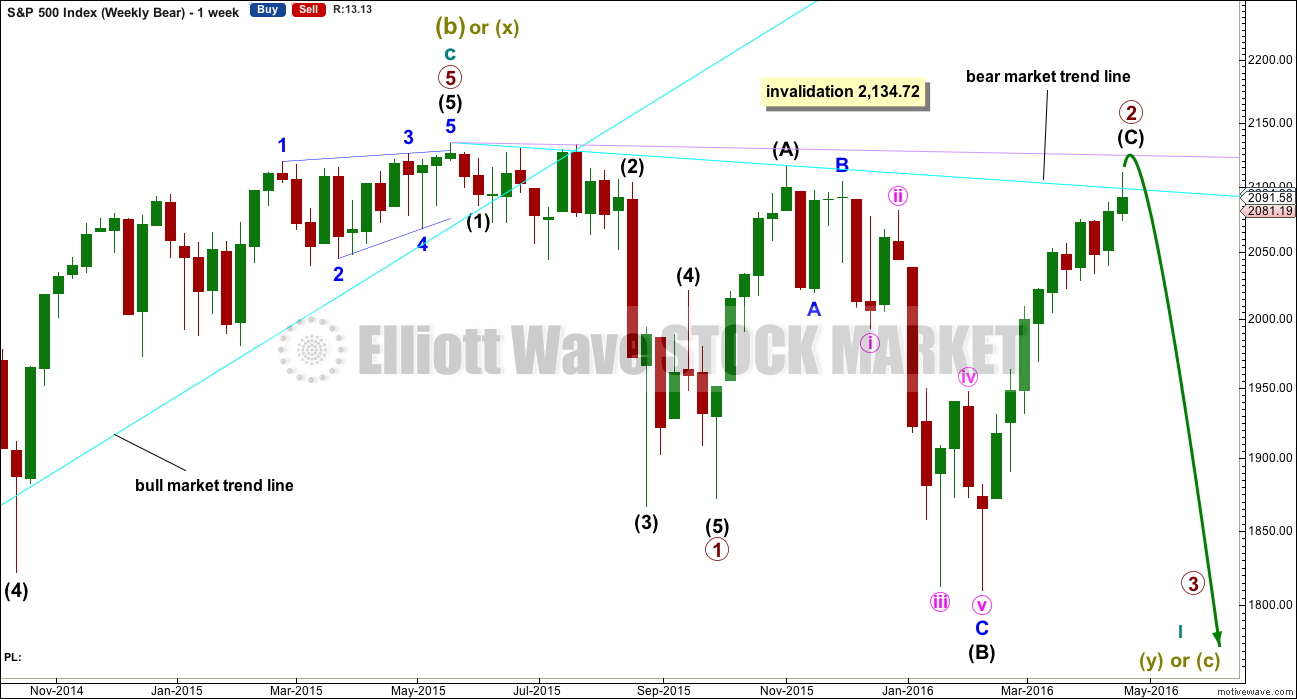
Primary wave 1 may be complete and may have lasted 19 weeks, two short of a Fibonacci 21. So far primary wave 2 has ended its 28th week. It looks unlikely to continue for another 6 weeks to total a Fibonacci 34, so it may end either this week or possibly early next week. This would still give reasonable proportion between primary waves 1 and 2. Corrections (particularly more time consuming flat corrections) do have a tendency to be longer lasting than impulses.
Primary wave 2 may be unfolding as an expanded or running flat. Within primary wave 2, intermediate wave (A) was a deep zigzag (which will also subdivide as a double zigzag). Intermediate wave (B) fits perfectly as a zigzag and is a 1.21 length of intermediate wave (A). This is within the normal range for a B wave of a flat of 1 to 1.38.
Intermediate wave (C) is likely to make at least a slight new high above the end of intermediate wave (A) at 2,116.48 to avoid a truncation and a very rare running flat. However, price may find very strong resistance at the final bear market trend line. This line may hold price down and it may not be able to avoid a truncation. A rare running flat may occur before a very strong third wave down. That looks possible today. The whole structure is now complete down to the five minute chart level. The hourly alternate looks at this possibility that intermediate (C) is over today and truncated by 5.43 points. The truncation is small and acceptable.
If price moves above 2,116.48, then the alternate bear wave count would be invalidated. At that stage, if there is no new alternate for the bear, then this would be the only bear wave count.
Primary wave 2 may not move beyond the start of primary wave 1 above 2,134.72.
DAILY CHART
Intermediate wave (A) fits as a single or double zigzag.
Intermediate wave (B) fits perfectly as a zigzag. There is no Fibonacci ratio between minor waves A and C.
Intermediate wave (C) must subdivide as a five wave structure. It is unfolding as an impulse.
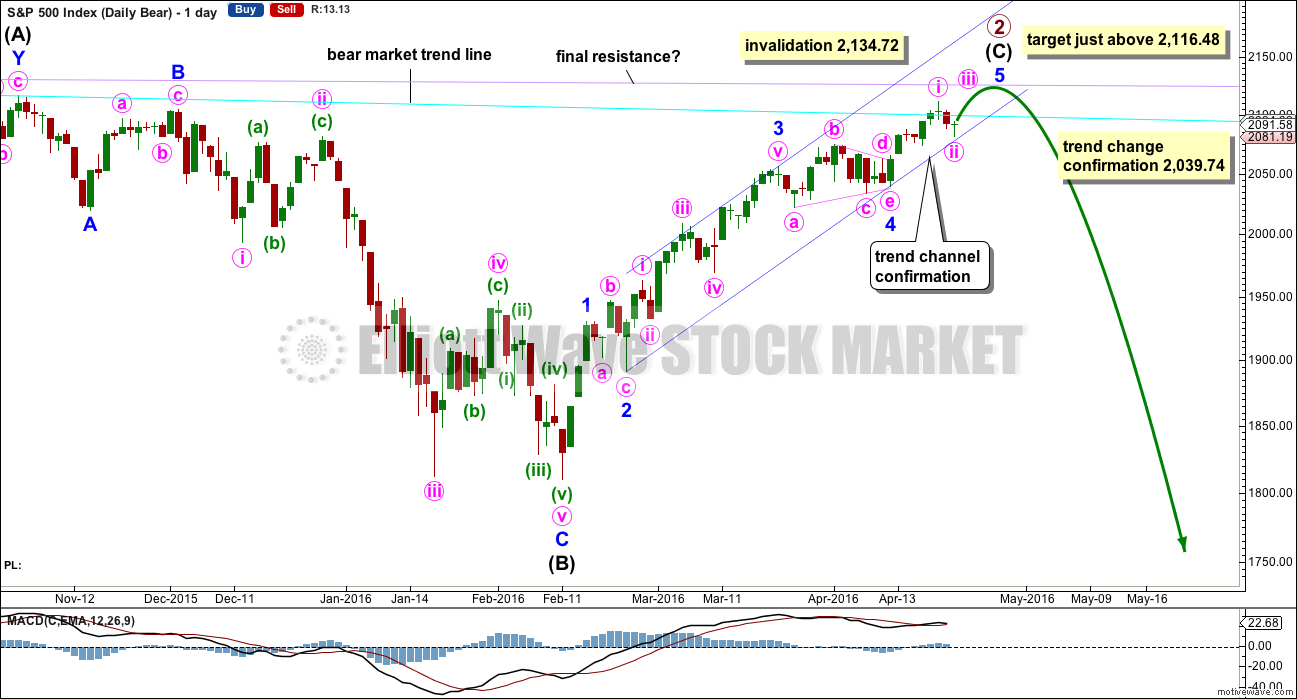
Intermediate wave (C) does not have to move above the end of intermediate wave (A) at 2,116.48, but it is likely to do so to avoid a truncation. If intermediate wave (C) is over, then the truncation is small at only 5.43 points. This may occur right before a very strong third wave pulls the end of intermediate wave (C) downwards. However, it is unconfirmed today although this is possible. Confirmation is required.
The next wave down for this wave count would be a strong third wave at primary wave degree.
The target is for intermediate wave (C) to end just above the end of intermediate wave (A) at 2,116.48, so that a truncation is avoided.
Redraw the channel about the impulse of intermediate wave (C) using Elliott’s second technique: draw the first trend line from the ends of the second to fourth waves at minor degree, then place a parallel copy on the end of minor wave 3. Minor wave 5 may end midway within the channel. When this channel is breached by downwards movement, that will be the earliest indication of a possible end to primary wave 2.
Because expanded flats do not fit nicely within trend channels, a channel about their C waves may be used to indicate when the expanded flat is over. After a breach of the lower edge of the channel, if price then exhibits a typical throwback to the trend line, then it may offer a perfect opportunity to join primary wave 3 down. This does not always happen, so if it does in this case take the opportunity.
Within minor wave 5, no second wave correction may move beyond the start of its first wave below 2,039.74. A new low below 2,039.74 could not be a second wave correction within minor wave 5, so at that stage minor wave 5 would have to be over. This would confirm a trend change.
Primary wave 1 lasted 98 days (not a Fibonacci number). So far primary wave 2 has lasted 142 days. Tuesday next week would be the 144th day. Up to two either side of 144 would be close enough for a Fibonacci relationship in terms of duration.
Price may find final resistance and end upwards movement when it comes to touch the lilac trend line.
HOURLY CHART
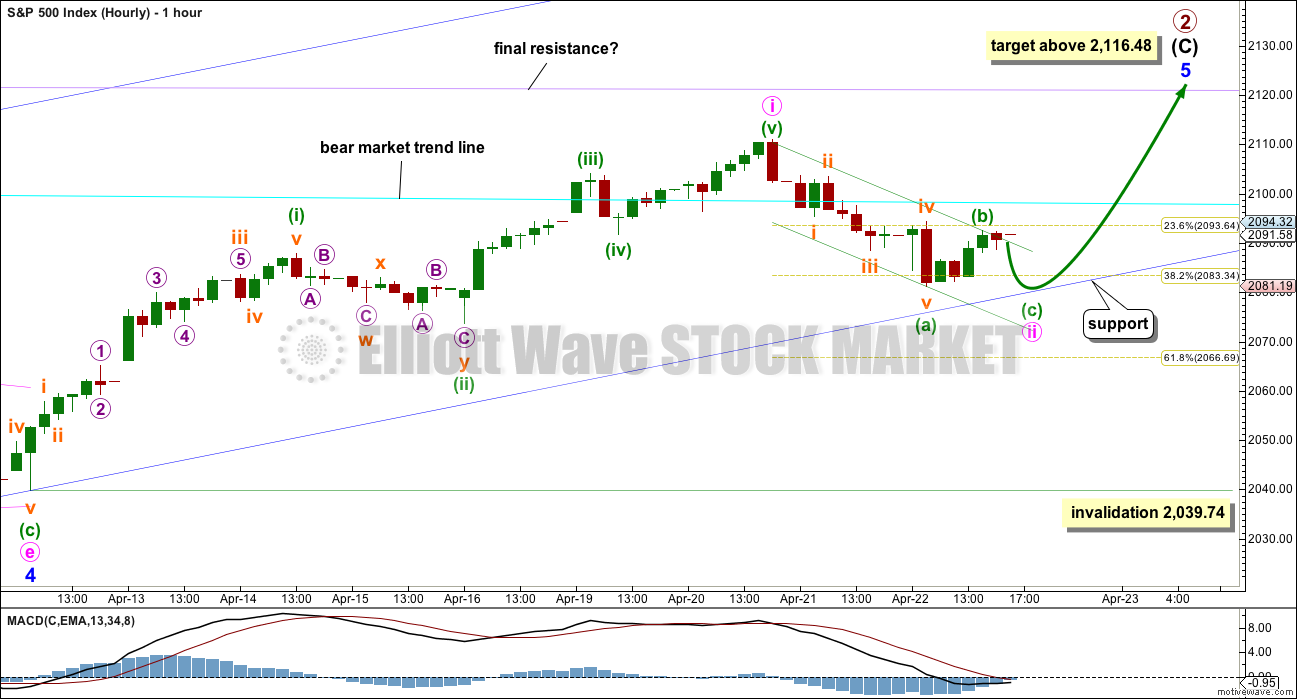
The easiest alternate idea is to always reduce or increase the degree of labelling for a movement. What if the impulse upwards which ended on 20th April was only minute wave i of minor wave 5?
Downwards movement may not be a fourth wave correction because it is back in what would be first wave price territory now labelled minuette wave (i).
Minute wave ii may end when price touches the lower edge of the blue channel. The lower edge of this blue channel is the same as the support line on the technical analysis chart. This line should provide support if minor wave 5 is incomplete.
So far minute wave ii is an incomplete zigzag. Minuette wave (a) subdivides neatly as a five. Minuette wave (b) may now be a complete zigzag, but it may also move higher when markets open next week.
Minute wave ii may not move beyond the start of minute wave i below 2,039.74. A new low below this price point would invalidate this first hourly Elliott wave count and confirm the alternate below.
ALTERNATE HOURLY CHART
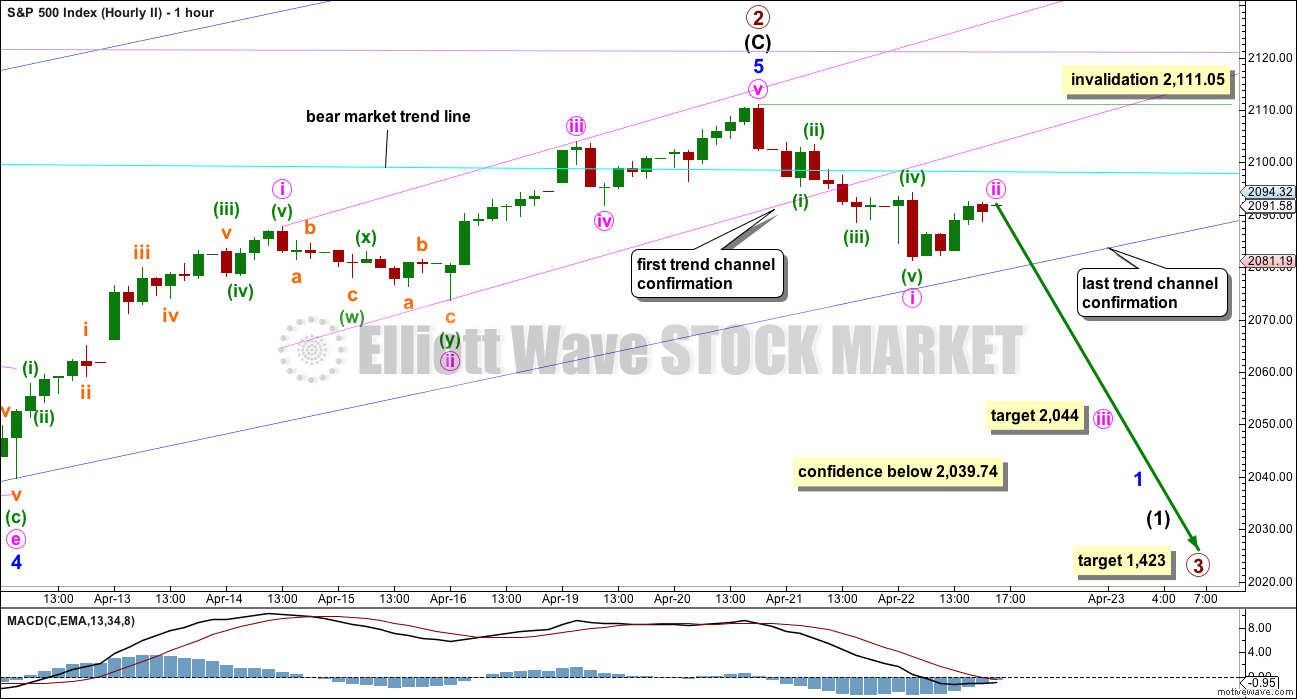
The entire structure of primary wave 2 may now be complete. This alternate wave count absolutely requires some confirmation before any confidence may be had in it.
Ratios within intermediate wave (C) would be: minor wave 3 has no Fibonacci ratio to minor wave 1, and minor wave 5 (if it is over) would be 3.21 points short of 0.618 the length of minor wave 1.
Ratios within minor wave 5 would be: minute wave iii would be just 0.67 points longer than 0.618 the length of minute wave i, and minute wave v would be just 0.59 points longer than 0.618 the length of minute wave iii and just 1 point longer than 0.382 the length of minute wave i.
For the first wave down, which may be minute wave i, ratios are: minuette wave (iii) is 0.75 points short of equality in length with minuette wave (i), and minuette wave (v) has no Fibonacci ratio to either of minuette waves (i) or (iii).
The pink channel is breached by downwards movement giving earliest indication of a possible trend change. Now there is earliest price indication of a trend change. A little confidence may be had in this wave count with the breach of 2,087.84.
A clear and strong breach of the dark blue channel would provide further confidence in a trend change. If that happens, then reasonable confidence may be had in this wave count, enough to use the lower edge of the blue channel as an entry point. If price throws back to find resistance at the blue channel after breaching it, that would be a low risk high reward opportunity to enter short. The risk would be at 2,111.05 or for the more adventurous trader at 2,134.72.
Finally, a new low below 2,039.74 would provide reasonable confidence in a trend change. The only question at that stage would be of what degree?
The first hourly wave count will remain valid while price remains above 2,039.74; it would be possible that price will continue higher. That is the risk with entering prior to confirmation of a trend change.
At 2,044 minute wave iii would reach 1.618 the length of minute wave i. This target may be met by the end of next week, depending on how time consuming the second and fourth wave corrections within the impulse of minute wave iii may be.
If primary wave 2 is over, then the target for primary wave 3 would be 2.618 the length of primary wave 1 at 1,423. That is the appropriate Fibonacci ratio to use when the second wave correction is so very deep, and here primary wave 2 would be 0.91 the length of primary wave 1.
Primary wave 1 lasted 98 days (not a Fibonacci number). Primary wave 2 may have lasted 140 days (four short of a Fibonacci 144). Primary wave 3 may be quick, but it still would have two sizeable corrections for intermediate waves (2) and (4) within it. An initial expectation may be for it to total a Fibonacci 144 or 233 days.
ALTERNATE WEEKLY CHART
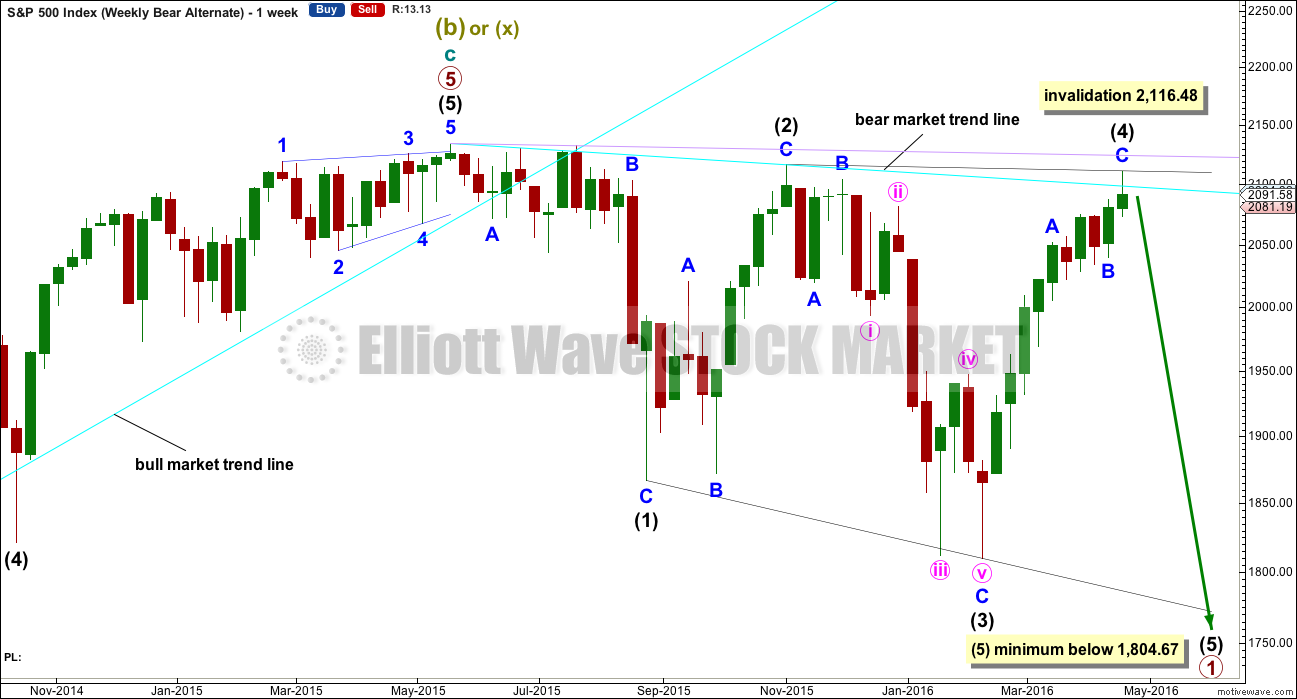
Primary wave 1 may subdivide as one of two possible structures. The main bear count sees it as a complete impulse. This alternate sees it as an incomplete leading diagonal.
The diagonal must be expanding because intermediate wave (3) is longer than intermediate wave (1). Leading expanding diagonals are not common structures, so that reduces the probability of this wave count to an alternate.
Intermediate wave (4) may continue higher now and may find resistance at the bear market trend line.
ALTERNATE DAILY CHART
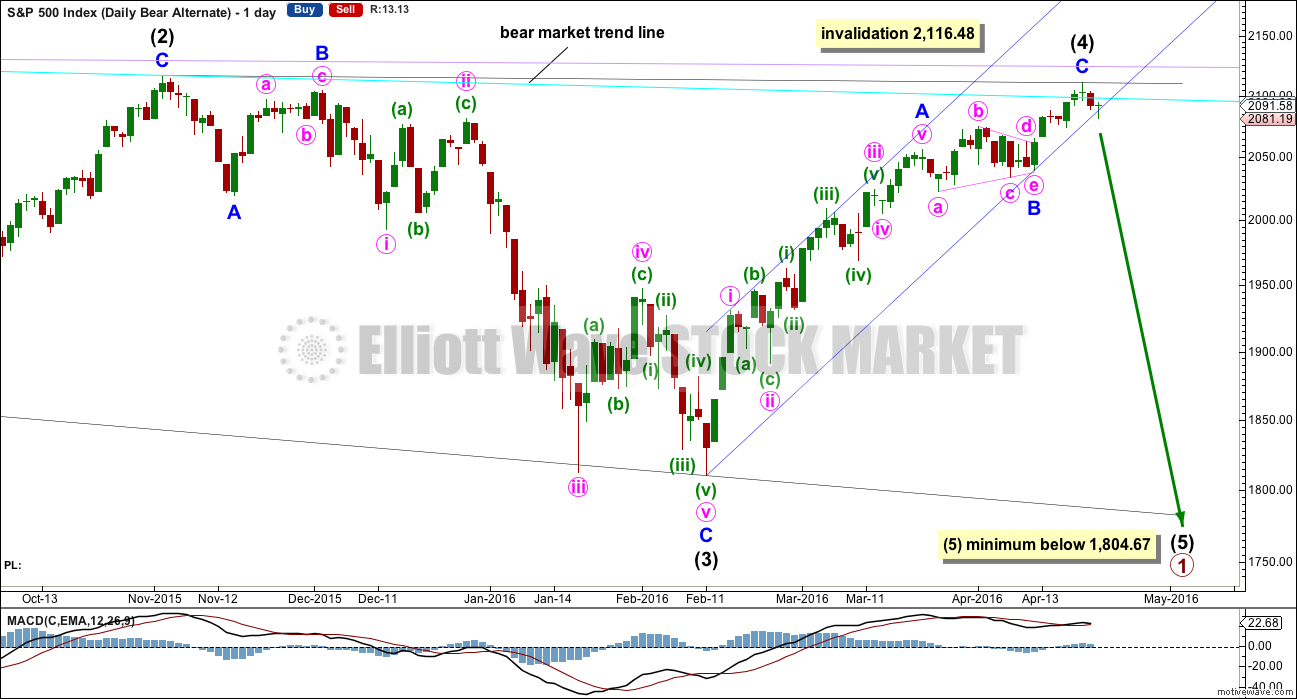
Within a leading diagonal, subwaves 2 and 4 must subdivide as zigzags. Subwaves 1, 3 and 5 are most commonly zigzags but may also sometimes appear to be impulses.
Intermediate wave (3) down fits best as a zigzag.
In a diagonal the fourth wave must overlap first wave price territory. The rule for the end of a fourth wave is it may not move beyond the end of the second wave.
Within diagonals the second and fourth waves are commonly between 0.66 to 0.81 the prior wave. Here, intermediate wave (2) is 0.93 of intermediate wave (1) and intermediate wave (4) is 0.98 of intermediate wave (3). This is possible, but the probability of this wave count is further reduced due to the depth of these waves.
Expanding diagonals are not very common. Leading expanding diagonals are less common.
Intermediate wave (5) must be longer than intermediate wave (3), so it must end below 1,804.67. Confirmation of the end of the upwards trend for intermediate wave (4) would still be required before confidence may be had in a trend change, in the same way as that for the main bear wave count.
BULL ELLIOTT WAVE COUNT
WEEKLY CHART
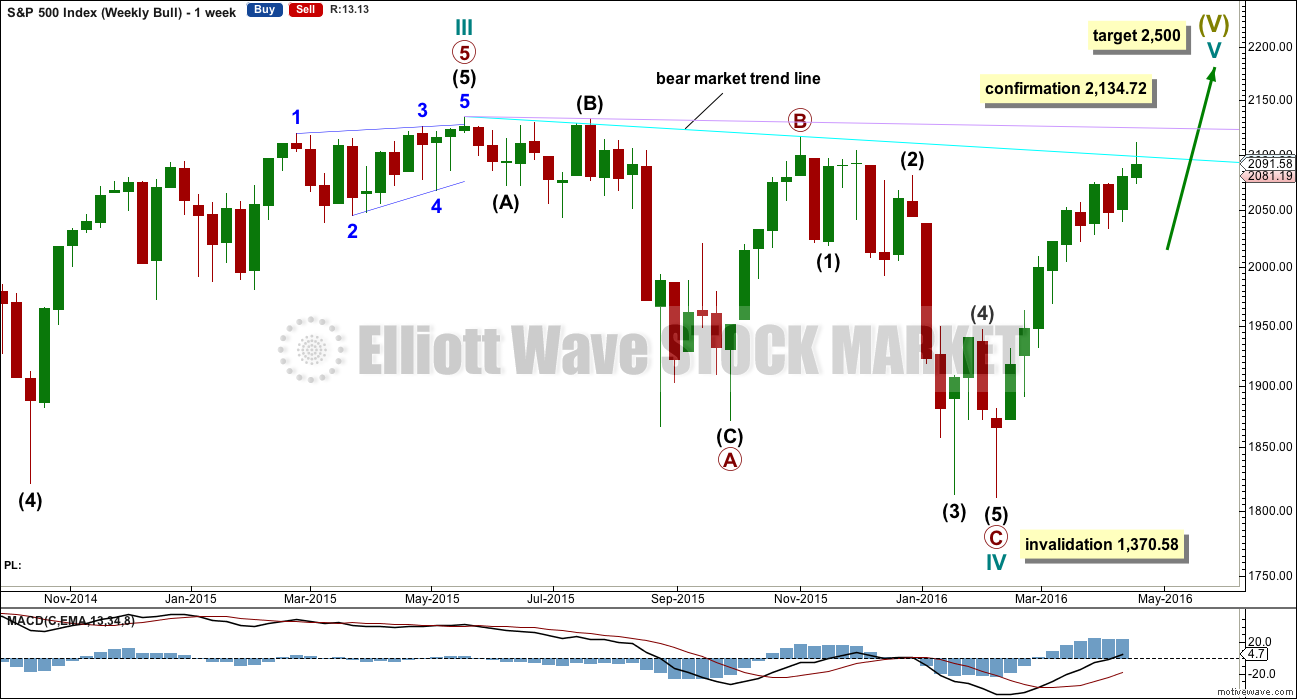
Cycle wave II was a shallow 0.41 zigzag lasting three months. Cycle wave IV may be a complete shallow 0.19 regular flat correction, exhibiting some alternation with cycle wave II.
At 2,500 cycle wave V would reach equality in length with cycle wave I.
Price remains below the final bear market trend line. This line is drawn from the all time high at 2,134.72 to the swing high labelled primary wave B at 2,116.48 on November 2015. This line is drawn using the approach outlined by Magee in the classic “Technical Analysis of Stock Trends”. To use it correctly we should assume that a bear market remains intact until this line is breached by a close of 3% or more of market value. In practice, that price point would be a new all time high which would invalidate any bear wave count.
This wave count requires price confirmation with a new all time high above 2,134.72.
While price has not made a new high, while it remains below the final bear market trend line and while technical indicators point to weakness in upwards movement, this very bullish wave count comes with a strong caveat. I still do not have confidence in it.
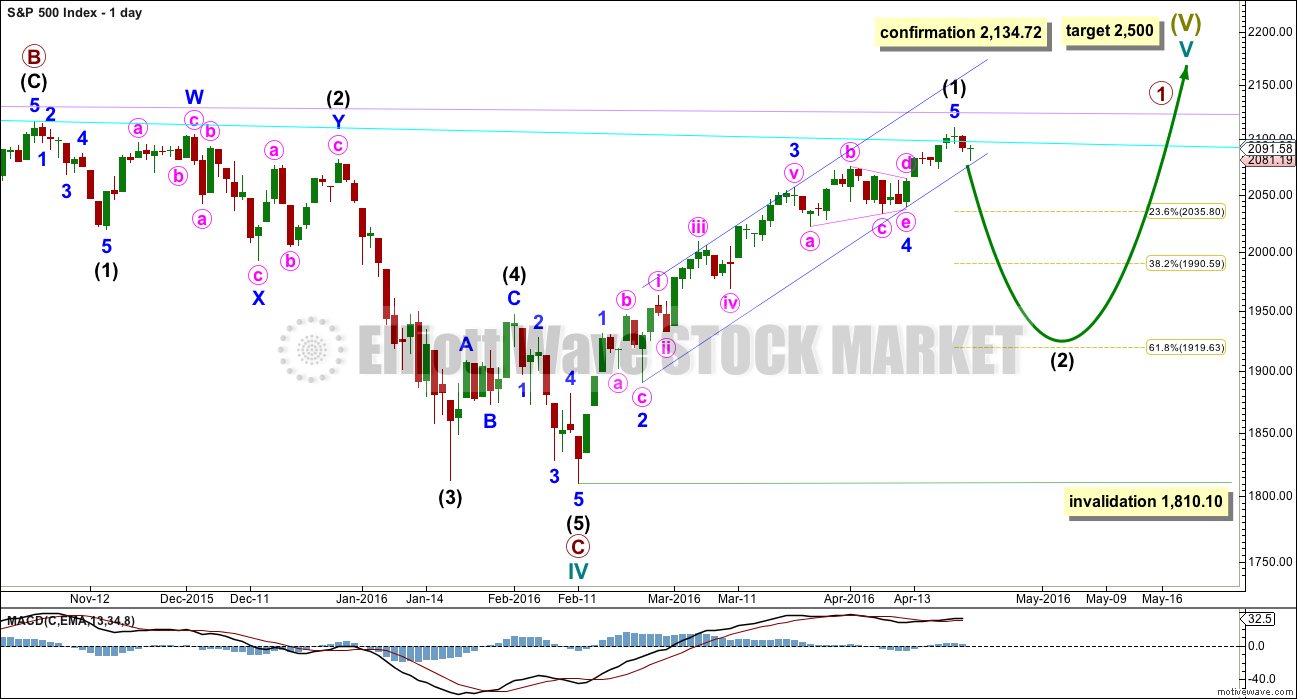
DAILY CHART
Intermediate wave (2) is seen as an atypical double zigzag. It is atypical in that it moves sideways. Double zigzags should have a clear slope against the prior trend to have the right look. Within a double zigzag, the second zigzag exists to deepen the correction when the first zigzag does not move price deep enough. Not only does this second zigzag not deepen the correction, it fails to move at all beyond the end of the first zigzag. This structure technically meets rules, but it looks completely wrong. This gives the wave count a low probability.
If the bull market has resumed, it must begin with a five wave structure upwards at the daily and weekly chart level. That may today be complete. The possible trend change at intermediate degree still requires confirmation in the same way as the alternate hourly bear wave count outlines before any confidence may be had in it.
If intermediate wave (2) begins here, then a reasonable target for it to end would be the 0.618 Fibonacci ratio of intermediate wave (1) about 1,920. Intermediate wave (2) must subdivide as a corrective structure. It may not move beyond the start of intermediate wave (1) below 1,810.10.
In the long term, this wave count absolutely requires a new high above 2,134.72 for confirmation. This would be the only wave count in the unlikely event of a new all time high. All bear wave counts would be fully and finally invalidated.
TECHNICAL ANALYSIS
DAILY CHART
Click chart to enlarge. Chart courtesy of StockCharts.com.
Volume data on StockCharts is different to that given from NYSE, the home of this index. Comments on volume will be based on NYSE volume data when it differs from StockCharts.
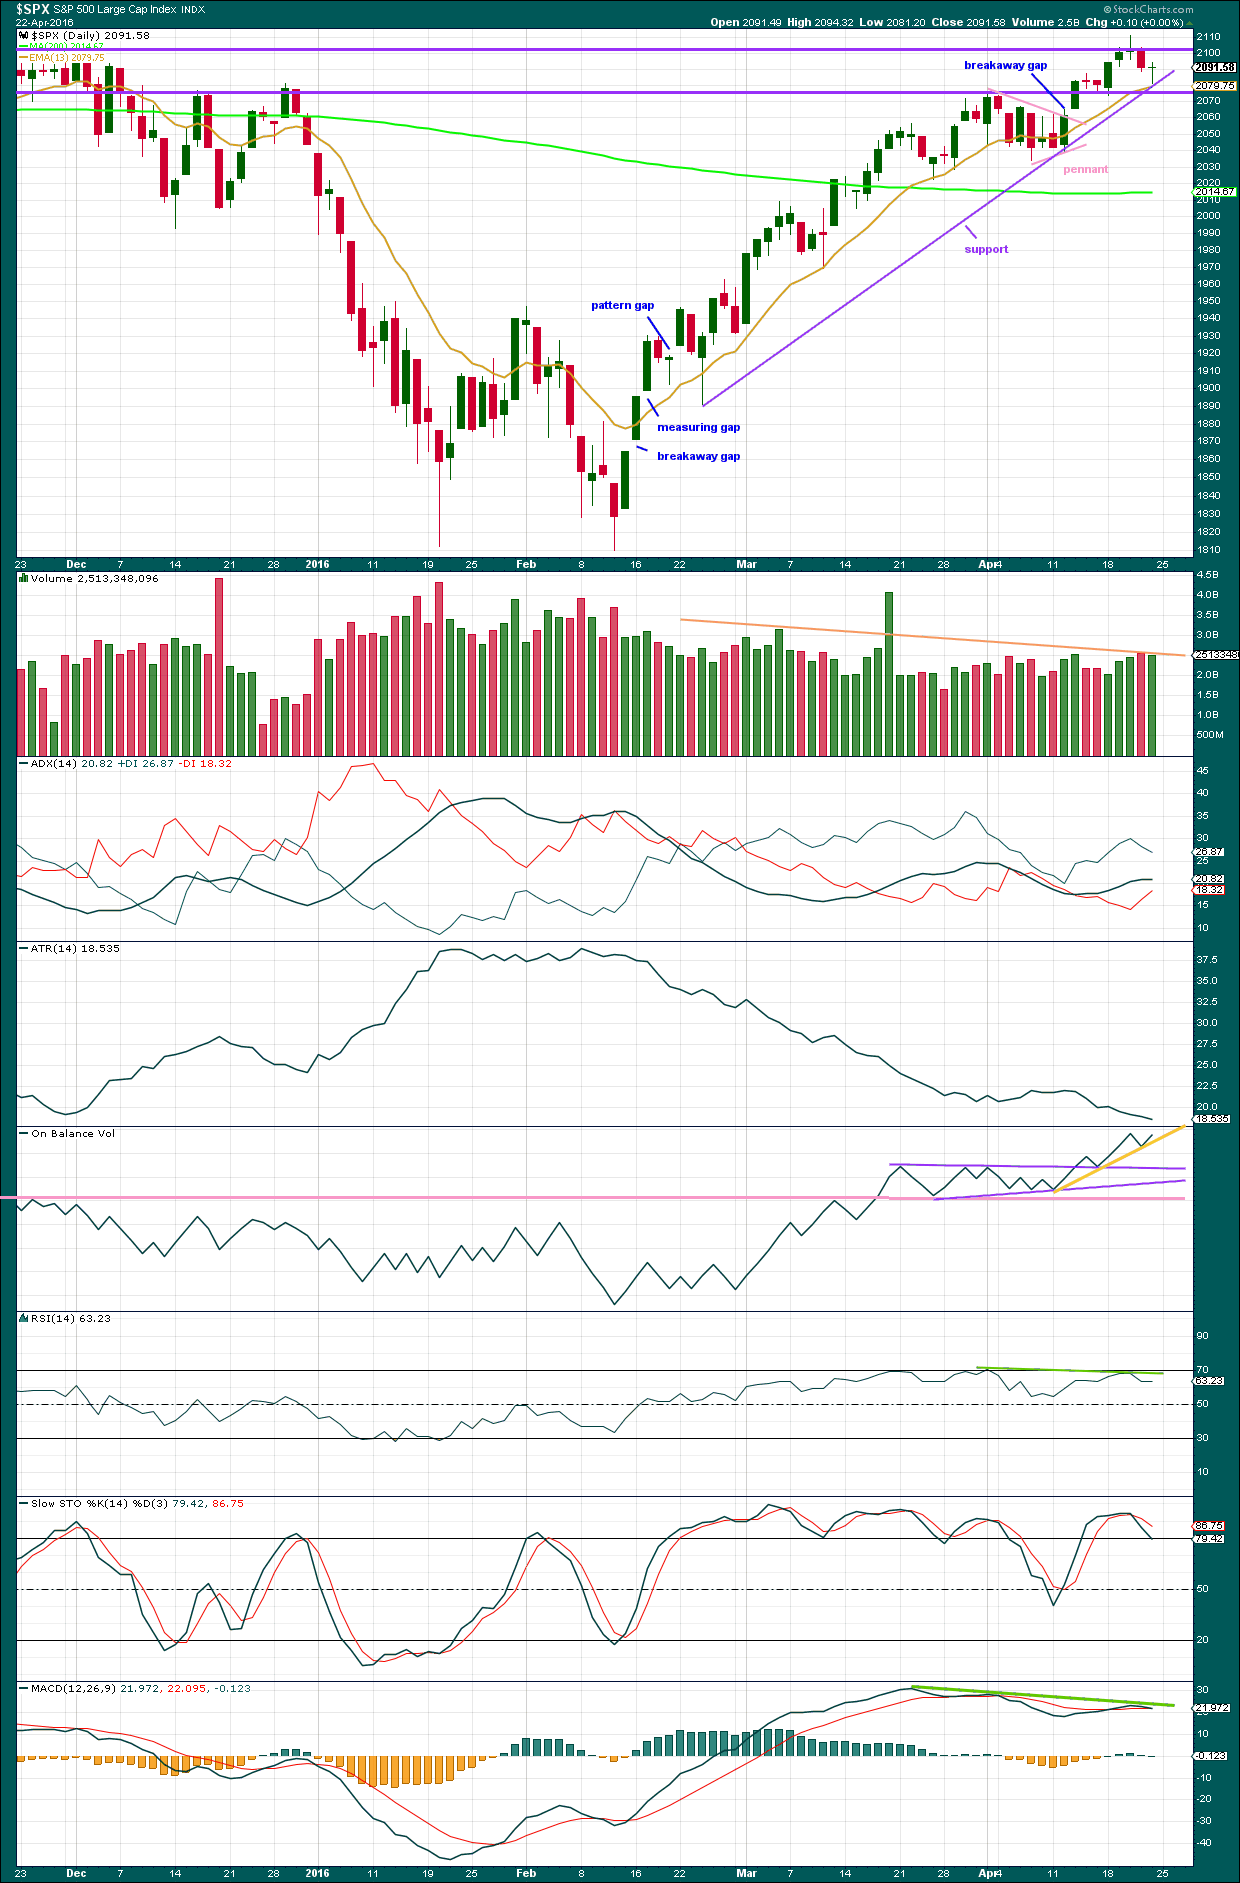
The line in the sand for a trend change is the upwards sloping purple support line. This is the same as the lower edge of the blue channel on the main daily Elliott wave count. A breach of this bull market trend line would indicate the trend (at least short to mid term) has changed from bull to bear. While price remains above that support line it should be expected that price may find support there.
An Evening Doji Star candlestick pattern is completed at the last high. This is a reversal pattern and offers some support for expecting a high is in place.
How price behaves if it comes down to this line will indicate which hourly Elliott wave count is correct and if price is beginning either a large correction (bull wave count) or a new big wave down (bear wave count). For clues as to whether the line may be breached sooner or later we can look to volume, momentum, breadth, strength and sentiment.
Volume: Overall, now volume declines as price has been rising for over 40 days. In the short term, the downwards day of 21st April comes with an increase in volume supporting the downwards movement in price. Downwards volume for 21st of April is stronger than the prior three upwards days. Volume for Friday’s small green doji is lighter than the prior downwards day, offering some slight support for a trend change. The overall rise in price to complete a green candlestick was not as well supported by volume than the prior downwards day. Volume indicates the upwards movement is unsupported and unsustainable. A relatively large correction at least would be expected.
On Balance Volume: To date this indicator has been providing bullish signals along with rising price. OBV will remain bullish while OBV finds support at all the trend lines drawn here. A break below the yellow line would be a weak bearish signal. A break below the purple lines would be reasonable bearish indication. A break below the pink line would be a strong bearish signal. OBV has not given any bearish signals yet, only bullish. In this instance, unfortunately, OBV may not lead price for us.
Momentum: MACD shows divergence with price (green line) back to 22nd March. With reasonably long held divergence, this indicates momentum is weak.
Breadth: As given in charts below, the AD Line and Bullish Percent both indicate breadth to this upwards movement, but there is hidden bearish divergence. The increase in breadth is not translating to a corresponding increase in price; price is weak.
Strength: RSI has some slight divergence with price (green line). RSI has failed to make corresponding highs as price has made new highs. This indicates weakness in price.
Sentiment: As given in COT charts below, up to 18th April, commercials are more strongly short than long and non commercials more strongly long than short. This is bearish.
Conclusion: The bearish case at least short / mid term is supported by volume analysis but not On Balance Volume. The divergence in momentum, breadth and strength indicators supports a bearish outlook over a bullish outlook. Sentiment of commercials is also bearish. Overall, the balance of this picture is predominantly bearish. The support line should be expected to most likely be breached if price again comes down to it. But first it may provide some support for a small bounce. If it is breached, then look for a potential throwback to find resistance. If price behaves like that, then take the opportunity to enter short there.
INVERTED VIX DAILY CHART
Click chart to enlarge. Chart courtesy of StockCharts.com.
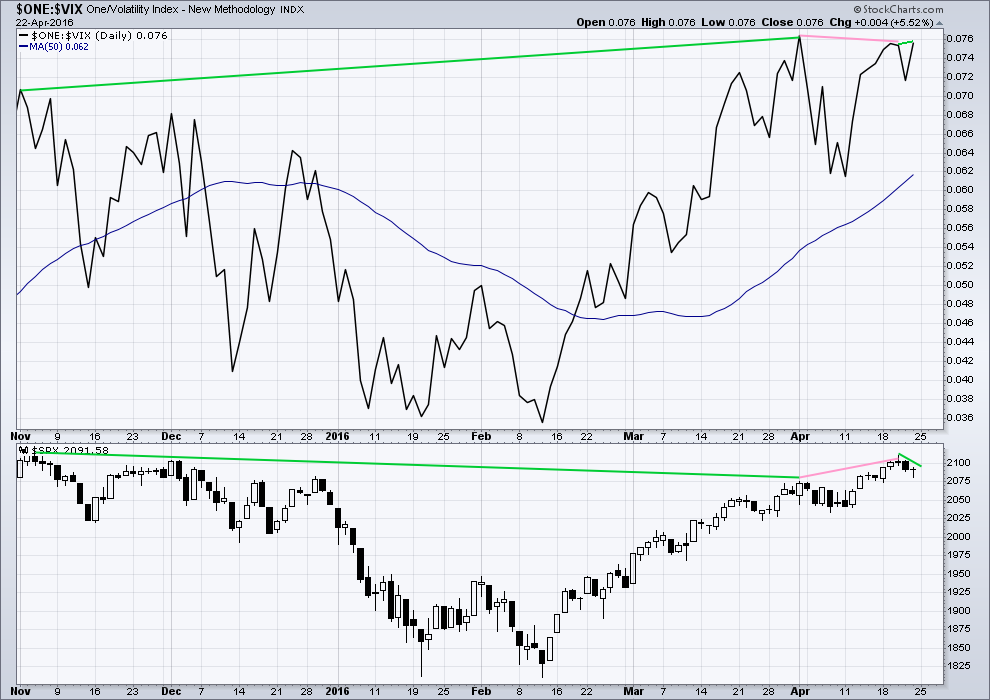
Volatility declines as inverted VIX climbs. This is normal for an upwards trend.
What is not normal here is the divergence over a reasonable time period between price and inverted VIX (green lines). The decline in volatility is not translating to a corresponding increase in price. Price is weak. This divergence is bearish.
Price made a new short term high, but VIX has failed to make a corresponding high (pink lines). This is regular bearish divergence. It indicates further weakness in the trend.
Friday’s small green doji candlestick overall saw sideways movement in price, closing very slightly up for the day. Yet inverted VIX has made new highs above the prior high of 20th and 19th of April. Volatility declined for Friday, but this was not translated into a corresponding rise in price. Again, further indication of weakness in price is indicated. This is further hidden bearish divergence.
BULLISH PERCENT DAILY CHART
Click chart to enlarge. Chart courtesy of StockCharts.com.
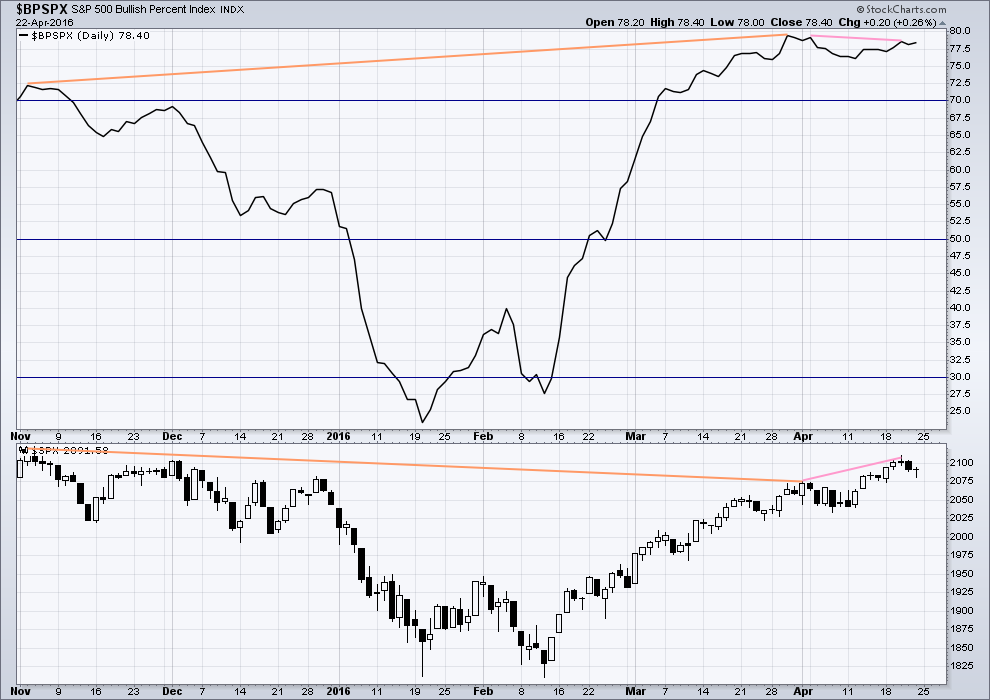
With this indicator measuring the percentage of bullish equities within the index, it is a measurement of breadth and not sentiment as the name suggests.
There is strong hidden bearish divergence between price and the Bullish Percent Index (orange lines). The increase in the percentage of bullish equities is more substantial than the last high in price. As bullish percent increases, it is not translating to a corresponding rise in price. Price is weak.
As price made a new short term high 20th April, BP did not (pink lines). This is regular bearish divergence. It indicates underlying weakness to the upwards trend.
ADVANCE DECLINE LINE
Click chart to enlarge. Chart courtesy of StockCharts.com.
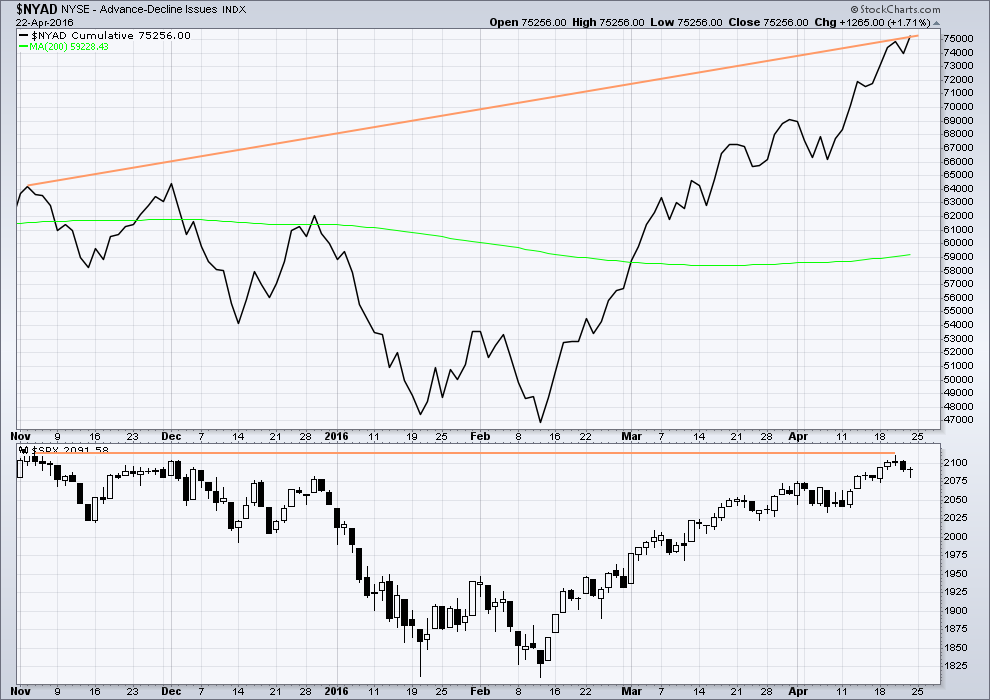
With the AD line increasing, this indicates the number of advancing stocks exceeds the number of declining stocks. This indicates that there is breadth to this upwards movement.
From November 2015 to now, the AD line is making new highs while price has so far failed to make a corresponding new high. This indicates weakness in price; the increase in market breadth is unable to be translated to increase in price.
It remains to be seen if price can make new highs beyond the prior highs of 3rd November, 2015. If price can manage to do that, then this hidden bearish divergence will no longer be correct, but the fact that it is so strong at this stage is significant. The AD line will be watched daily to see if this bearish divergence continues or disappears.
At the end of this week, price has made new short term lows for Thursday and Friday yet the AD line has made a new high on Friday. Friday saw more stocks advancing than declining, but this was unable to translate into a rise in price. Again, this is hidden bearish divergence (short term) indicating price is weak.
The 200 day moving average for the AD line is now increasing. This alone is not enough to indicate a new bull market. During November 2015 the 200 day MA for the AD line turned upwards and yet price still made subsequent new lows.
COMMITMENT OF TRADERS (COT)
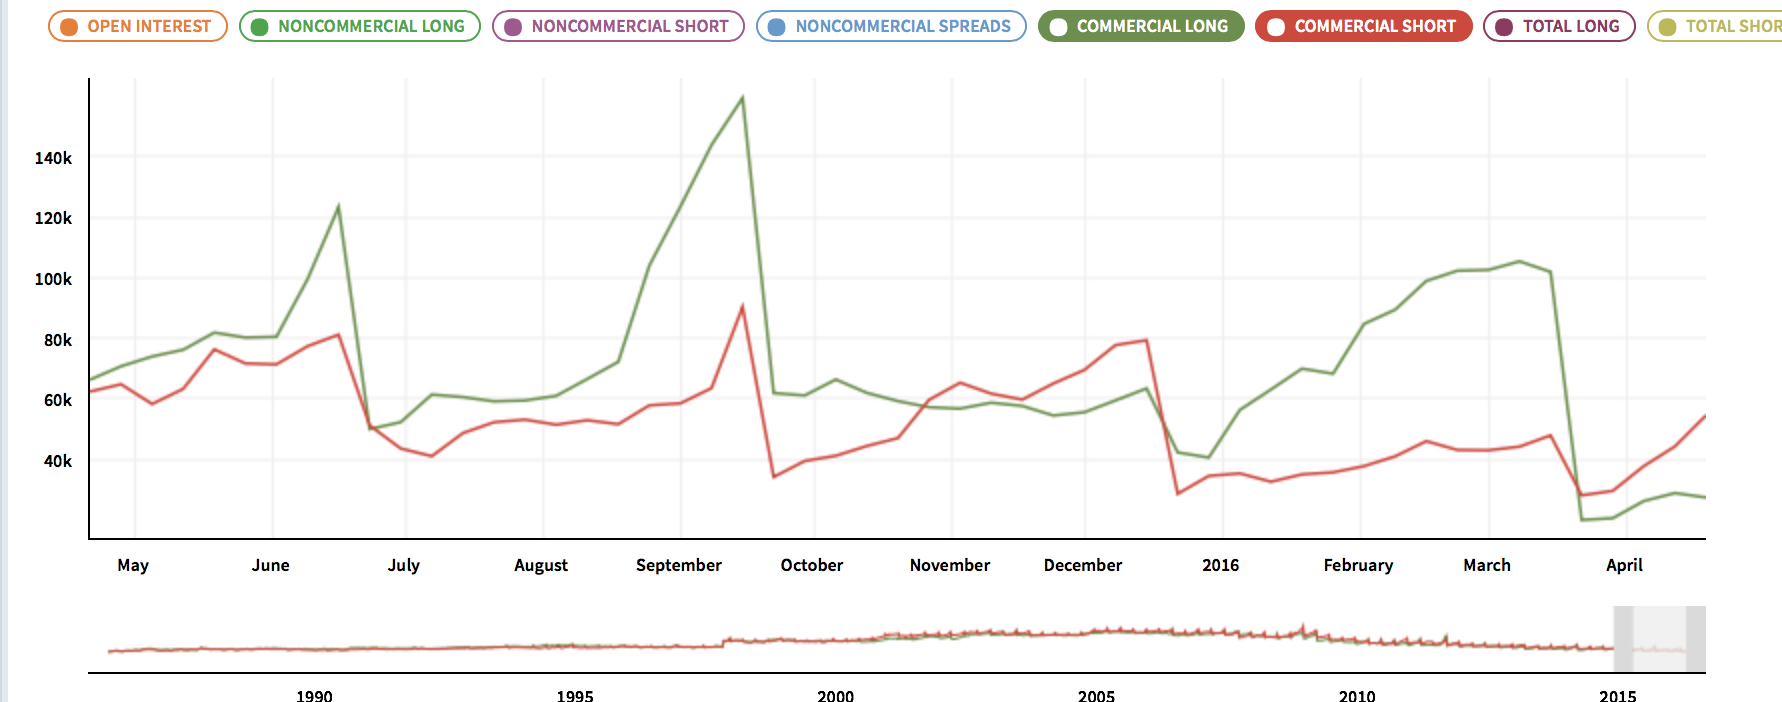
Click chart to enlarge. Chart courtesy of Qandl.
This first COT chart shows commercials. Commercial traders are more often on the right side of the market. Currently, more commercials are short the S&P than long. This supports a bearish Elliott wave count, but it may also support the bullish Elliott wave count which would be expecting a big second wave correction to come soon. Either way points to a likely end to this upwards trend sooner rather than later. Unfortunately, it does not tell exactly when upwards movement must end.
*Note: these COT figures are for futures only markets. This is not the same as the cash market I am analysing, but it is closely related enough to be highly relevant.
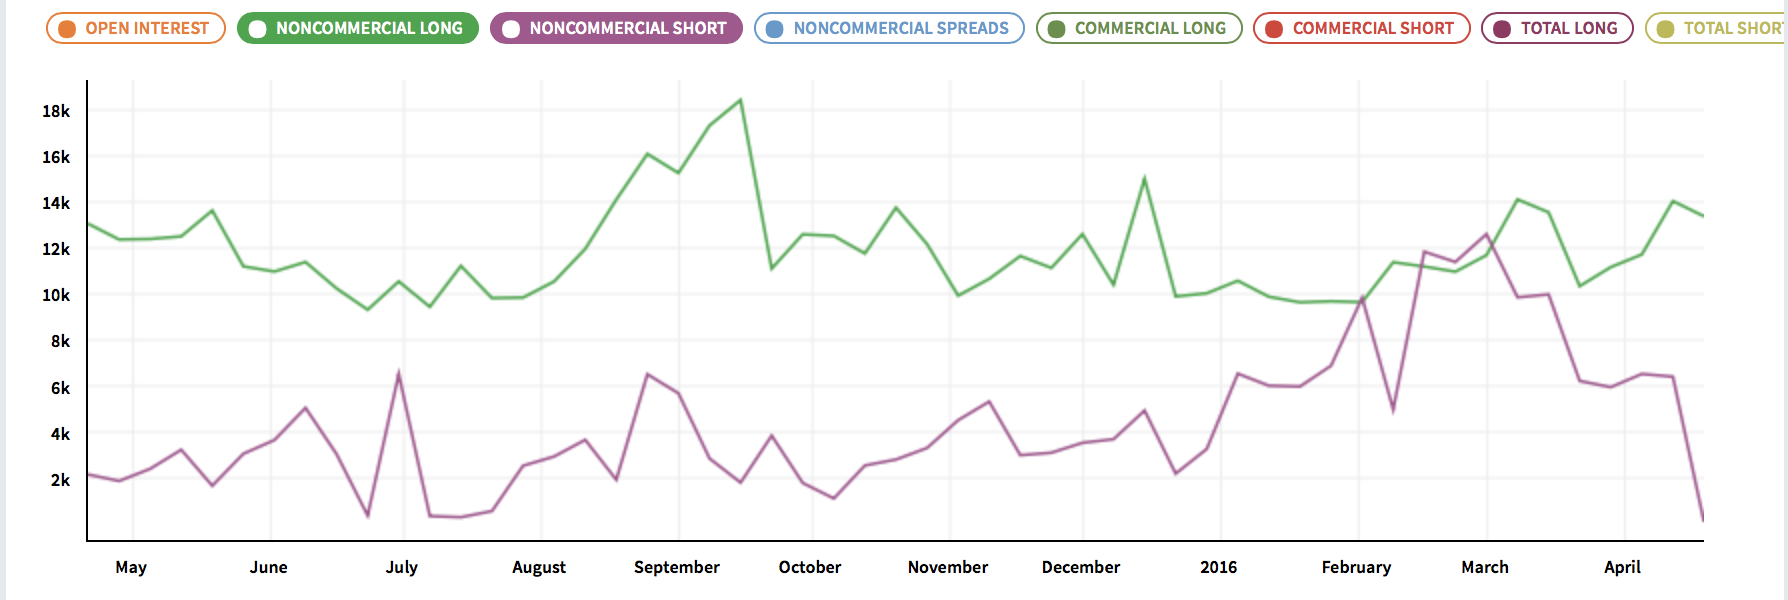
Click chart to enlarge. Chart courtesy of Qandl.
Non commercials are more often on the wrong side of the market than the right side of the market. Currently, non commercials are predominantly long, and increasing. This supports the expectation of a trend change soon.
DOW THEORY
I am choosing to use the S&P500, Dow Industrials, Dow Transportation, Nasdaq and the Russell 2000 index. Major swing lows are noted below. So far the Industrials, Transportation and Russell 2000 have made new major swing lows. None of these indices have made new highs.
I am aware that this approach is extremely conservative. Original Dow Theory has already confirmed a major trend change as both the industrials and transportation indexes have made new major lows.
At this stage, if the S&P500 and Nasdaq also make new major swing lows, then my modified Dow Theory would confirm a major new bear market. At that stage, my only wave count would be the bear wave count.
The lows below are from October 2014. These lows were the last secondary correction within the primary trend which was the bull market from 2009.
These lows must be breached by a daily close below each point.
S&P500: 1,821.61
Nasdaq: 4,117.84
DJIA: 15,855.12 – close below on 25th August 2015.
DJT: 7,700.49 – close below on 24th August 2015.
Russell 2000: 1,343.51 – close below on 25th August 2015.
To the upside, DJIA has made a new major swing high above its prior major high of 3rd November, 2015, at 17,977.85. But DJT has so far failed to confirm because it has not yet made a new major swing high above its prior swing high of 20th November, 2015, at 8,358.20. Dow Theory has therefore not yet confirmed a new bull market. Neither the S&P500, Russell 2000 nor Nasdaq have made new major swing highs.
This analysis is published @ 12:05 a.m. EST on 23rd April, 2016.

Price is finding support right at the lower edge of the channel.
If it can break through that favours a bearish scenario.
If it can’t, well we should expect new highs.
How it behaves here is indicative.
I can see another five down from 2,092.51.
And now so far a three up which is very close to 0.618 of the five down.
For the main hourly minute wave ii is now a completed A-B-C zigzag. Finding support right at the lower blue trend line. For this wave count price now must move up up and away, with some increase in momentum as it should be a low degree third wave. Confirmation 2,111.05.
For the alt hourly there are now two first and second waves complete. It has to turn down and tomorrow should break below the lower blue trend line. After that, maybe the throwback I’m hoping for? Confirmation first a breach of the blue trend line, price confirmation 2,039.74
Looks to me like we may have completed five down from the high at 2011 to today’s low at 2077. It is easiest to see on the 5 minute chart. If this proves to be correct, we can now expect a wave two to retrace 38% at 2090, 50% at 2094, or 61% at 2098.
Rodney, are you suggesting we’re in hrly or alt hourly? a second waave within what degree please?
I think he means ALT hourly at minute degree.
Whilst we remain below 2110 and above 2039 it can go either way – certainly whilst it’s in the middle of the range like now it is a ‘Sit on Hands’ moment imho. The higher we go towards that range, the better the risk reward on a short – the lower the better the risk / reward on a long, albeit things get suspicious beyond 76.4% fib retrace of a minute (ii) in either direction.
I can still see a good case for both the ALT and main count.
I am not suggesting either count. I am only suggesting we may have a completed five wave impulse down which may be followed by a correction. The actual count is still multiple possibilities.
Lara suggested in Bear Count Hourly II that a five wave impulse down could have completed last week at 2081. I am saying that 2081 may have been the end of wave iii with wave v completed this morning.
All wave counts as presented by Lara are all still open and possible. Nothing has yet been violated or invalidated etc.
Sorry for any confusion.
Ah. Thanks for the clarification. I look to Lara to see if she moves the end of minute i to either low of today.
Maybe or it could be as lara said “quote”
Minute wave ii may end when price touches the lower edge of the blue channel. The lower edge of this blue channel is the same as the support line on the technical analysis chart. This line should provide support if minor wave 5 is incomplete.
Good point Malcom and that is exactly what we are seeing, support and a bounce off that line.
Very quiet here today.
The daily candle stick pattern, if it holds, is very bearish. Fifth day of the pattern… today is further confirmation, again… if it holds.
Yes. Nison says that the days following the Evening Star Doji ( or Evening Doji Star) must support the idea of a reversal. I think you are correct in that we have the support. And now I think we have the beginnings of EW support with 5 down from 2011. Awesome! (if it is correct, of course)
Yep. So far it’s looking very bearish.
And if that’s right, it’s moving slowly to start. Which is a gift. It allows us time to position ourselves with relatively low risk as price is close to the start of it.
But while price is within the channel and above 2,039 it could go either way.
VIX is up 10% +.
UVXY & TVIX up only 5%.
Interesting to say the least.
That’s weird. VIX is up while price is down?
I look for that kind of divergence before a big move… it’s often what it seems to predict.
Move up from Fridays low very likely to be an expanded flat correction with this move below 2086. Could still have only been wave (a) of a larger abc minute (ii) correction with wave (b) unfolding now.
The whole minute (ii) correction is currently a bit shallow (only reaching 38.2 fib) so I am thinking this is minuette (b) of minute (ii) now, albeit the pull of a strong 3rd down might mean we start seeing shallower corrections.
Above 2082.17, the whole move could still be seen as a couple of 1,2s but that looks less probable atm imo.
3-3-5 completed from the low of 2081. I think it is a good chance you are correct in that we are now in wave b of a larger abc minute ii correction.
However, we are headed down hard now at 2083. Let see how it reacts to the 2080 level and if we get another clear five down.
2073 is my next level of interest – below there we will have broken out of the base channel of the move down from 2111 and also below (Alternate Hourly) minute (ii) of Minor 5.
We are currrently poking through the lower blue trendline drawn on Laras chart – though I have been burnt trusting broken major trendlines on S&P quite a few times. Low degree wave trendlines tend to be respected more often.
It will still stay guesswork though until we take out 2039 (or go above 2111) as this could all still be minute (ii) of Minor 5 as per Laras chart.
2056 is the 76.4 retrace of possible minute (i) of Minor 5 – below there the odds of this being minute (ii) of Minor 5 drastically reduce imho.
The Heisenberg uncertainty principle postulates that it is not possible to precisely know both the position and the displacement of an observed object since the act of observation affects both- by the time the information gets back to your retina, they both would have changed. On the photonics level it speaks to the idea of the particulate nature of light.
A lot of traders are starting to wonder why so may formerly reliable market metrics no longer seem to provide reliable information about what the market is going to do. Metrics like volume, sentiment, and a host of others I could cite seem to continue at extremes interminably. Last month the price of VIX call options versus puts at the same strike implied a market much lower than where we are to day – it was a 16 to one disparity. Any trader who relied solely on that indicator with only a month to expiration took a big loss on that trade.
Some traders are concluding that so many people are now looking at the same market measures that what used to be reliable signals now no longer work because so many people are looking at them. In fact I saw some data from a very good trader who clearly showed me several instances in the market where a clear doji after a significant uptrend was followed by more manic upward movement and contended folk who continued to use it as a trend reversal signal in those instances had their heads handed to them.
I guess the point of all this is to recognize that the market is a dynamic environment and it sometimes requires us to change our approach when things that used to work reliably no longer do.
My personal view is that many of the distortions we are seeing in the market can be attributed to unprecedented central bank participation, issuing in extended and more complex waves than would observed without such intervention. I know that not everyone subscribes to the theory but that is my personal opinion.
The one thing that no amount of central bank manipulation can alter is human nature. The fundamental drivers of market action may be distorted, but not denied. Those drivers are of course greed, and fear.
When I look at where the markets are today, and when I consider the kind of headwinds preparing to descend on global equities, I have to concede that central banks have succeeded beyond their wildest dreams in stoking market greed to unprecedented levels.
Oh, I know about all the stock buybacks which have been nothing but a con game to allow all the insiders to cash out leaving suckers holding trillions in corporate bonds that will never be repaid( many of which are in pension funds) but the fact is someone is buying those bonds and therefore bullish on the market, and in addition to the buybacks, retail investors are still buying this market.
There is nothing new under the sun.
As night follows day, so fear must follow greed.
Human nature never changes.
How much fear? When you consider the the amount of greed evidenced by market price today, what do you think?
I still trust the VIX.
The Heisenberg uncertainty principle. Hmm. Very interesting. Thanks Verne. I love reading your philosophical, theoretical, sociological and economic musings. First a question. Are you now or have you ever been a university professor?
I like your contemplation and your friend’s observation. I do think the central banks are in collusion and the only institutions with the power to manipulate the markets longer term, years. I also believe most markets are rigged from time to time as well. I am not sure I would go any further in conspiracy theories. But this six or seven year bull market did not come about because of production or productivity improvements or resource development throughout the world. It is all based on printing money and forcing it into the system. The money has ended up in the illusion of wealth creation through the stock markets. It cannot continue forever. US equity PE ratios are averaging around 27. The highest in history. There are more and bigger financial bubbles in place today than ever before in the history of the world. If they all start popping in unison or succession, it will change our world being much worse that 2000 and 2008.
Is now the time it all comes tumbling down. We don’t know. No one does, yet. It may be. But we do know the US equity market is due for a correction. At least we used to know that based on TA. We could consolidate as well burning off the over bought condition before a continuation of the bull rally.
I am persuaded now is the time for the big move to begin and be well on its way by US election time. That is where I have placed my bets.
There is nothing new under the sun. King Solomon wrote that in the Book of Ecclesiastes about 3500 years ago and it is still true today.
My forays into the world of University pedagogy were limited to my days as a graduate teaching assistant herding wide-eyed U of I Chemistry students. My wife is the one with a flair for academia… 🙂
I agree. The bankers have printed a lot of money and its ended up on the financial markets. And in NZ here its also in the property market.
It’s the same old scenario all over again.
Every bubble in the history of bubbles is at its heart a debt bubble. Inflated by greed, fuelled by debt, and propelled downwards after by fear.
If metrics like volume and sentiment are running at extremes for longer than normal then maybe it’s because this market is extreme? Maybe we’ll all look back in a few months and say it indicated a huge move.
Isn’t it luck for us that human nature never changes? If we can anticipate it we can make handsome profits from this tendency.
The S&P is essentially “boxed in”. Entering a huge sideways move since October 2014. That’s a box lasting 18 months. It will break out. And when it does the duration of the box indicates a huge move.
*Doji on their own aren’t reversal signals. They are if part of an evening or morning star pattern. Otherwise just an indication of caution when they turn up in a trend. They have no significance in a consolidation.
In addition to the central banks there is a global rebalancing going on seeking safety.
Wealthy Chinese have bought 66% of high end recent home purchases in Vancouver, and many homes then sit vacant. Lots of money being rapidly shifted all over the world so when bad things happen there will be durable assets that can survive. People make bets like this when there is fear things are going to hit the fan.
The U.S. stock market has a lot of credibility because there is the feeling the central banks will step in to stabilize it. So it is a magnet for money especially when they see the massive gains that can be had of late.
As Lara points out bubbles are human nature fueled by greed and fear. In the U.S. stock market there is also FMO the “fear of missing out” on the huge gains of the last two months, and the fear of missing out on the new bull market.
If your account is up 25% in the last two months run up, you are likely a bit nervous and don’t intend on giving back your huge gains. If things start going south, these people will protect their capital and get out, immediately. That is the waterfall sell off that send dominoes flying.
We have the same problem here in New Zealand with land sales to non residents or non citizens. Our government has its head in the sand, and has only in the last couple of months begun to collect data. Which it’s not yet shared with the citizens.
But we see our property advertised overseas, and bus loads of non citizens visiting and buying up multiple properties.
And we’re a small island nation.
This is most likely fuelling our property market bubble.
But the fuel from hot foreign money (there’s no capital gain tax in NZ) looking for a place to park or make capital gains is interpreted by local real estate folk as meaning the bubble can’t burst. Because there’s an almost never ending stream of new rich buyers.
NZers on our pathetic low average incomes (one of the lowest in the OECD) can’t compete with the large number of wealthy foreigners. And our home ownership rate is declining substantially, our overcrowding rate is increasing, and the homelessness rate is increasing. It’s very sad actually.
The bubble will burst. They always do.
I’ve read and seen video of the ghost towns and apartment blocks in China. “investments” which then sit empty.
That says bubble too.
We also have many homes sitting vacant. Our last census showed about 20,000 vacant homes in Auckland. That’s a city of only about 1.4 million people. So that’s quite a lot.
I am presenting you with a fun, but real, exercise because I face a sort of dilemma.
So here is my dilemma. I have some time available this week where I can go to the mountains / wilderness for a few days. My schedule is clear and I have no obligations to meet this week. I am thinking of leaving Tuesday after the close and being back home on Friday afternoon. I have not been to the mountains in over a month and my heart is aching not to mention my dog’s longing for the wilderness. But this week may be one of the most important weeks of the year as far as the stock markets go.
I have 7 of 8 wagons filled with short positions. I want but do not need to fill the last wagon. Either way, it is a large position (for me % wise of total portfolio). I am using a mental stop loss point. I said early on as I entered these positions that I could take the heat (for a few positions) all the way up to 2100+. But the possibility exists for the market to go against me.
The last time I took such a trip under similar conditions, I was caught in a major unexpected snow storm from which 5 other people needed to be rescued. I made it out with only a mild case of frost bite to fingers and toes. When I got home, my positions had been stopped out as the market moved against me. Then it reversed and went in the anticipated direction. I missed a good opportunity to re-enter and make a profit.
My question to you is, “What do you think I can or should do?”
The winner of the exercise, should there be one, earns the right to attend me into the dark, deep wildernesses of North America.
I’m not a regular on this forum, although I do read it daily. But for what it’s worth:
Take the wilderness trip! It will help you clear your mind. Also keep in mind, 2 weeks ago we thought last week would be a big week. And next week might again turn into the week after and so on.
Plus u already have 7 wagons filled. And you can always fill it up later when we have more confirmation; and when we have a correction after the confirmation.
Let me know if I win… 🙂
The concern is leaving those wagons unattended.
Take the wagons with you,, no tech access? you going to Mt Hood?
The wagons would never make it where I am going. Not Mt. Hood. Far too many people. Where I am going I most likely will not see any people the entire time.
But I will follow an ancient trail used by the first gold miners in this particular area. No miners left, just remnants. And definitely no tech access except GPS and I do not carry a satellite phone to contact my broker.
Sounds like you did everything right on your last trip. Continue to execute your trading plan. If you are away and don’t have access to your accounts, then enter your stops. Enjoy your hike and be safe!
If you place a hard stop then to allow the market room to move it should be at (just above) 2,134.72.
But that may mean too great a loss if the market goes against you short term, if price keeps going up for now.
You hit it on the head. I am not sure I want to exit that far away. On the other hand, it is less than another 20 SPX points above 2016 or so. Plus I have to translate the 2035 price into the price of my vehicle. Verne once mentioned having the ability to make contingent trades. I wish I had that ability but my current brokerage does not allow that. I will be switching some time later this year.
In addition, right now I have a mental stop which I only employ when I am able to be at the computer almost full time. I can watch wave development and make decisions on the run so to speak. But it takes great discipline to carry it out this way.
But if I am gone, I need to guess ahead of time. I will not make my decision to go to the mountains until Tuesday some time. If we break down, then I am more confident in leaving. If not, well, we will see.
What I prefer most is being out of all trades while I am gone.
I appreciate the comments. Keep them coming. No winner yet!
My second choice would be to make an exception to my mental stops and enter a hard stop in the market just above the invalidation point as Lara suggests. I would also hedge my current short position with a long trade about 3% the value of my short position since you will not be in a position to defend your short position in the event the market moves against you. The hard stop will limit your losses ( I am assuming you are not using options where the loss is already limited to the cost of the contracts). The long trade will cushion the loss of being stopped out and would be insurance well worth it if the market does move in your favor. Probably not a bad idea to have an open sell target for your long hedge as well. This market is that unpredictable.
My first choice if I were not in a position to watch this market like a hawk (or use options) would be to go to cash. The time you are away I do not think will adversely limit you opportunities to profit considering where we are in the game. It is still quite early! 🙂
All great ideas Vern. The more I look at it the more sense it might make to start using some hedges. I do not use options because of the timing factor coupled with my goal to be free from the computer terminal as much as desired.
I also would like to keep it simple. My losses are limited to the amount of the contract. I traded futures for a while some years ago. That is not for me. I don’t want to buy / control a contract valued at $125,000 with only $4,500. Of course it is the same argument against selling short where the theoretical loss is unlimited.
Cashing out is a possible solution. But it was so much work cashing in! Hard stop is a possible solution of course. But 2135 is not the spot. The area above and below is loaded with stop loss orders. If the big money, market makers see it and get together, they will run those stops like bulls out of the gate.
Most importantly though, we have two days of market action left before I need to make a decision. I will be going for 10 to 14 days in July. I hope the major portion of the next leg down is done by then. I’ll cash it in and go for a celebration.
Speaking of a bear market, in these here parts where I live they say, “She’ll be coming around the mountain when she comes.”
I looking and waiting.
Yep. A hedge. That may allow you to put the hard stop just above 2,134.72.
If that is taken out by any amount at any time frame the bear wave counts are fully and finally invalidated.
Could you open a limit order to enter long for a hedge above 2,111?
The Wilshire 5000 suggests more room to the upside:
http://danericselliottwaves.blogspot.com/
Jim, I look at Danerics counts often. But it is not the Wilshire 5000 that is suggesting more upside, it is Daneric using the Wilshire to suggest more upside. I am not saying he is wrong but just noting it is a person making the suggestion not the market itself.
I am looking at our weekly candlestick for this past week. It looks bearish to me. If one examines the major bottoms of the last year or so, one will notice a long shadow on the underside of the bottoming candlesticks. This is an indication that while price was moved down by the bears, they could not hold it. Another way of saying this is that the bulls took control at the end of a long decline.
If one examines the major highs at the weekly level, one will notice there are not as many long upper shadows as observed at the major lows. But there are a couple. The most recent one, other than this week, is week ending Nov. 6, 2016. There is another example on week ending May 22, 2015.
These weekly candles with the long upper shadow, including this past week’s candle, are indicating that the bulls were able to push the price higher during the week but were unable to hold it. Another way to say it is the bears took control and forced the price much lower than the top.
My conclusion is that the candlestick charts on the weekly and daily level (evening star doji) are indicating the bears have taken control. Of course this is a very bearish indicator. I am persuaded the long awaited reversal is in.
In addition, I have noticed some symmetry in the time frames. This would fall under cycle analysis of which I am certainly not expert. But from the high in July of 2015 there are roughly 6 weeks of downward movement to the first low. This is followed by roughly 10 weeks of upward movement into November 2015. Next we have 11 weeks to the first low followed by roughly 14 weeks to this week’s high. All the moves are roughly 250 to 300 SPX points in length.
My conclusion is that we are due for 6-10 weeks of downward movement taking the SPX slightly below 1800. This move down should result in a bottom somewhere between the 1st week of June to the middle of July.
Well, these are just some of my musings for what they are worth. Again, my musings are worth at least exactly what you paid for them (nothing). As always, I welcome your remarks.
I wish each and every one of you have a joyous weekend.
You can add global market sentiment to the list that Rodney proposes above. Chinese markets were down about 4% last week, and the FTSE closed down over 1.4% on Friday… It looks as if the downward movement in US markets might be starting next week, or the week after… We’re also approaching one of the weakest months for stocks, the month of May… So the stage is set up nicely for the start of downward momentum.
An excellent observation Rodney.
Yes, the long upper shadow is bearish indeed.
Also the week ending 27th December 2015 had a long upper shadow.
But so did the week ending 13th September 2015, and that was not followed by a new low.
It is true that week ending Friday, 9/11/2015, had a long upper wick / shadow as did Friday, 9/18/2015. But neither was not preceded by a strong upwards move / wave. The same is true with the weekly candles in late December 2015.
I think the key is the positioning of the candlestick relative to what the market has done over the preceding several weeks.
For us, today, the weekly candlestick is a warning of a potentially strong move to the downside.
I agree, putting it in context this candle is more bearish.
Running the London Marathon tomorrow!!
No chance of being No.1 but cant wait!!
All the best Paresh!
Good luck. Have fun and then recover. Have a pint on me after you are finished.
May the wind be with you Paresh.
I’ll join you Rodney
So nice of you Nick.
#1. One is the loneliest number.