Price moved lower as both hourly Elliott wave counts expected.
At the close of the session, both hourly Elliott wave counts remain valid.
Summary: It is possible that a high is in place, but we should always assume the trend remains the same until proven otherwise. Assume the trend is up until there is confirmation that it is not. Assume price will move higher to end at least above 2,116.48 while it remains above 2,087.84. A new low below 2,039.74 would provide confidence that a strong third wave down is underway. The support line (TA chart) or lower blue line of the Elliott channel (main daily chart) should be used to indicate a trend change. If that line is breached, expect more downwards movement.
To see last published monthly charts click here.
To see how each of the bull and bear wave counts fit within a larger time frame see the Grand Supercycle Analysis.
To see detail of the bull market from 2009 to the all time high on weekly charts, click here.
New updates to this analysis are in bold.
BEAR ELLIOTT WAVE COUNT
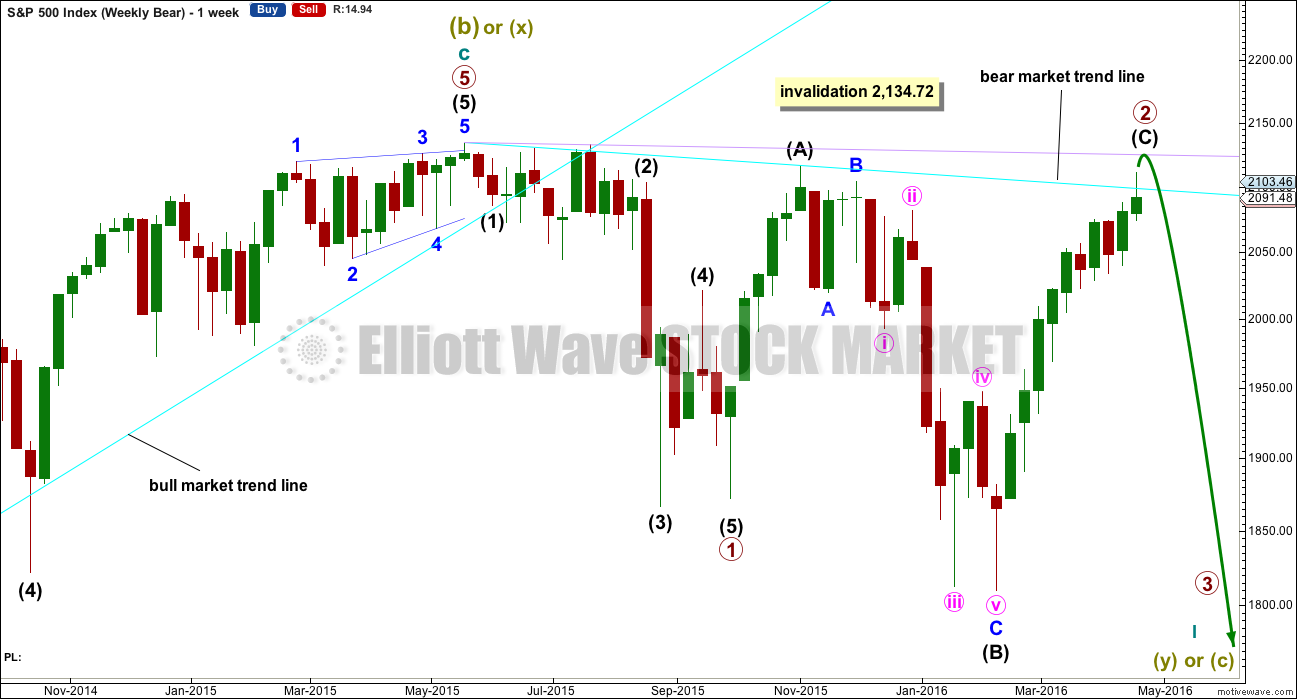
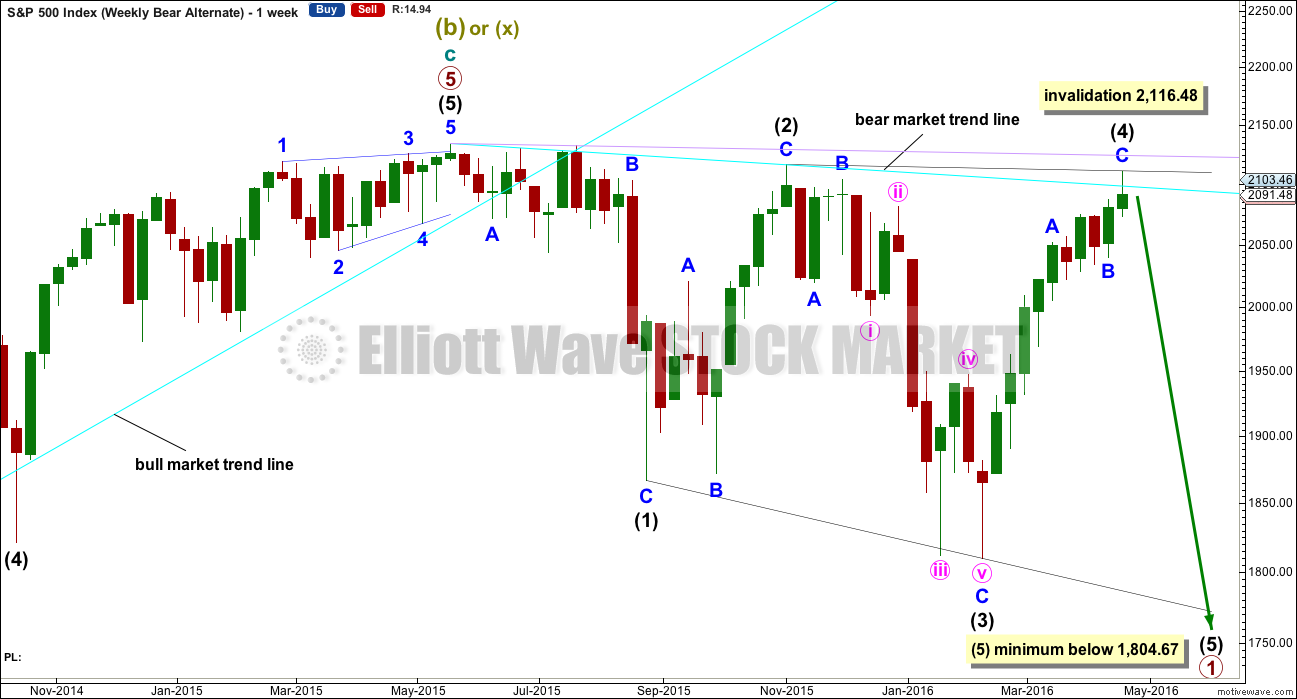
WEEKLY CHART
This bear wave count fits better than the bull with the even larger picture, super cycle analysis found here. It is also well supported by regular technical analysis at the monthly chart level.
Importantly, there is no lower invalidation point for this wave count. That means there is no lower limit to this bear market.
Primary wave 1 may be complete and may have lasted 19 weeks, two short of a Fibonacci 21. So far primary wave 2 is in its 28th week. It looks unlikely to continue for another 6 weeks to total a Fibonacci 34, so it may end either this week or possibly early next week. This would still give reasonable proportion between primary waves 1 and 2. Corrections (particularly more time consuming flat corrections) do have a tendency to be longer lasting than impulses.
Primary wave 2 may be unfolding as an expanded or running flat. Within primary wave 2, intermediate wave (A) was a deep zigzag (which will also subdivide as a double zigzag). Intermediate wave (B) fits perfectly as a zigzag and is a 1.21 length of intermediate wave (A). This is within the normal range for a B wave of a flat of 1 to 1.38.
Intermediate wave (C) is likely to make at least a slight new high above the end of intermediate wave (A) at 2,116.48 to avoid a truncation and a very rare running flat. However, price may find very strong resistance at the final bear market trend line. This line may hold price down and it may not be able to avoid a truncation. A rare running flat may occur before a very strong third wave down. That looks possible today. The whole structure is now complete down to the five minute chart level. The hourly alternate looks at this possibility that intermediate (C) is over today and truncated by 5.43 points. The truncation is small and acceptable.
If price moves above 2,116.48, then the new alternate bear wave count would be invalidated. At that stage, if there is no new alternate for the bear, then this would be the only bear wave count.
Primary wave 2 may not move beyond the start of primary wave 1 above 2,134.72.
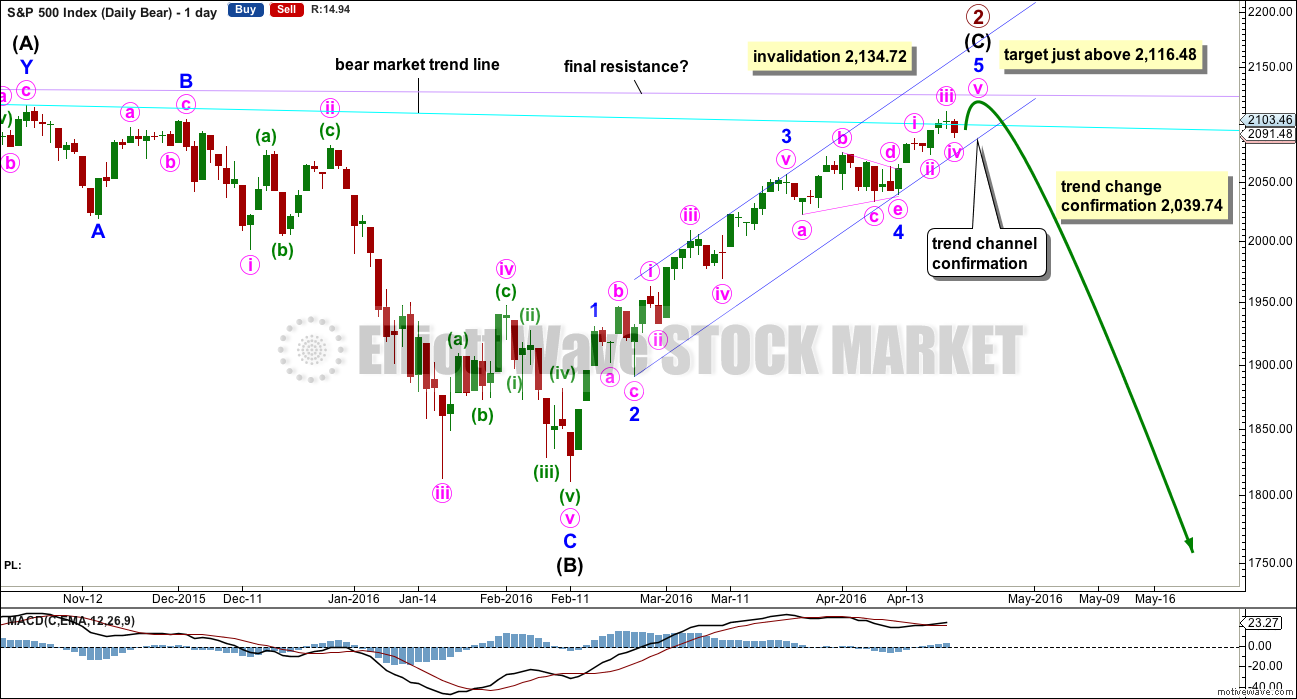
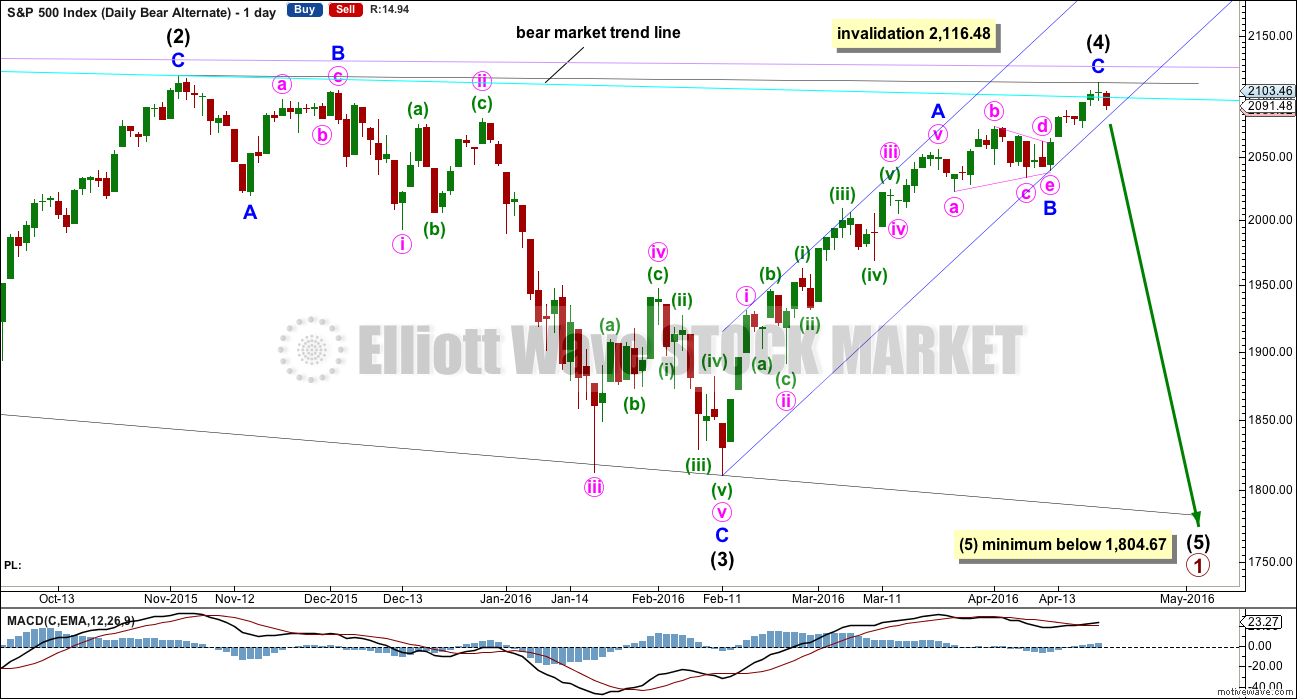
DAILY CHART
Intermediate wave (A) fits as a single or double zigzag.
Intermediate wave (B) fits perfectly as a zigzag. There is no Fibonacci ratio between minor waves A and C.
Intermediate wave (C) must subdivide as a five wave structure. It is unfolding as an impulse.
Intermediate wave (C) does not have to move above the end of intermediate wave (A) at 2,116.48, but it is likely to do so to avoid a truncation. If intermediate wave (C) is over, then the truncation is small at only 5.43 points. This may occur right before a very strong third wave pulls the end of intermediate wave (C) downwards. However, it is unconfirmed today although this is possible. Confirmation is required.
The next wave down for this wave count would be a strong third wave at primary wave degree.
The target is for intermediate wave (C) to end just above the end of intermediate wave (A) at 2,116.48, so that a truncation is avoided.
Redraw the channel about the impulse of intermediate wave (C) using Elliott’s second technique: draw the first trend line from the ends of the second to fourth waves at minor degree, then place a parallel copy on the end of minor wave 3. Minor wave 5 may end midway within the channel. When this channel is breached by downwards movement, that will be the earliest indication of a possible end to primary wave 2.
Because expanded flats do not fit nicely within trend channels, a channel about their C waves may be used to indicate when the expanded flat is over. After a breach of the lower edge of the channel, if price then exhibits a typical throwback to the trend line, then it may offer a perfect opportunity to join primary wave 3 down. This does not always happen, so if it does in this case take the opportunity.
Within minor wave 5, no second wave correction may move beyond the start of its first wave below 2,039.74. A new low below 2,039.74 could not be a second wave correction within minor wave 5, so at that stage minor wave 5 would have to be over. This would confirm a trend change.
Primary wave 1 lasted 98 days (not a Fibonacci number). So far primary wave 2 has lasted 141 days. Tuesday next week would be the 144th day. Up to two either side of 144 would be close enough for a Fibonacci relationship in terms of duration.
Price may find final resistance and end upwards movement when it comes to touch the lilac trend line.
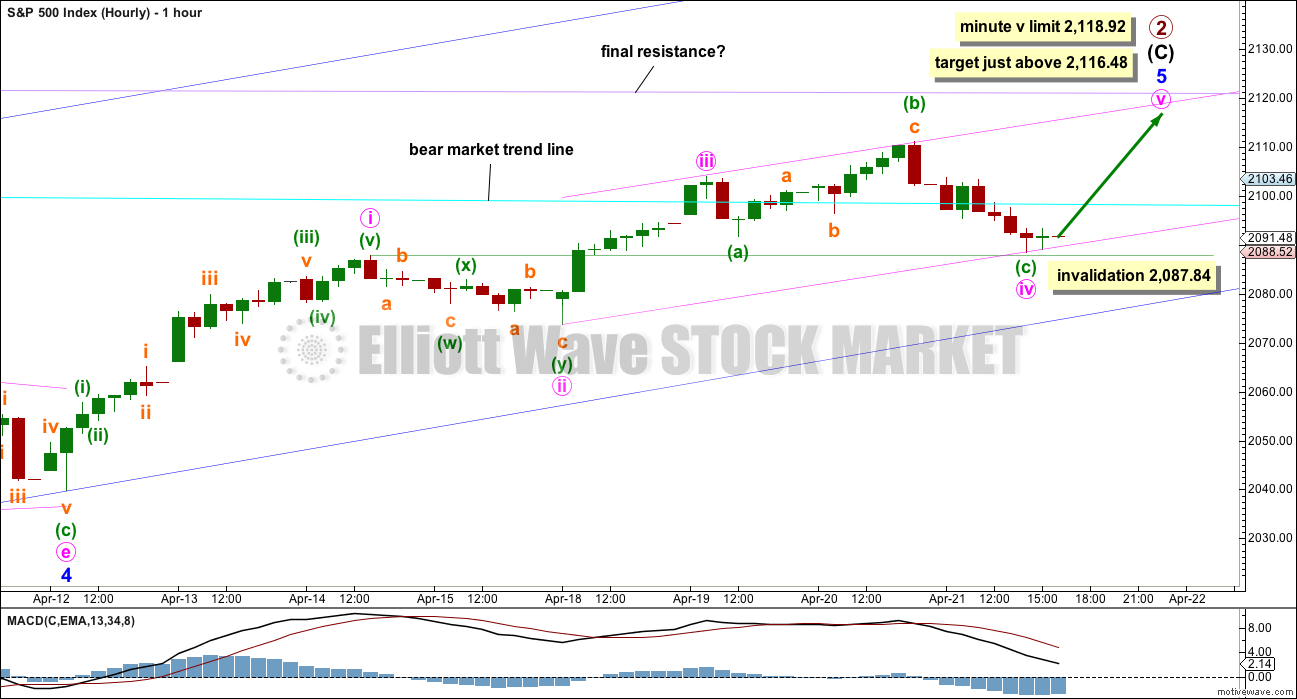
HOURLY CHART
So far minute wave iv may be a complete expanded flat. There is almost no room left for this structure to move into because it may not move into minute wave i price territory below 2,087.84.
This first hourly wave count must be invalidated during the New York session for it to be invalidated. This Elliott wave analysis is based on the cash / spot price, not futures, so an Elliott wave analysis of futures may have slight differences. After hours price movement impacts this analysis only if price gaps up or down on the open.
Minute wave iii is 0.67 points longer than 0.618 the length of minute wave i. Minute wave iii is shorter than minute wave i. This places a limit on minute wave v because a third wave may never be the shortest. Minute wave v may not move above 2,118.92, which is where it would be equal in length with minute wave i.
Minute wave iv slightly breached the channel drawn using Elliott’s first technique. Redraw the channel using the second technique: from two to four with a copy on three. Minute wave v may end either midway within the channel or at the upper edge.
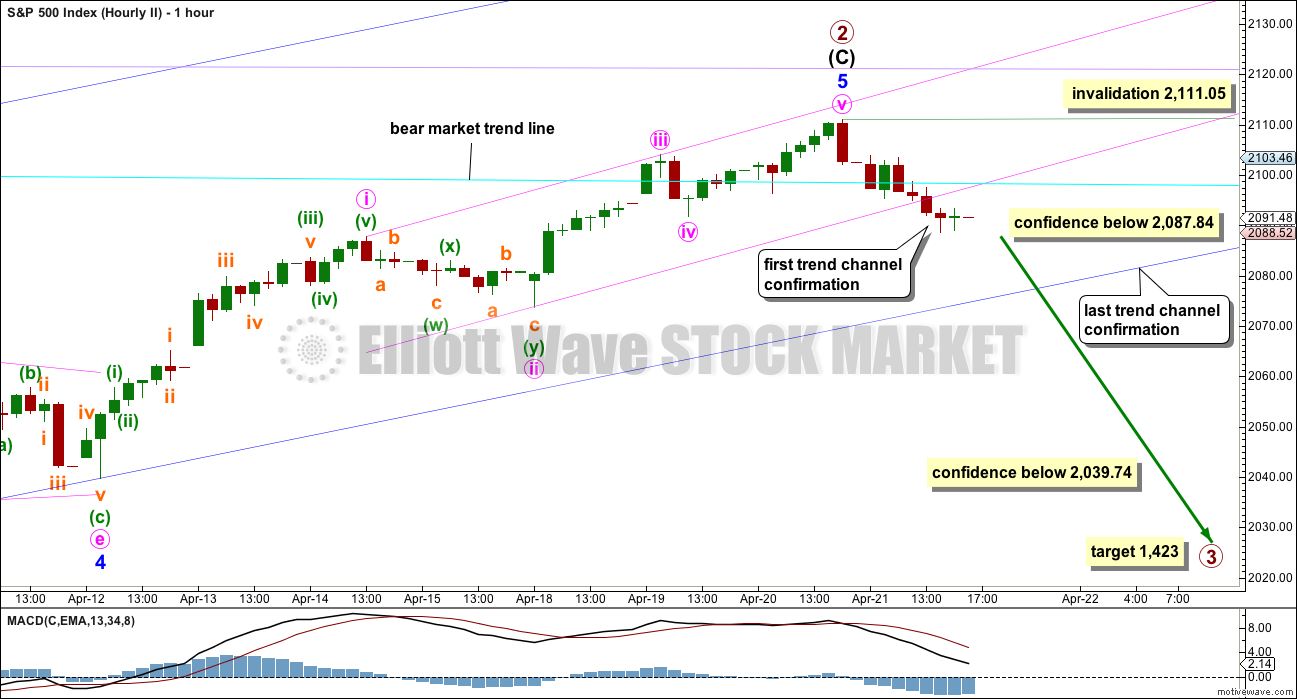
ALTERNATE HOURLY CHART
The entire structure of primary wave 2 may now be complete. This alternate wave count expects a big trend change happened in the final hour of yesterday’s session. It absolutely requires some confirmation before any confidence may be had in it.
Ratios within intermediate wave (C) would be: minor wave 3 has no Fibonacci ratio to minor wave 1, and minor wave 5 (if it is over) would be 3.21 points short of 0.618 the length of minor wave 1.
Ratios within minor wave 5 would be: minute wave iii would be just 0.67 points longer than 0.618 the length of minute wave i, and minute wave v would be just 0.59 points longer than 0.618 the length of minute wave iii and just 1 point longer than 0.382 the length of minute wave i.
The pink channel is breached by downwards movement giving earliest indication of a possible trend change. But fourth waves aren’t always contained within Elliott channels, and the S&P has a tendency to form rounding tops which breach channels only for price to turn back and continue in the prior trend direction. This channel breach is an early warning and not a confirmation.
A new low below 2,087.84 would invalidate the main hourly wave count and provide some price confidence in a potential trend change.
A clear and strong breach of the dark blue channel would provide further confidence in a trend change. If that happens tomorrow, then reasonable confidence may be had in this wave count, enough to use the lower edge of the blue channel as an entry point. If price throws back to find resistance at the blue channel after breaching it, that would be a low risk high reward opportunity to enter short. The risk would be at 2,111.05 or for the more adventurous trader at 2,134.72.
Finally, a new low below 2,039.74 would provide reasonable confidence in a trend change. The only question at that stage would be of what degree?
If primary wave 2 is over, then the target for primary wave 3 would be 2.618 the length of primary wave 1 at 1,423. That is the appropriate Fibonacci ratio to use when the second wave correction is so very deep, and here primary wave 2 would be 0.91 the length of primary wave 1.
Primary wave 1 lasted 98 days (not a Fibonacci number). Primary wave 2 may have lasted 140 days (four short of a Fibonacci 144). Primary wave 3 may be quick, but it still would have two sizeable corrections for intermediate waves (2) and (4) within it. An initial expectation may be for it to total a Fibonacci 144 or 233 days.
ALTERNATE WEEKLY CHART
Primary wave 1 may subdivide as one of two possible structures. The main bear count sees it as a complete impulse. This alternate sees it as an incomplete leading diagonal.
The diagonal must be expanding because intermediate wave (3) is longer than intermediate wave (1). Leading expanding diagonals are not common structures, so that reduces the probability of this wave count to an alternate.
Intermediate wave (4) may continue higher now and may find resistance at the bear market trend line.
ALTERNATE DAILY CHART
Within a leading diagonal, subwaves 2 and 4 must subdivide as zigzags. Subwaves 1, 3 and 5 are most commonly zigzags but may also sometimes appear to be impulses.
Intermediate wave (3) down fits best as a zigzag.
In a diagonal the fourth wave must overlap first wave price territory. The rule for the end of a fourth wave is it may not move beyond the end of the second wave.
Expanding diagonals are not very common. Leading expanding diagonals are less common.
Intermediate wave (4) must be longer than intermediate wave (2), so it must end above 2,059.57. This minimum has been met. The trend lines diverge.
The triangle is seen as minor wave B. Intermediate wave (4) now has a clearer three wave look to it.
The structure of intermediate wave (4) may now be complete. Intermediate wave (5) must be longer than intermediate wave (3), so it must end below 1,804.67. Confirmation of the end of the upwards trend for intermediate wave (4) would still be required before confidence may be had in a trend change, in the same way as that for the main bear wave count.
BULL ELLIOTT WAVE COUNT
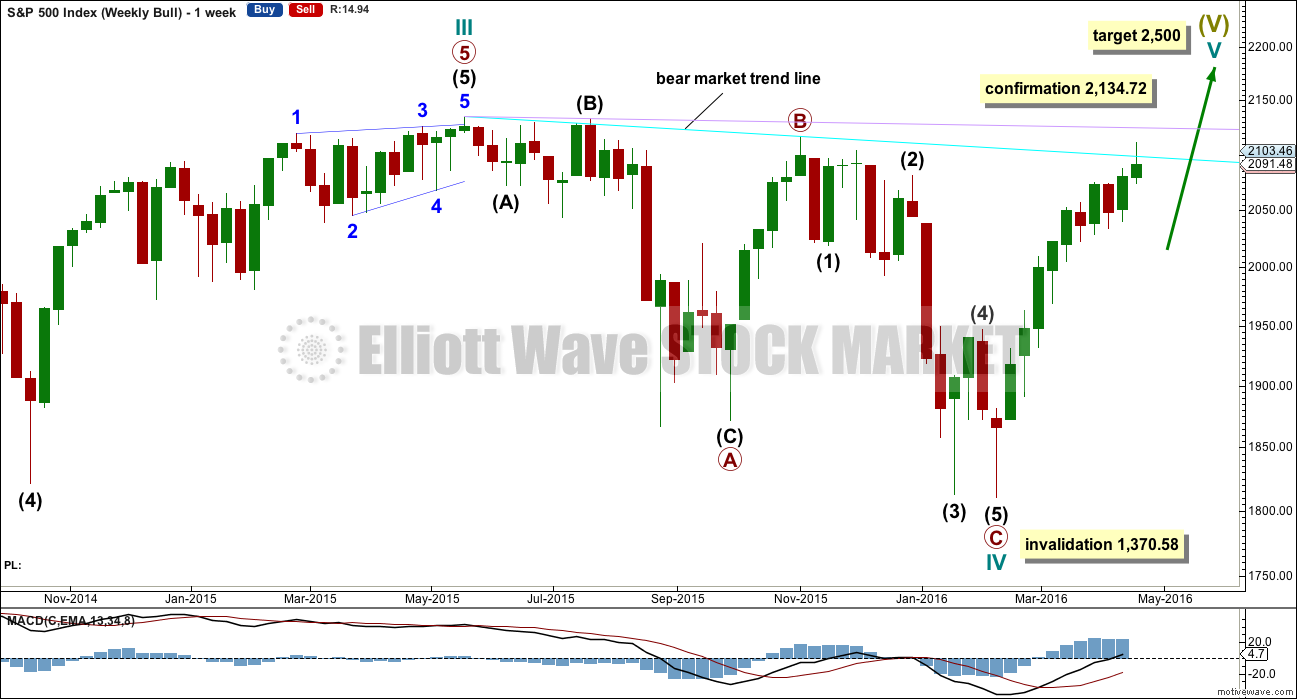
WEEKLY CHART
Cycle wave II was a shallow 0.41 zigzag lasting three months. Cycle wave IV may be a complete shallow 0.19 regular flat correction, exhibiting some alternation with cycle wave II.
At 2,500 cycle wave V would reach equality in length with cycle wave I.
Price remains below the final bear market trend line. This line is drawn from the all time high at 2,134.72 to the swing high labelled primary wave B at 2,116.48 on November 2015. This line is drawn using the approach outlined by Magee in the classic “Technical Analysis of Stock Trends”. To use it correctly we should assume that a bear market remains intact until this line is breached by a close of 3% or more of market value. In practice, that price point would be a new all time high which would invalidate any bear wave count.
This wave count requires price confirmation with a new all time high above 2,134.72.
While price has not made a new high, while it remains below the final bear market trend line and while technical indicators point to weakness in upwards movement, this very bullish wave count comes with a strong caveat. I still do not have confidence in it.
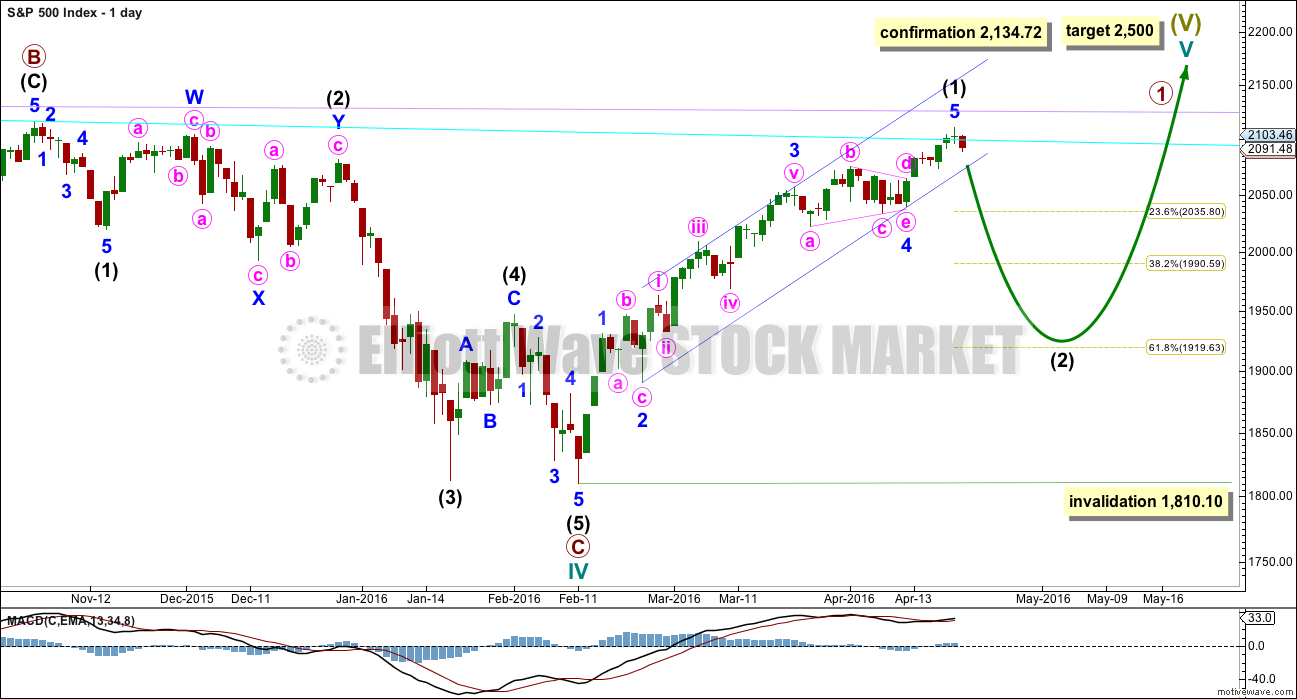
DAILY CHART
Intermediate wave (2) is seen as an atypical double zigzag. It is atypical in that it moves sideways. Double zigzags should have a clear slope against the prior trend to have the right look. Within a double zigzag, the second zigzag exists to deepen the correction when the first zigzag does not move price deep enough. Not only does this second zigzag not deepen the correction, it fails to move at all beyond the end of the first zigzag. This structure technically meets rules, but it looks completely wrong. This gives the wave count a low probability.
If the bull market has resumed, it must begin with a five wave structure upwards at the daily and weekly chart level. That may today be complete. The possible trend change at intermediate degree still requires confirmation in the same way as the alternate hourly bear wave count outlines before any confidence may be had in it.
If intermediate wave (2) begins here, then a reasonable target for it to end would be the 0.618 Fibonacci ratio of intermediate wave (1) about 1,920. Intermediate wave (2) must subdivide as a corrective structure. It may not move beyond the start of intermediate wave (1) below 1,810.10.
In the long term, this wave count absolutely requires a new high above 2,134.72 for confirmation. This would be the only wave count in the unlikely event of a new all time high. All bear wave counts would be fully and finally invalidated.
TECHNICAL ANALYSIS
DAILY CHART
Click chart to enlarge. Chart courtesy of StockCharts.com.
Volume data on StockCharts is different to that given from NYSE, the home of this index. Comments on volume will be based on NYSE volume data when it differs from StockCharts.
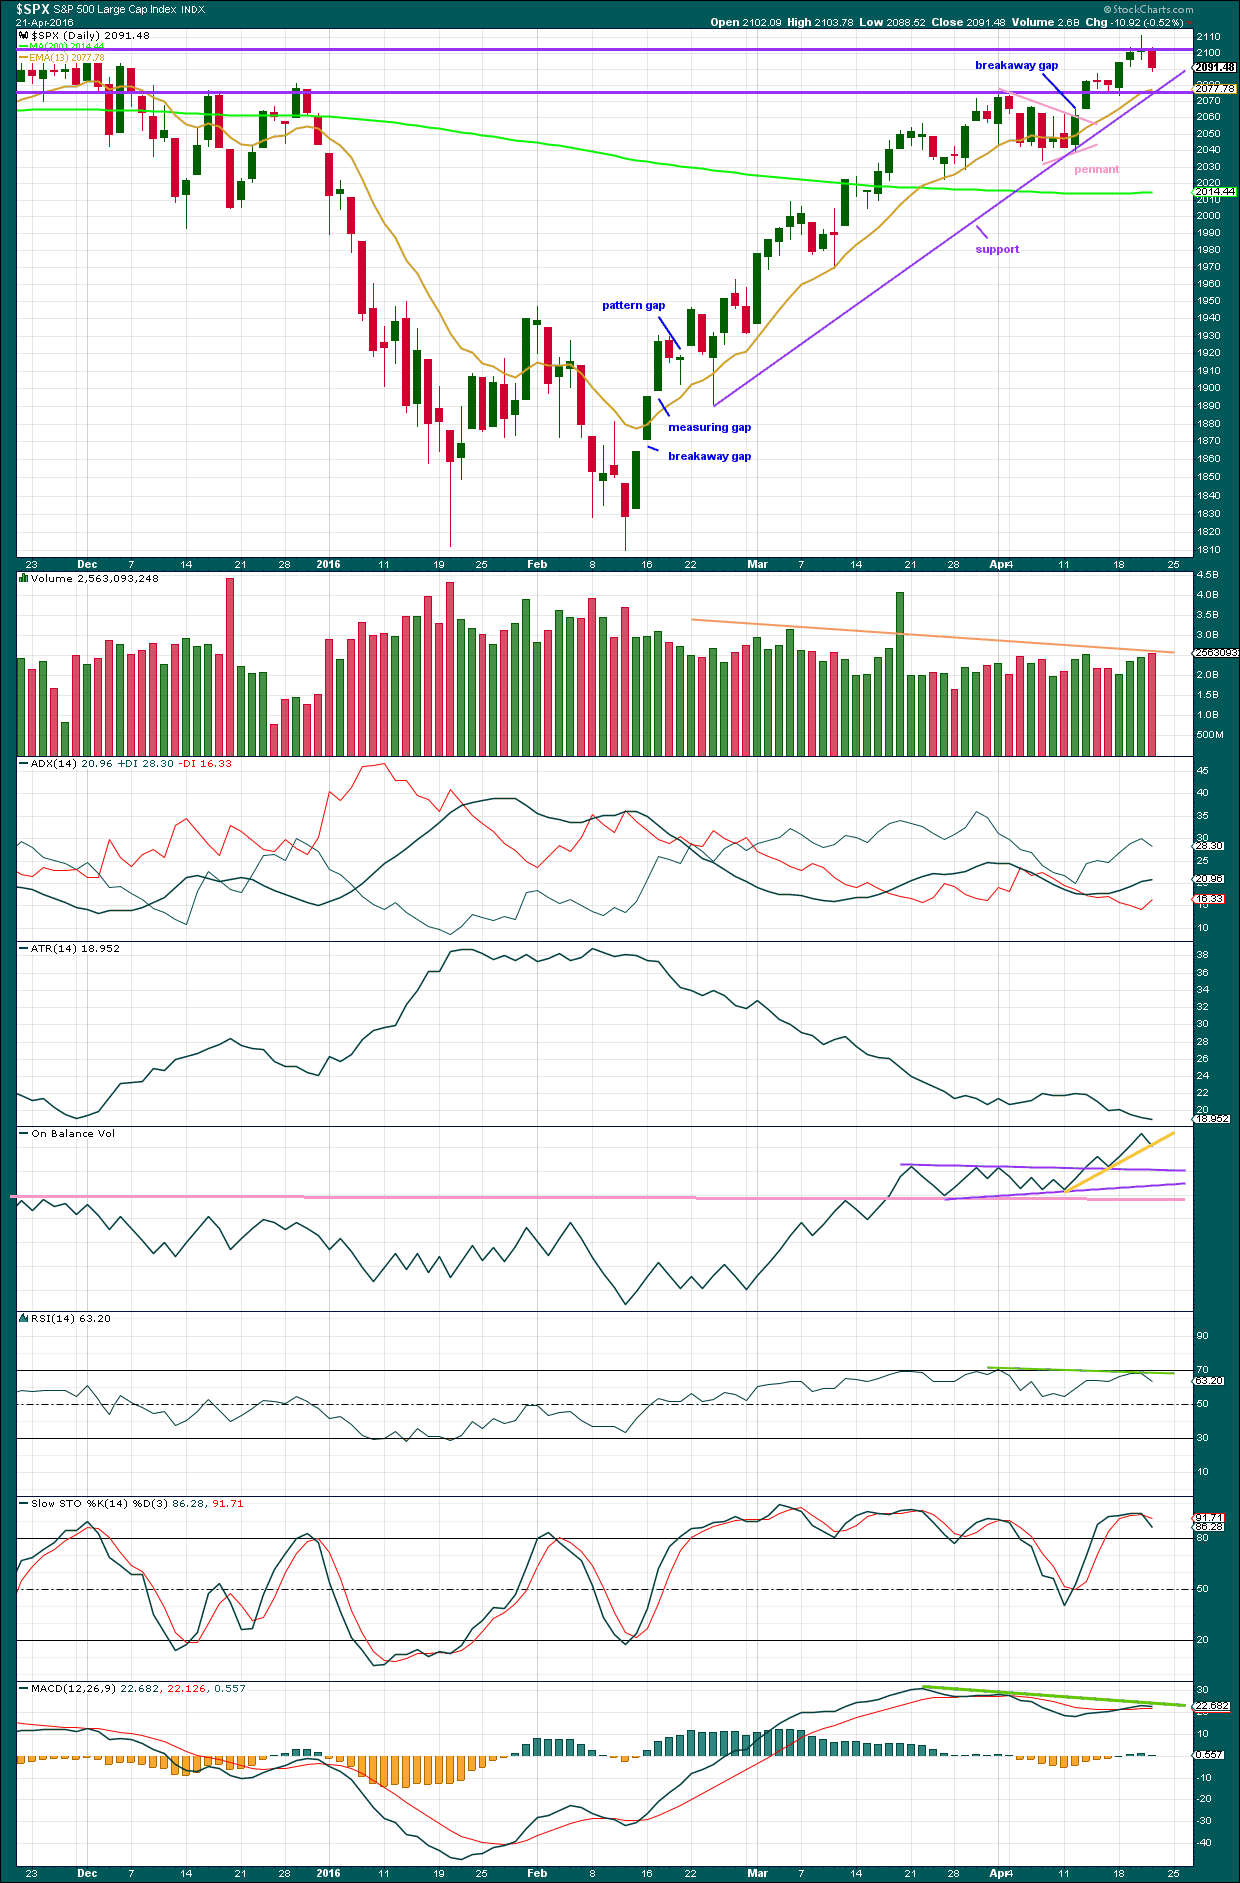
The line in the sand for a correction is the upwards sloping purple support line. This is the same as the lower edge of the blue channel on the main daily Elliott wave count. A breach of this bull market trend line would indicate the trend (at least short to mid term) has changed from bull to bear. While price remains above that support line it should be expected that price may find support there.
How price behaves if it comes down to this line will indicate which hourly Elliott wave count is correct and if price is beginning either a large correction (bull wave count) or a new big wave down (bear wave count). For clues as to whether the line may be breached sooner or later we can look to volume, momentum, breadth strength and sentiment.
Volume: Overall, now volume declines as price has been rising for over 40 days. In the short term, the downwards day of 21st April comes with an increase in volume supporting the downwards movement in price. Downwards volume for 21st of April is stronger than the prior three upwards days. Volume indicates the upwards movement is unsupported and unsustainable. A relatively large correction at least would be expected.
On Balance Volume: To date this indicator has been providing bullish signals along with rising price. OBV will remain bullish while OBV finds support at all the trend lines drawn here. A break below the yellow line would be a weak bearish signal. A break below the purple lines would be reasonable bearish indication. A break below the pink line would be a strong bearish signal. OBV has not given any bearish signals yet, only bullish. In this instance, unfortunately, OBV may not lead price for us.
Momentum: MACD is added today. MACD shows divergence with price (green line) back to 22nd March. With reasonably long held divergence, this indicates momentum is weak.
Breadth: As given in charts below, the AD Line and Bullish Percent both indicate breadth to this upwards movement, but there is hidden bearish divergence. The increase in breadth is not translating to a corresponding increase in price, so price is weak.
Strength: RSI has some slight divergence with price (green line). RSI has failed to make corresponding highs as price has made new highs. This indicates weakness in price.
Sentiment: As given in COT charts below, up to 12th April, commercials are more strongly short than long and non commercials more strongly long than short. This is bearish.
Conclusion: The bearish case at least short / mid term is supported by volume analysis but not On Balance Volume. The divergence in momentum and breadth and strength indicators supports a bearish outlook over a bullish outlook. Sentiment is also bearish. Overall, the balance of this picture is predominantly bearish. The support line should be expected to most likely be breached if price again comes down to it. But first it may provide some support for a small bounce. If it is breached, then look for a potential throwback to find resistance. If price behaves like that, then take the opportunity to enter short there.
INVERTED VIX DAILY CHART
Click chart to enlarge. Chart courtesy of StockCharts.com.
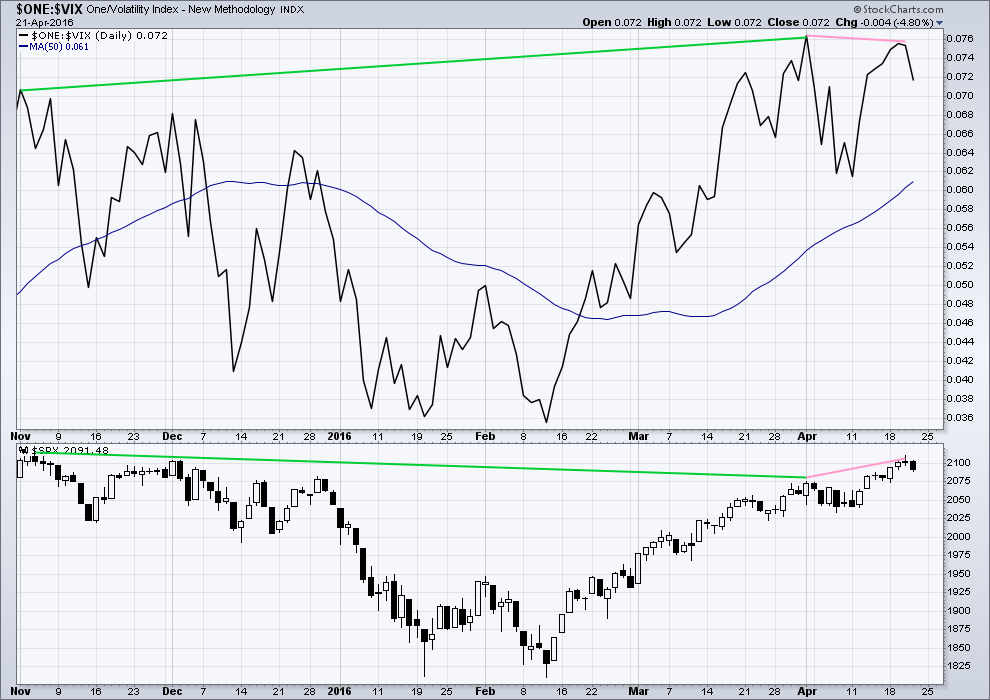
Volatility declines as inverted VIX climbs. This is normal for an upwards trend.
What is not normal here is the divergence over a reasonable time period between price and inverted VIX (green lines). The decline in volatility is not translating to a corresponding increase in price. Price is weak. This divergence is bearish.
Price made a new short term high, but VIX has failed to make a corresponding high (pink lines). This is regular bearish divergence. It indicates further weakness in the trend.
Price yesterday again made a new high and printed a green daily candlestick. Yet inverted VIX has declined and did not move up for the session. There is now a third short term divergence between price and VIX today.
BULLISH PERCENT DAILY CHART
Click chart to enlarge. Chart courtesy of StockCharts.com.
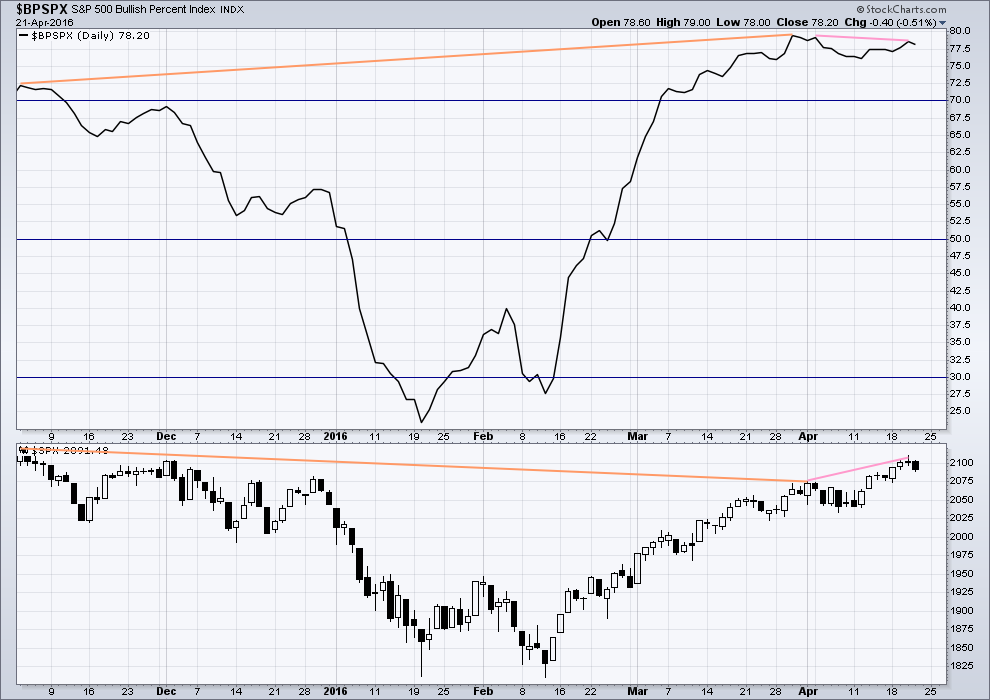
With this indicator measuring the percentage of bullish equities within the index, it is a measurement of breadth and not sentiment as the name suggests.
There is strong hidden bearish divergence between price and the Bullish Percent Index (orange lines). The increase in the percentage of bullish equities is more substantial than the last high in price. As bullish percent increases, it is not translating to a corresponding rise in price. Price is weak.
As price made a new short term high yesterday, BP did not (pink lines). This is regular bearish divergence. It indicates underlying weakness to the upwards trend.
ADVANCE DECLINE LINE
Click chart to enlarge. Chart courtesy of StockCharts.com.
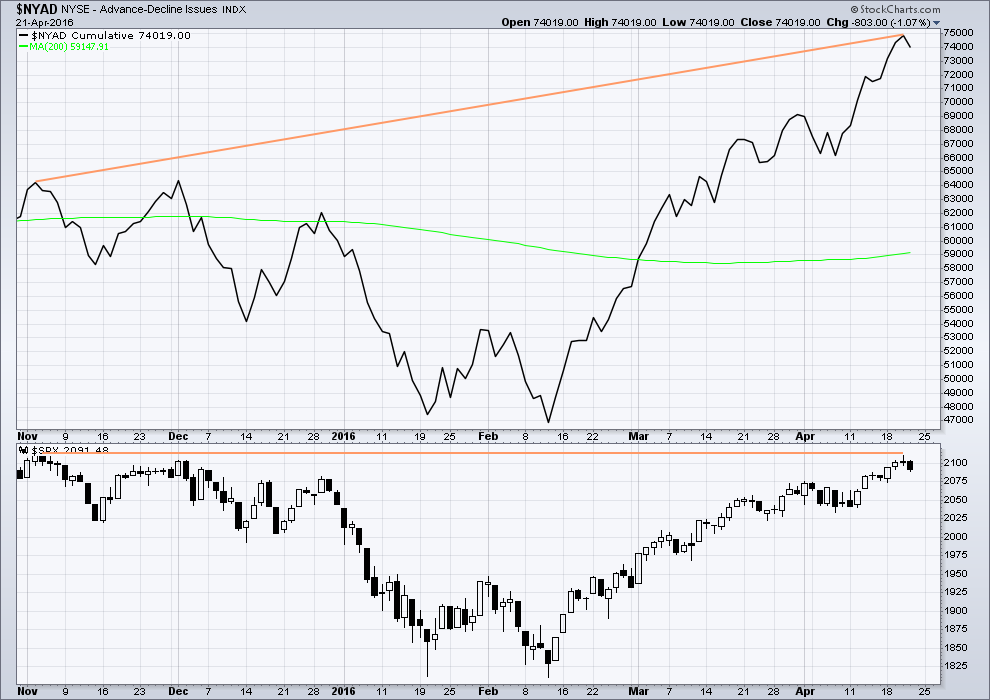
With the AD line increasing, this indicates the number of advancing stocks exceeds the number of declining stocks. This indicates that there is breadth to this upwards movement.
From November 2015 to now, the AD line is making new highs while price has so far failed to make a corresponding new high. This indicates weakness in price; the increase in market breadth is unable to be translated to increase in price.
It remains to be seen if price can make new highs beyond the prior highs of 3rd November, 2015. If price can manage to do that, then this hidden bearish divergence will no longer be correct, but the fact that it is so strong at this stage is significant. The AD line will be watched daily to see if this bearish divergence continues or disappears.
The 200 day moving average for the AD line is now increasing. This alone is not enough to indicate a new bull market. During November 2015 the 200 day MA for the AD line turned upwards and yet price still made subsequent new lows.
COMMITMENT OF TRADERS (COT)

Click chart to enlarge. Chart courtesy of Qandl.
This first COT chart shows commercials. Commercial traders are more often on the right side of the market. Currently, more commercials are short the S&P than long. This supports a bearish Elliott wave count, but it may also support the bullish Elliott wave count which would be expecting a big second wave correction to come soon. Either way points to a likely end to this upwards trend sooner rather than later. Unfortunately, it does not tell exactly when upwards movement must end.
*Note: these COT figures are for futures only markets. This is not the same as the cash market I am analysing, but it is closely related enough to be highly relevant.

Click chart to enlarge. Chart courtesy of Qandl.
Non commercials are more often on the wrong side of the market than the right side of the market. Currently, non commercials are predominantly long, and increasing. This supports the expectation of a trend change soon.
DOW THEORY
I am choosing to use the S&P500, Dow Industrials, Dow Transportation, Nasdaq and the Russell 2000 index. Major swing lows are noted below. So far the Industrials, Transportation and Russell 2000 have made new major swing lows. None of these indices have made new highs.
I am aware that this approach is extremely conservative. Original Dow Theory has already confirmed a major trend change as both the industrials and transportation indexes have made new major lows.
At this stage, if the S&P500 and Nasdaq also make new major swing lows, then my modified Dow Theory would confirm a major new bear market. At that stage, my only wave count would be the bear wave count.
The lows below are from October 2014. These lows were the last secondary correction within the primary trend which was the bull market from 2009.
These lows must be breached by a daily close below each point.
S&P500: 1,821.61
Nasdaq: 4,117.84
DJIA: 15,855.12 – close below on 25th August 2015.
DJT: 7,700.49 – close below on 24th August 2015.
Russell 2000: 1,343.51 – close below on 25th August 2015.
To the upside, DJIA has made a new major swing high above its prior major high of 3rd November, 2015, at 17,977.85. But DJT has so far failed to confirm because it has not yet made a new major swing high above its prior swing high of 20th November, 2015, at 8,358.20. Dow Theory has therefore not yet confirmed a new bull market. Neither the S&P500, Russell 2000 nor Nasdaq have made new major swing highs.
This analysis is published @ 11:09 p.m. EST.

FTSE is very interesting today. It has come down right at the support line of its channel.
With S&P and FTSE both coming down to test support… how markets behave on Monday will be strongly indicative.
Will update FTSE over the weekend for those interested in trading it.
The first or main hourly wave count will still assume the trend remains the same (up) until price can make a new low below 2,039.74.
I’ll move the degree of labelling within minor 5 down one degree. Minute i would be complete. This downwards move today would be waves A-B of a zigzag for minute ii.
0.618 Fibonacci ratio is 2,067. It should find strong support at the lower edge of the blue trend channel if it gets down that far.
And so both bull and bear hourly wave counts are going to be expecting another five down on Monday. Bull to complete a zigzag, bear for a third wave.
Because A-B-C of a zigzag subdivides exactly the same as 1-2-3 of an impulse.
Confirmation of bear, invalidation of bull below 2,039.74.
Actually, if it reaches that target it’s going to overshoot the blue trend channel. 🙁
Price action way too tentative for me and leads me to conclude rather than the start of an impulse down, especially at P3 degree, we are seeing some consolidation ahead of a final wave up. Cannot be too much longer before a top I would imagine. Action around pivots a very cautionary tale. Have a great weekend all!
I am suspecting we have a number of obstacles to overcome on the downside. First we have the channel break. Next we have the 13-day moving average. Then the 200 day moving average is not far behind. I certainly may take another week of meandering before the plunge begins. Bottoms stop on a dime and reverse making a ‘V’ pattern. Tops tend to round off and then the water fall.
You have a great weekend too Verne and all you EWSM participants. Lara, you keep working on that happy morning dance.
Yeah. The S&P often forms slow annoying rounding tops. The wave counting at the top gets ridiculously difficult.
The start of a primary third wave may be no exception to this tendency.
It’s now below the cyan bear market trend line and finding support at the lower edge of the blue channel.
But either way, bull or bear, a sizeable correction is due. Even if it’s only intermediate (2) for the bull.
See you next week guys!
Lara,
None of this looks very impulsive?
? from the high today?
You’re right. It doesn’t.
Although it could be two first and second waves.
The first wave was short, followed by a very deep expanded flat
These torturous second waves seem to be part and parcel of this market’s current personality. One has to be nimble in trading the impulsive legs.
If the alternate bear count turns out to be correct it could be a long hot Summer…. 🙂
DJI back above the 18000 pivot. I wish the bears would put that baby to rest already…!
If the bear count is right at the monthly chart level then this could be one amazingly long drawn out decline.
I’d rather it was all over in just a couple of years.
Each second wave is an opportunity for a good entry. Risk still a bit too high for my comfort ATM though to add to my position. I’ll wait for the blue line to be breached.
Going to do my super happy morning dance 🙂
I can see a small five down on the hourly chart. Now a small three up.
There is still risk to this wave count; this could still be part of minor wave 5 and we may yet see new highs.
I really want to see that blue trend channel breached before I’m going to have any reasonable confidence that a high may be in now.
wheres the video of that super happy dance
Lara please tell me what points you are drawing from and to for the blue channel?
Low of minor 2 to minor 4 on the main daily chart. A copy on the high of minor 3.
So from those points, same on the hourly chart, on an arithmetic scale for hourly.
Semi log scale for daily
Lara I have only one request and then I will be quiet.
Will you please post a video of your super happy morning dance? While your at it, one of you surfing this wave would be great as well. (I see doc beat me to it.)
Sorry guys, no vid of the Super Happy Morning Dance.
Next time I get my GoPro locked and loaded maybe a vid of a wave on one of our beautiful beaches here.
Never mind. I think I found it online. Here is the link,
https://www.youtube.com/watch?v=d8DvP5Zf7H8
I knew you could toot your own horn!
I was thinkin more like this 🙂 🙂
https://www.youtube.com/watch?v=3i115sGh0dk
Well she did say she was chicken when it comes to risk. But she is such a good bear and did you see that hoola-hoop move?
LMAO
Sorry Rodney, I can’t watch that. I’m wondering how the bear was trained to do that… and if it suffered. The pacifist and animal lover in me just wonders 🙁
Oh I am sorry. My guess is it did not suffer. The trainer continued giving that bear treats of some sort. That demonstrates positive reinforcement. But I understand. if you’d like you can delete the post. I am not able to do so.
I’ll keep looking though to find a perfect happy morning dance!
I just have too much time on my hands today.
No worries, and you may be right.
That chicken dance is about right actually. My dancing skills are… rudimentary. And that’s putting it nicely.
hee hee,, sounds like me,, I dance like the Fonz
Practice makes perfect! 🙂
Can someone tell me what UVXY is?
Here’s the website that Verne showed us a few days ago:
http://sixfigureinvesting.com/2015/03/how-does-uvxy-work/
What I found really interesting was how fast it decays–something we need to keep in mind.
And the 12% monthly decay is just the average – during volatile active markets is can be a lot more. And add that to the theta decay of buying calls on it and its something you don’t want to hold for long.
I’ve thought about buying puts on SVXY as a workaround but have never gotten around to doing it…
Just loaded up another 10% – looks like this small degree c wave is almost over. From lows the structure might only be wave a of an abc up. 5 down from yesterdays high might still turn out to be an A wave (or even a C wave exp flat).
Still need more price to unfold but it’s looking good atm. If this move up turns out to be a 5 then that’s also ok – the spike this morning was maybe the end of the first impulse down and the lower low a b wave with this upwards move being the c wave for an expanded flat.
Good morning. Yep. That’s exactly how I would have it too.
On my main hourly chart price is coming up to touch the lower pink trend line.
Good Morning to you also Lara (Good Evening where I am atm 🙂 )
noon here
UVXY fills gap from 2 days ago… me thinks it’s a good set up.
I’m full 6 of 8 wagons on June expiration, 18 calls. Average buy in so far 2.75. Will fill the next 2 if UVXY approaches 15 again…
now maybe we can make some abc zizzy zaggys the other way,, big ones with footlong red candles
Outta here with the foot-long candles….I like mine metres long baby!! 😀
you can get those meter long candles easy,, just project your chart up on the movie screen,,, you do have a movie theatre in your home dont you? Casa de Carty ?
Claro que si amigo…! 🙂
Just when you think we are going to get a nice flush we rip 10 points off the lows…UVXY was not convinced of the down move either. yuck
Now exactly flat for the day…
B was a triangle. C is a zig-zag- should be completing just about now with the C leg of the zig-zag….
O.K. Now we need to take out 2081.20…
what is this morphing into,, its alive
Now looking more like an expanded flat….
At moments like these, I leave the 1 and 5 minute charts behind and concentrate on the hourly. There we can count five distinct waves down with a correction of some sort going on right now. It does not mean we have a five wave impulse though as it can be subdivided in a multitude of ways.
As always, I am no wave counter of credit.
Me too. The hourly looks pretty clear. And so I’ll take a look and check subdivisions on the 5 minute, but I’ll go with the hourly.
Correction now looking like some kind of contracting triangle, but I think you cannot have a triangle as the only structure of a second wave, so something more complex must be developing….
Trying to deploy remaining ammo on more May 6 18.50 calls for under a buck but no takers so far. May have to try for the 20 strikes…
As expected NDX blazing the trail to the downside….we should be picking up speed shortly….
Amazing that the VIX is still flat right now even with NDX & COMP down like it is.
Equivalent to SPX 2039, QQQ needs to take out 108.02 and COMPQX needs to take out 4808.91.
Whatever this current wave is in the SPX… atm it looks like it is about to extend.
Nope
Looks like a slow meandering flat correction. We are probably in C up…..headed for just above 2086.69
Could this still be wave 4 from 2011.05 on 5 min.?
I think it could be with wave v taking us to 2073 or there about.
Looks like a corrective structure? Not sure if it is a 5… a 5 may be next.
C is still possible although it’s getting hard to view it as a C.
The third wave would have a truncated fifth if you tried to see it that way I think….
On second look, you actually could without that fifth wave truncation…
A pattern like this is when trying to learn counting gets frustrating. I guess this is why you need to know everything on the EWP cold.
I meant it could be a wave iv as you asked with wave v coming next to 2073.
You have to excuse me, I am doing domestic chores (not my favorite thing) in between glances at the screen.
We have a clear five down from 2111.05.
Small second wave correction underway…
We need to stay below 2095.42…
Wave four high is 2094.32
Correction on that possible second wave. It can actually return to first wave territory (unlike fourth waves) so it could technically equal, but not exceed the start of wave one at 2111.05….
Why do we need to stay below 2095.42? Couldn’t we retrace all the way back to 2111.05 for a wave 2? Of course, I would expect if we are starting P3 down that retracements would be brief and shallow.
if we have a clear 5 down… we now need an a, b,c.
If it is a P3 the a,b.c will be brief & shallow.
5 & 3
Yep! My mistake…! I was thinking fourth wave…
The key I think is to just let the wave pattern develop. It eventually becomes clear, even if your initial assessment was not correct…
MACD on the 4 hr and daily chart have now crossed over the the downside. Bearish!
Any advice on an entry point to sell? If we get a confirmation on a break of 2034.00 is that the point to sell or may we get a slight rebound to sell from a higher level? Also where do you peeps place stops, above the previous day’s high?
Take a look at Lara’s bear count hourly II chart. She has two trendline channel ‘confirmation’ points which each give us more confidence. When the second or lower of these channels is breached by an hourly candle not touching the trendline we have more confidence.
I am looking for an initial move to the 2070-2075 area. From there we may see a retrace back to and touching the channel trendline. That may be a good entry.
As always, proceed at your own risk.
Personally, I want to see the 2075.00 level taken out today to have the pivot question conclusively settled in my own mind with regard to short term price action.
As Rodney states, Lara’s trendlines and confirmation points is the safest way to go…
Malcolm, entering now is a higher risk. Waiting for the blue trend line to be breached is lower risk. Waiting for 2,039.77 to be breached before entering is lowest risk.
Right now price is coming up to touch either the cyan bear market trend line (most likely). I may be looking for another entry for a small short there.
Do not risk more than 3-5% of equity on any one trade. If you try a higher risk trade then reduce position size to reduce risk further. My first short here is only 1.9% of my equity, very conservative.
If the bear count is right then any entry today should be good. But the risk right now is the first hourly count or some variation is right and price will turn up to move above 2,116.48.
Right now I’m placing my stops above 2,111.05. I always add 3X my broker spread to allow for volatility.
My target is 1,423 but that may change.
Actually saw a bit of volume in that last little dip…
We should soon negate that cash dump at 2084.45….
Bye… Bye…
Right On Time….
Joseph
April 22, 2016 at 9:51 am
Now to 10:30AM (maybe earlier) will be the last final attempt at a rally…. then down the remainder of Friday.
I don’t know how they can brush off all the earnings and revenue misses the last 24 hours after all the estimates were brought way down in the last several weeks. They screwed up in the estimate vs actual release game this quarter.
No hiding the reaction in NDX & COMP… all the other indexes to follow.
One “good” sign (for the bearish case)is the persistent absence of any real fear in the market in both near and mid-term time frames. Complacency still abounds….
VIX is basically flat! I agree, Complacency still abounds….
That is just mind boggling with all the Revenue & earnings misses from major companies.
Those are the perma-bulls who still see what’s happening as a buying opportunity. It makes one wonder where the networks were getting their propaganda about all the people short the market…
Vern,
I posted this earlier but repeat as you folks are talking about no fear
…. The National Association of Active Investment Managers (NAAIM) Exposure Index weekly, this week showed it jumped up to its highest reading since April 2015, showing that these market-timing managers are now at the most fully invested in a year. In spite of the SP500 ramp has now equaled the magnitude of its move off of the low following the August 2015 minicrash, these perma bull managers are more bullish on this rebound than they were on the last one.
Just filled wagons 6 and 7 of 8. The first five are already headed down the mountain to unload near the bottom.
Breakeven point or average entry price on TVIX at $4.03.
Why do you use TVIX?
With all the reverse splits on a bad move I made back in 2012 with TVIX… from 1000 shs. I am now the proud owner of 1 share. TVIX was one big FU. I keep it in my account still as a reminder of what not to do.
After studying UNVY this has more bang if you hit it right.
At that price be careful as they hit you with a reverse split out of no where.
Well Joseph, I must admit I am not certain as to why. I am continually learning. But it is the vehicle I have used for a while and I know it better than the others. Certainly I hope I do not experience the negative issues you had in the past. Perhaps the next round I will make the switch.
Just be careful … they hit me with a reverse split about two weeks after I bought the 1000 shs and at the same time the market moved against me.
Just one big FU. That was at a critical juncture… similar to now.
Would it have been different had you used UVXY?
No… Didn’t know of UVXY then. And was the 1st time I was doing a vol play. That reverse split is what threw me for a loop. No warning that I could fine. Had I know about RS I would have exited immediately.
But it was at a time of EWI saying “that’s it… top is in”. Big wave down has started. Moved down… then turned up on yet another extention of a wave. Very similar to today. But now we just know the outcome. That was the only position I took a loss on though. Stops were hit on others.
Joseph, Like you I learned a lot from EWI over more than a decade of paying for the subscription. First I learned about EW. Second I learned that if I followed their advice, I lost a lot of money. Third I learned that once a month was not nearly frequent enough to help. Finally, I learned that a forum of this sort where we can exchange ideas, thoughts, strategies and tactics, may be more valuable than anything else available.
For a long while now, I have refused to give Precter any more of my money!
EWI has cost a lot of their subscribers who wholly trusted their numerous erroneous calls in the market an awful lot of pain. Hulbert’s Digest consistently lists them at the very top of their list as the worst when it comes to market calls. I still have a subscription but I learned very early to not place trades based on their (really Bob’s)pompous pronouncements. In fact, it’s kinda funny as I finally sent Steve H an email letting him know that I finally started making money by doing the exact opposite of what his wave counts called for…hyuk! hyuk!
I must say he was a good sport and took it very well.
He responded with something like: “Well, we do the best we can…”
Lara, saved me from yet another extended wave a couple of years ago, her showing the Bull wave counts as well as the Bear wave counts is/are very valuable.
He videos are the best learning device.
I am now reading again the book EWP by Frost & your buddy. 1st read it back in 1980-81… but never counted myself.
I still have 3 of their services… because I like the different views and counts… as I have not yet been able to count. I now know that I need to learn this and do it myself as well. I have more time in my life to actually learn it. Never have before.
The actual shares of these things should never be held for more than a few weeks and ALWAYS hedged with covered calls sold against the long position imo…
I think Rodney knows what he is doing in this regard and will be taking profits in a very timely manner I am sure… 🙂
Speaking of which, the MMs now offering a 98/130 spread on my May 6 18.50 UVXY calls….yeah right!
Well, we’ll just see about that now won’t we?! 🙂
Yea… show them!
The truth is, they throw out those ridiculous bids only for the uninitiated. I am certain I could get anywhere from 1.25 – 1.30 for them If I were ready to unload; but, he! he!, now is certainly not the time to be selling UVXY calls. Heck, we have not even had a lil’ ole’ gap up open…. 🙂 🙂 🙂
I have a way go go on my UVXY shares. With covered calls and profit from puts looking at 22.50 for break-even. Every dollar above that is miles of smiles….. 🙂
I really dislike these round number protracted battles when a market decline is expected. The longer they go on the more likely it is we are looking at a consolidation as opposed to the start of a big wave down. If we are on the threshold of a primary wave down, it really should be picking up speed soon….
From Japanese Candlestick Charting Techniques, 2nd ed., Steve Nison
“Since the evening star is a top reversal, it should be acted upon if it arises after an uptrend.”
The evening star is a three candle combination. The first day of the current pattern was Tuesday, 4/19 , with the last yesterday, 4/21. Ideally, Tuesday would have been a longer real body. But it still works.
page 67,
“Some factors increasing the likelihood that an evening or morning star could be a reversal include:
1. If there is no overlap among the first, second, and third real bodies. (We had an overlap yesterday)
2. If the third candle closes deeply into the first candle’s real body. (Yesterday’s candle not only was deep into the first day’s real body, it enveloped / engulfed it!)
3. If there is light volume on the first candle session and heavy on the third candle session. This would show a reduction of the force of the prior trend and an increase in the direction force of the new trend. (Volume yesterday exceeded that of Tuesday.)
The highest high of the evening star will produce significant resistance. By the way, I think our current pattern would be better titled an Evening Doji Star since the middle star (4/20) is a doji. Page 61, “The star, especially the doji star, is a warning that the prior trend may be ending.”
Excellent book that,cheers for sharing
61.8% retracement of initial move down would be about 2100 for a potential B wave to end.
Huge cash dump on that initial spike down. Let’s see how long that bullish engulfing candle on the 5 min chart stays green before it makes like a chameleon…
The other possibility if you lower the wave degree at high of 2111.05 to minute 1 of 5 instead, then this could be a second wave correction with initial 5 wave down to 2084 representing a A wave to 38% retracement of move up from 2039. The 61.8% retracement would be about 2067 for the C wave. Really need 2039 to break.
Yep – until we take out 2039 this could morph into other structures that make new highs (and possibly even new ATH).
The lower trendline will be a good clue, but it is 50% reliable at best.
I just brought my short position up to 50% – might be early but this market looks pretty tired to me.
2084.45 SPX low in 1st 1 min of trading…
Initial reaction to all the bad earnings reports after the close yesterday and this morning.
Bottom line 2087.84 was penetrated…
I don’t believe this bounce back to 2092.13 will hold… market will fade.
Now to 10:30AM (maybe earlier) will be the last final attempt at a rally…. then down the remainder of Friday.
I don’t know how they can brush off all the earnings and revenue misses the last 24 hours after all the estimates were brought way down in the last several weeks. They screwed up in the estimate vs actual release game this quarter.
No hiding the reaction in NDX & COMP… all the other indexes to follow.
Great morning to all. Good news!
2087.84 broken on open. I have one chart telling me 2087.24 an another 2087.45. It really doesn’t matter all it takes is one tick below.
My chart shows we went down around 2083 at the open then shot higher.
As you say – this can no longer be minute (iv) (presuming minute (i) is where we have it labelled).
Lower trendline and Minor 4 @ around 2039 the next lines in the sand.
I’m guessing that the low around 2091.63 must have been minute (iv)… but I can’t tell
Ending diagonal still on the table???
Going above yesterdays high might indicate that is still in play.
This mornings move bounced straight off the lower trendline of this entire move from 1800’s
Yep! The shape of things to come as that candle gets fleshed out….can’t blame the banksters for trying… 🙂
An uncanny quiet in pre-market action. At these critical junctures the banksters typically try to intimidate the bears with jacked-up futures. They must be saving their firepower for the intra-day brouhaha. I am patiently waiting to see a decisive fall away from the pivots, which means at least 150 points down in DJI, and 20 points in SPX.
So I’ve entered a small short really just so I can sleep. Risking only 2% of equity on this one trade, stop just above yesterdays high.
I don’t want to get up at 2am again 🙁
I’m prepared to take a small loss and try again if I’m wrong.
See you all in the NY morning. Happy trading everyone!
Dammit.
That should be NY afternoon… my morning.
Time zones confuse me. I don’t know why… a mental block in that area I guess.
Sleep well my friend. As I said to you yesterday, any entry this week will turn out to be a good entry. And on behalf of all the members and forum participants, good trade on the long side.
Looks like it’s anybody guess what happens next! We either continue higher to finish a wave V or looking at the 5 min chart I can see a clear 5 down and what looks like an a,b,c correction playing out! Will it sell off in NY session? Let’s see!
I’m not really sure about Elliottwave trading as I’ve only been trading 2 weeks but I’m trying to learn from you folks!
If you’re new then wait for confirmation.
It reduces risk.
Risk management is the most important aspect of trading.
Lara, price dropped below the wave 1 end to 2183.84 at 10 am NZ time this morning, 1 hour after the NYSE close on my chart.
on the previous days comments, Lara explained that her analysis does not consider afterhours action.
Yeah, I know. And price has come back up again.
From the main hourly wave count:
“This first hourly wave count must be invalidated during the New York session for it to be invalidated. This Elliott wave analysis is based on the cash / spot price, not futures, so an Elliott wave analysis of futures may have slight differences. After hours price movement impacts this analysis only if price gaps up or down on the open.”
Good morning all from the UK. Let’s hope we see some fireworks today in the bearish direction.
Futures really moving now,, down a quarter,, and good going Ris,, Lara doesn’t count,, hee heee so I am 2
SPX futures surging, back up a quarter now! lol
You crack me up doc… Goodnight and TGIF, almost.
#1
NAAIM reading shows fund managers are fully invested and most bullish as of this week. Magnitude equal to ramp off August mini crash 2015.
So the ramp did the trick by getting folks to buy the rally. Now let’s see how the market works.
LOL
I was waiting for someone else to be first before I jumped in…
I forgot to mention another bearish indicator today.
Todays red candlestick completes an Evening Star Doji candlestick reversal pattern.
Lara,, get some sleep,, you are so tired you are seeing stars. you can tell me, I’m a doctor. (thanks Olga, I’m hanging on to that one)
No worries. I will sleep early and get up about 2am NZ time. That should be okay.
😉 🙂 🙂
I also noticed a few intra-day upward gaps on Wednesday that may turn out to have also been exhaustion gaps.