Last Nasdaq analysis expected upwards movement to end about 4,784. This has not happened. Price continues to move upwards.
Summary: Nasdaq is still in a bear market, until proven otherwise. A big third wave down is close. If this current bounce continues, it may end when price finds resistance at the bear market trend line.
New updates to this analysis are in bold.
BEAR WAVE COUNT
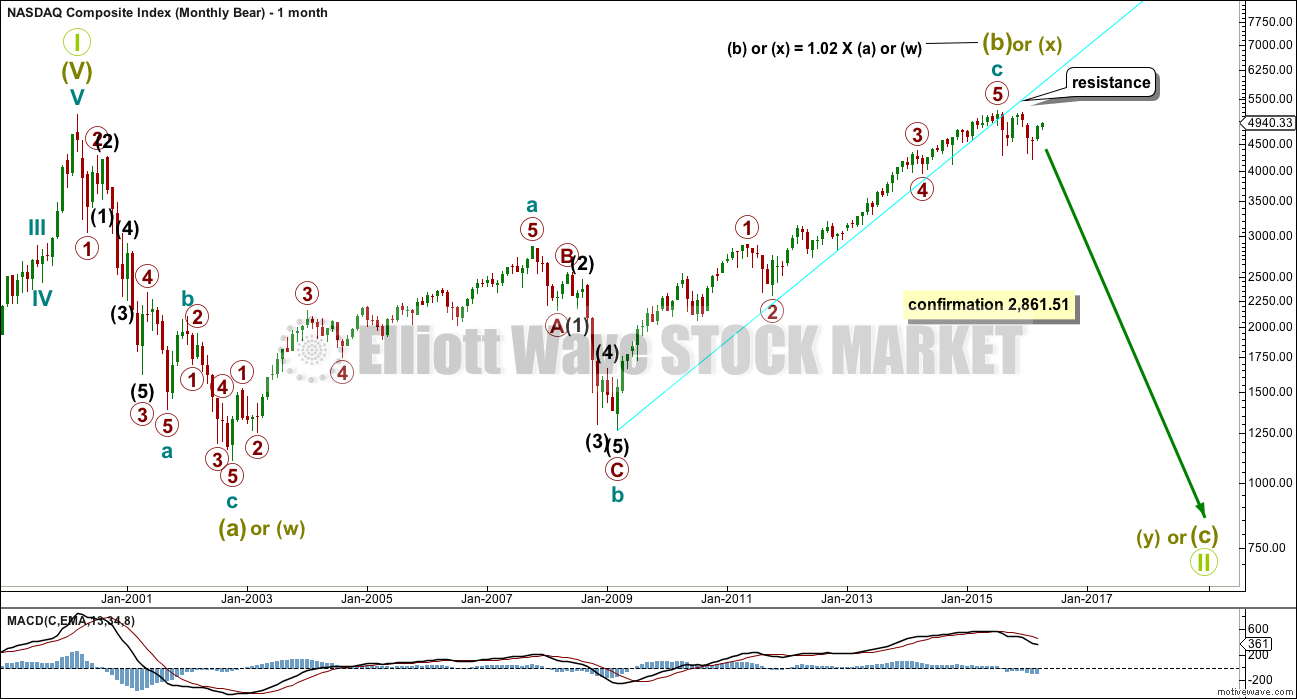
MONTHLY CHART
Grand Super Cycle wave II may be an incomplete flat, combination or double flat.
A new low below 2,861.51 would invalidate the bull wave count and confirm a huge market crash.
All subdivisions are seen in exactly the same way, only the degree of labelling is different.
If Grand Super Cycle wave II is a combination, then super cycle wave (y) would be a zigzag or triangle.
If Grand Super Cycle wave II is a double flat, then super cycle wave (y) would be a flat correction ending about the same level as super cycle wave (w) at 1,160.
If Grand Super Cycle wave II is a regular flat, then super cycle wave (c) would be a five wave structure to end below super cycle wave (a) at 1,160 to avoid a truncation.
WEEKLY CHART
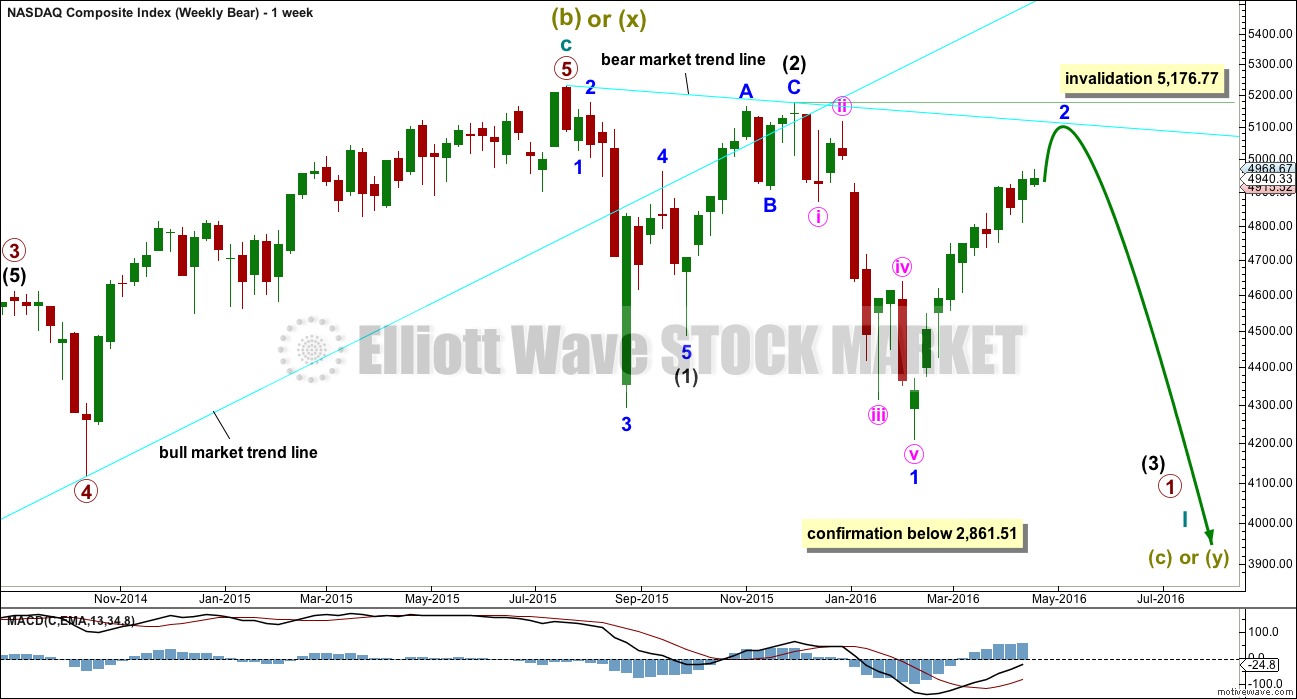
Downwards movement from the all time high may be a first wave for intermediate wave (1), a deep second wave correction for intermediate wave (2), and now an incomplete third wave for intermediate wave (3).
Intermediate wave (1) may have ended with a truncation. This is possible after the prior move of minor wave 3 moved “too far too fast”.
With intermediate wave (1) seen as over with a truncation, the structure of intermediate wave (2) now fits as a zigzag. It looks like a three.
Intermediate wave (3) must move far enough below the price extreme of intermediate wave (1) to allow for room for the following correction of intermediate wave (4) to unfold and not move back into intermediate wave (1) price territory.
The prior bull market trend line was breached by a close (on a daily basis) by more than 3% of market value on 24th August 2015. This indicated the market had changed from bull to bear. The same technique will be used again, in the opposite direction.
A bear market trend line is drawn from the all time high to the first major swing high within the bear market labelled intermediate wave (2). The bear market should be expected to remain intact while price remains below this trend line. When this trend line is breached by a close (on a daily basis) of 3% or more of market value, then it would be indicating a trend change from bear to bull.
This technique is outlined by Magee in the classic “Technical Analysis of Stock Trends”. It is simple and simple is best.
DAILY CHART
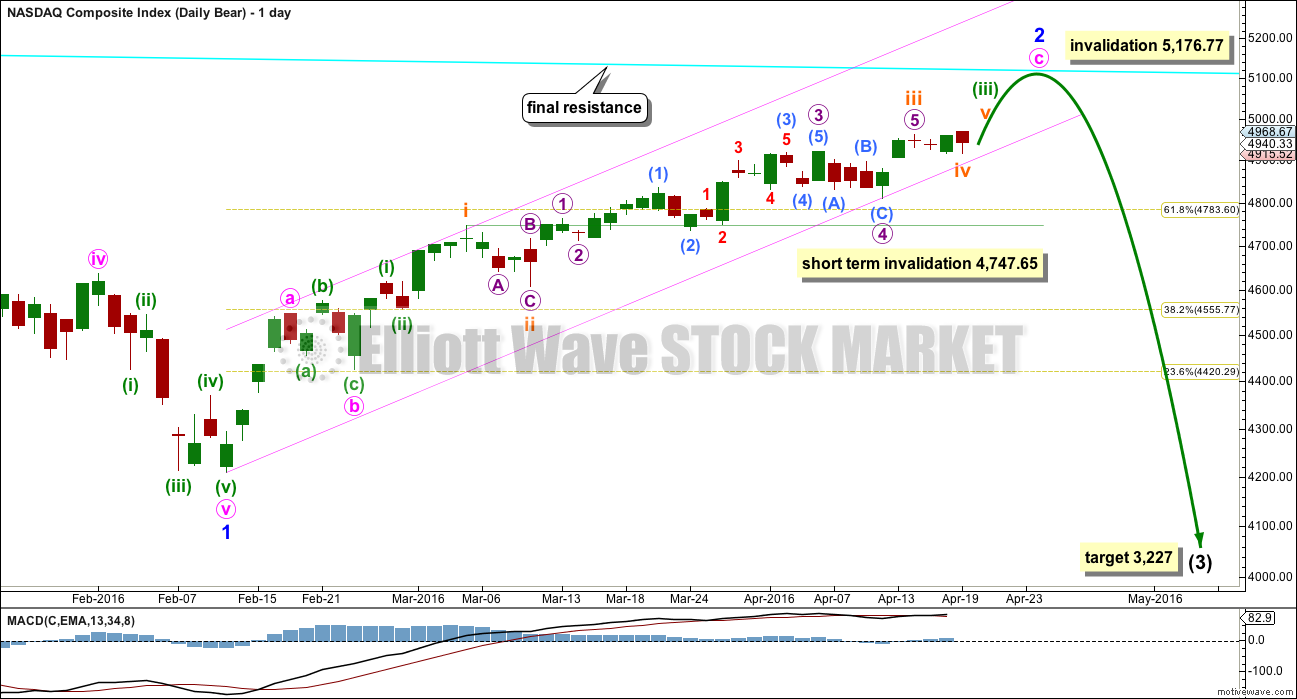
Within intermediate wave (3), an impulse is complete for minor wave 1.
Minor wave 2 may be a zigzag. It may end when price finds resistance at the bear market trend line.
The pink channel is a best fit about this upwards movement. When it is clearly breached by downwards movement, that shall be early indication of a trend change.
Within minor wave 2, the correction for subminuette wave iv may not move into subminuette wave i price territory below 4,747.65.
A third wave within a third wave down would be expected for this wave count when minor wave 2 is over. At 3,227 intermediate wave (3) would reach 2.618 the length of intermediate wave (1).
Minor wave 2 may not move beyond the start of minor wave 1 above 5,176.77.
BULL WAVE COUNT
MONTHLY CHART
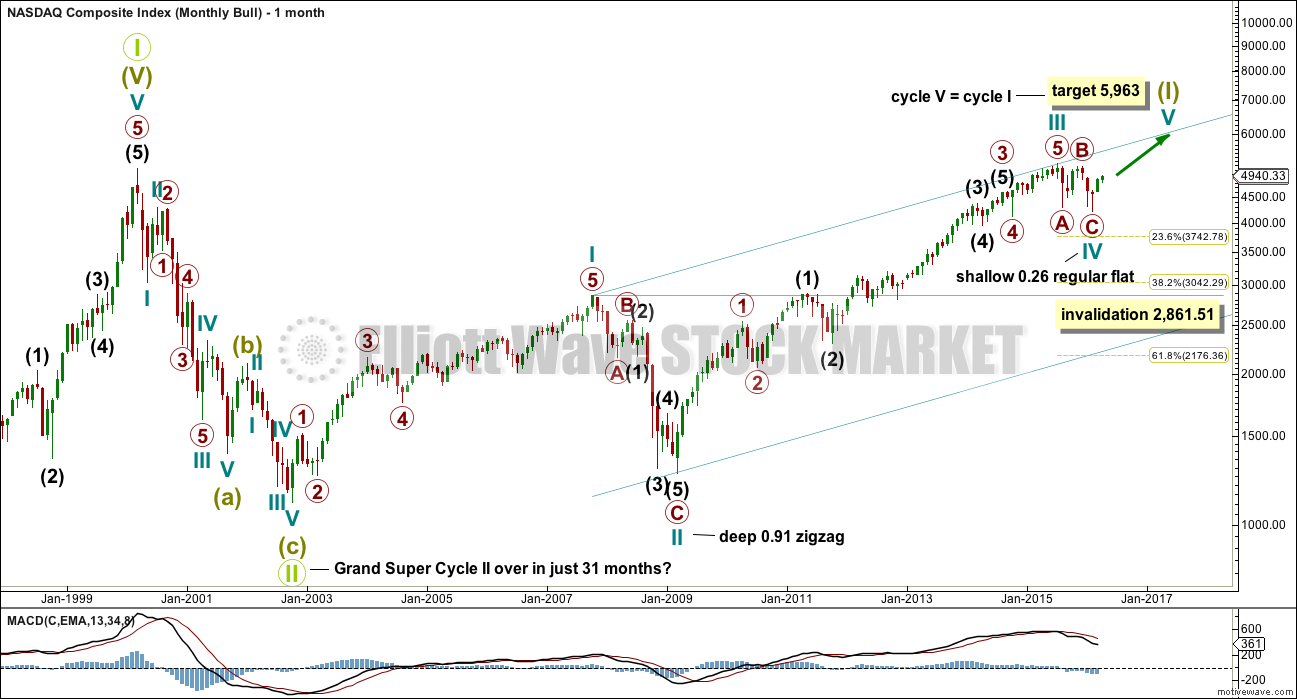
Grand Super Cycle wave II is seen here as over in just 31 months. This is possible, but it is more likely it would last longer than this.
This wave count sees Nasdaq in a Grand Super Cycle wave III upwards.
There is no Fibonacci ratio between cycle waves I and III.
Super Cycle wave (I) is an incomplete impulse. Within Super Cycle wave (I), cycle wave IV may be complete.
Cycle wave II was a very deep 0.91 zigzag lasting 17 months. Cycle wave IV may have exhibited alternation as a shallow flat lasting just 7 months. This is possible, but what is equally as possible is cycle wave IV may continue sideways as a double flat or double combination. Only a clear five up on the daily chart would eliminate these possibilities. A trend change at cycle degree requires confirmation with a new high above 5,176.77 (to invalidate the bear count) and a five wave structure upwards on the daily chart.
Cycle wave IV may not move into cycle wave I price territory below 2,861.51.
WEEKLY CHART
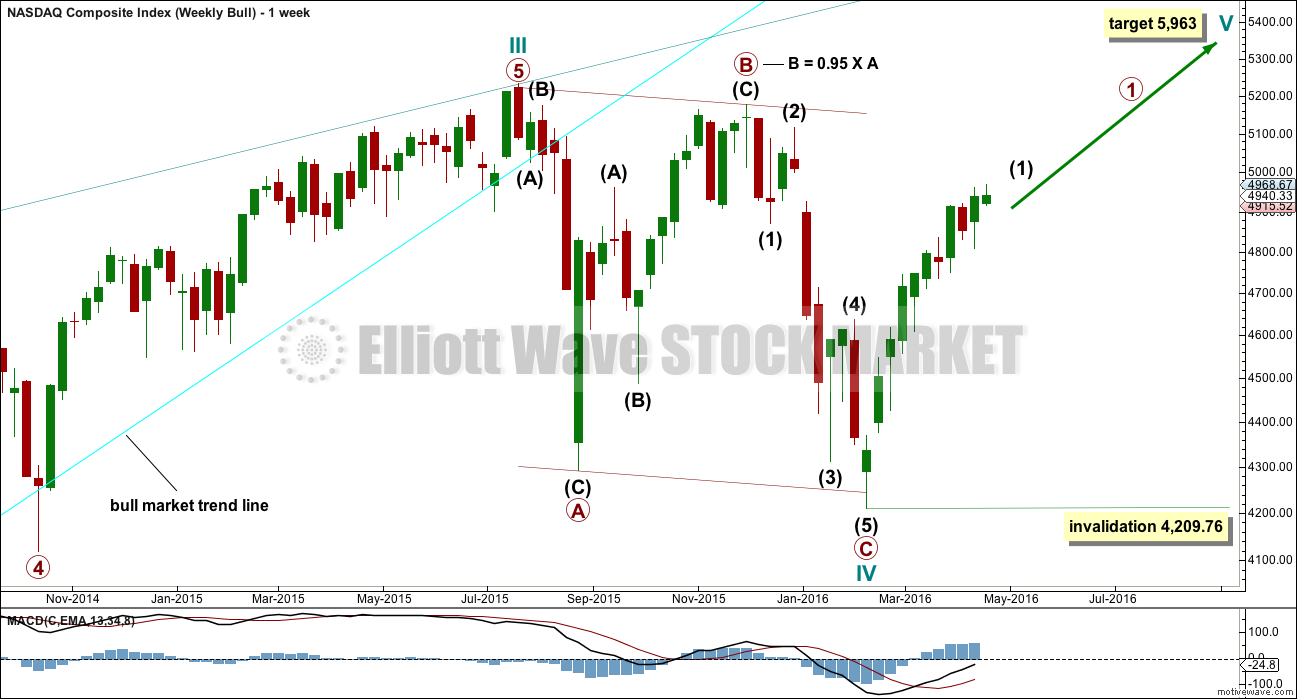
Cycle wave IV is most likely to be a flat, combination or triangle to exhibit structural alternation with the zigzag of cycle wave II.
Regular flats fit well within trend channels. Their C waves normally are about even in length with their A waves. Primary wave C is just 35.97 points longer than equality in length with primary wave A.
The degree of labelling within cycle wave IV may be moved down one degree. This flat correction may be only primary wave A of a larger flat, or a triangle, or primary wave W of a double flat or double combination. A clear five wave structure upwards on the daily chart is absolutely required before any confidence may be had in this wave count. A new cycle degree bull market should last one to several years. Waiting for confirmation is a wise idea.
TECHNICAL ANALYSIS
MONTHLY CHART
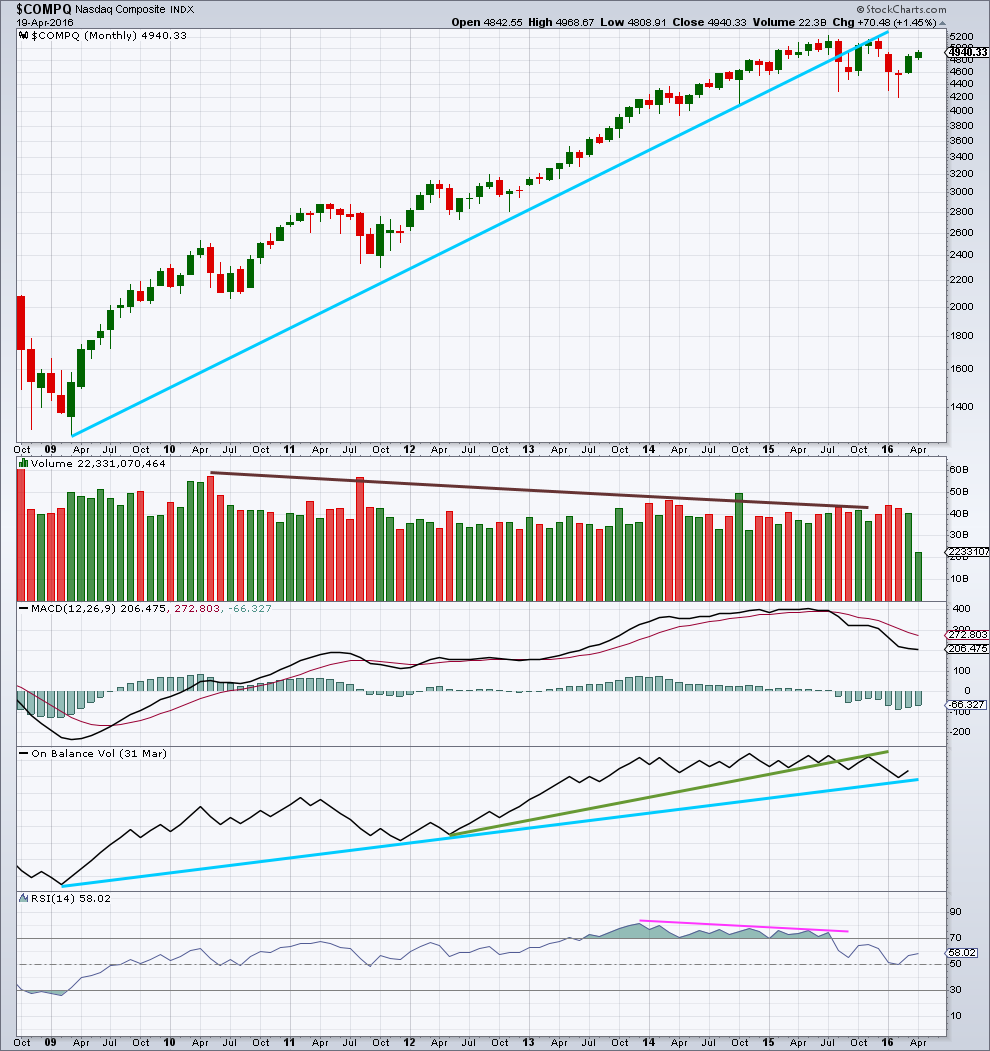
Click chart to enlarge. Chart courtesy of StockCharts.com.
A more conservatively drawn trend line from the end of March 2009 is drawn here (blue line). It was reasonably shallow, repeatedly tested, and is highly technically significant. It has been breached and provided resistance.
Since May 2010, overall, as price rose to all time highs volume declined. The bull market was not well supported by volume and is suspicious.
There was slight negative technical divergence with price and MACD at the all time high.
On Balance Volume has breached a trend line held since May 2012, (green line) which is bearish. OBV turned up and tested the green line which held. The strength of that line is reinforced. This is further bearish indication. OBV has found support at the blue line. A breach of this blue line would be very strong bearish indication. This line is highly technically significant because it is long held and tested three times at the monthly chart level.
There is negative divergence between price and RSI going back to December 2013, as price made all time highs. This is a strong bearish indicator. This was also seen up to March 2000, and was followed by a 78% drop in market value to the low of 1,108 in October 2012. It does not mean that the market must make a similar fall at this time, but it is a strong bearish indicator.
DAILY CHART
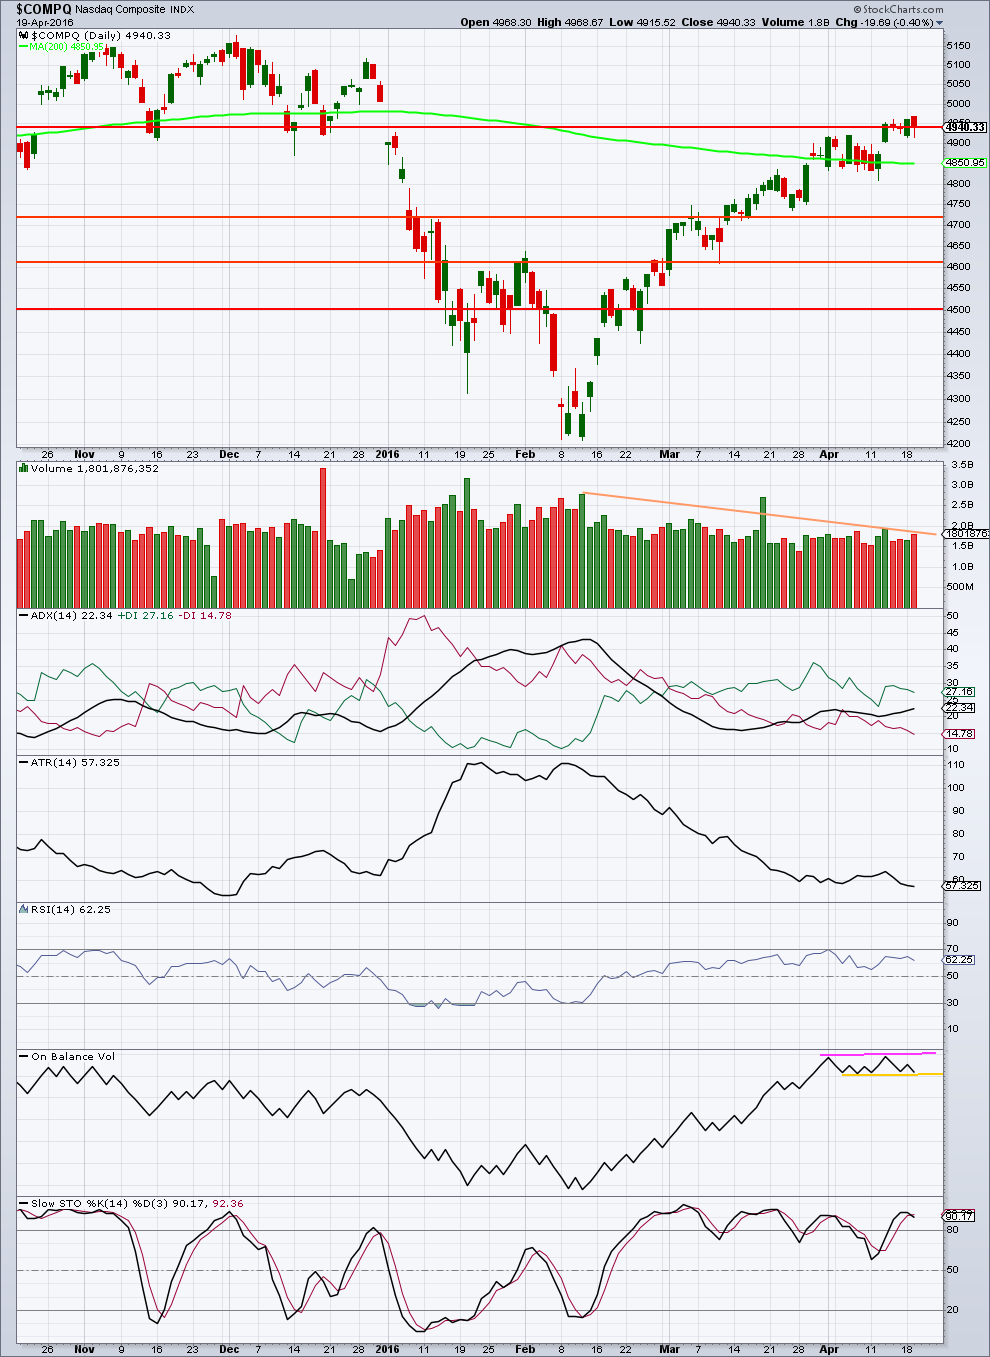
Click chart to enlarge. Chart courtesy of StockCharts.com.
Nasdaq is in a bear market until proven otherwise.
1. The 200 day moving average is flat to declining.
2. Price has breached a bull market trend line.
3. Price remains below a bear market trend line.
4. From the all time high, price has made a series of lower lows and lower highs.
5. Bear market rallies from the all time high have been very deep and fully retraced.
Even if one of these five conditions is broken, that would not alone be enough to confirm an end to the bear market and a new bull market. The one thing which would fully and finally confirm a new bull market would be a new all time high. Prior to that a balance of these conditions being broken would strongly indicate a new bull market.
It should always be assumed that the trend remains the same, until proven otherwise.
As price moves higher for several weeks now in a bear market rally, it comes on overall declining volume. The rise in price is not supported by volume and is unsustainable.
ADX indicates there is currently an upwards trend.
ATR disagrees. ATR declining is more normal for a consolidating market than a trending market. This upwards trend is not normal; it comes with a decline in range. This indicates weakness in the trend.
On Balance Volume is currently constrained within two trend lines. A break above the pink trend line would be a short term bullish signal. A break below the yellow line would be a short term bearish signal.
RSI exhibits divergence between price at the current high and the highs a few days ago of 1st April. This indicates that upwards movement from price is weak.
Stochastics exhibits divergence between price at the current high and the high of 3rd March. This also indicates upwards movement from price is weak.
On balance, there is enough weakness from price to judge that this upwards movement is more likely a bear market rally than a new bull market. This upwards movement should be expected to be fully retraced.
This analysis is published @ 05:07 a.m. EST on 20th April, 2016.

Rodney,
Based on the earning reports so far I don’t know how and why NASDAQ will push higher. I know there are influences but the truth of earnings doesn’t provide the urge to buy NASDAQ stocks in a hurry. Waiting and watching for now.
Thanks Lara. I have some concerns as I read this analysis. It presents a picture where the NASDAQ will be heading much higher for a while. This would indicate that the SPX will make a new all time high. If the NASDAQ moves to 5177 that is an almost 5% move which correlates to a 100 point move in the SPX.
I appreciate any thoughts you have on this.
It doesn’t have to reach up to touch that resistance line (main bear count).
It could turn any time.
that assumes my analysis of the upwards zigzag is wrong
and it may be
Thanks Lara!
You’re welcome